| Param | Original file | Final file |
|---|---|---|
| Filename | modeM0/AS1A02_005T01_9000000948_06876cztM0_level2.evt | modeM0/AS1A02_005T01_9000000948_06876cztM0_level2_quad_clean.evt |
| Size (bytes) | 444,746,880 | 75,012,480 |
| Size | 424.1 MB | 71.5 MB |
| Events in quadrant A | 3,134,010 | 459,314 |
| Events in quadrant B | 3,317,051 | 465,437 |
| Events in quadrant C | 3,271,949 | 465,180 |
| Events in quadrant D | 3,321,983 | 445,629 |
| Mode SS | |||
|---|---|---|---|
| Quadrant | BADHDUFLAG | Total packets | Discarded packets |
| A | 0 | 128 | 0 |
| B | 0 | 128 | 0 |
| C | 0 | 128 | 0 |
| D | 0 | 128 | 0 |
| Mode M0 | |||
|---|---|---|---|
| Quadrant | BADHDUFLAG | Total packets | Discarded packets |
| A | 0 | 13397 | 3 |
| B | 0 | 13885 | 2 |
| C | 0 | 13548 | 2 |
| D | 0 | 13867 | 2 |
| Mode M9 | |||
|---|---|---|---|
| Quadrant | BADHDUFLAG | Total packets | Discarded packets |
| A | 0 | 14 | 0 |
| B | 0 | 14 | 0 |
| C | 0 | 14 | 0 |
| D | 0 | 15 | 0 |
| Quadrant | Total seconds | Saturated seconds | Saturation percentage |
|---|---|---|---|
| A | 6238 | 85 | 1.362616% |
| B | 6238 | 90 | 1.442770% |
| C | 6238 | 98 | 1.571016% |
| D | 6238 | 109 | 1.747355% |
Noise dominated data is calculated using 1-second bins in cleaned event files. If a bin has >2000 counts, and if more than 50% of those come from <1% of pixels, then it is considered to be noise-dominated and hence unusable.
| Quadrant | # 1 sec bins | Bins with >0 counts | Bins with >2000 counts | High rate bins dominated by noise | Noise dominated (total time) | Noise dominated (detector-on time) | Marked lightcurve |
|---|---|---|---|---|---|---|---|
| A | 7493 | 6239 | 2 | 2 | 0.03% | 0.03% | 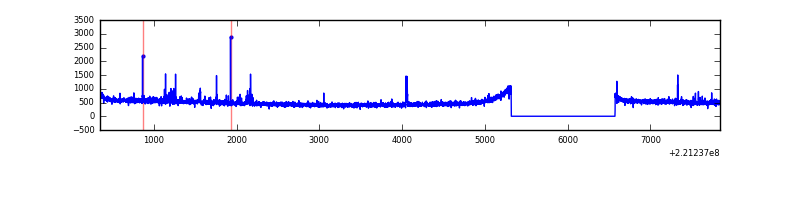 |
| B | 7493 | 6239 | 0 | 0 | 0.00% | 0.00% | 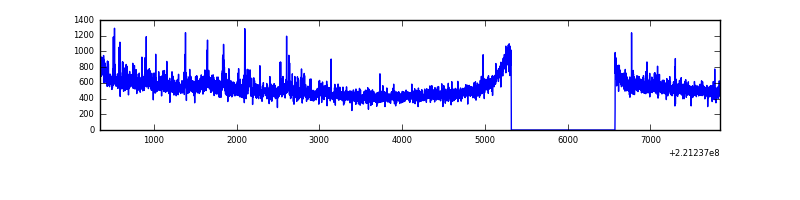 |
| C | 7493 | 6239 | 1 | 1 | 0.01% | 0.02% | 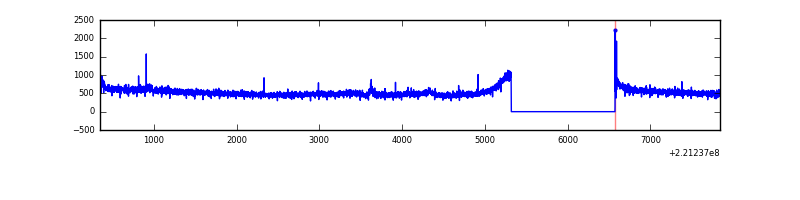 |
| D | 7493 | 6239 | 22 | 22 | 0.29% | 0.35% | 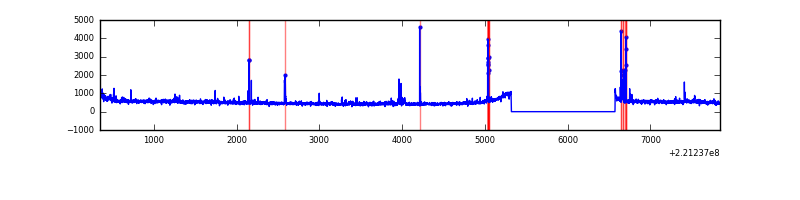 |
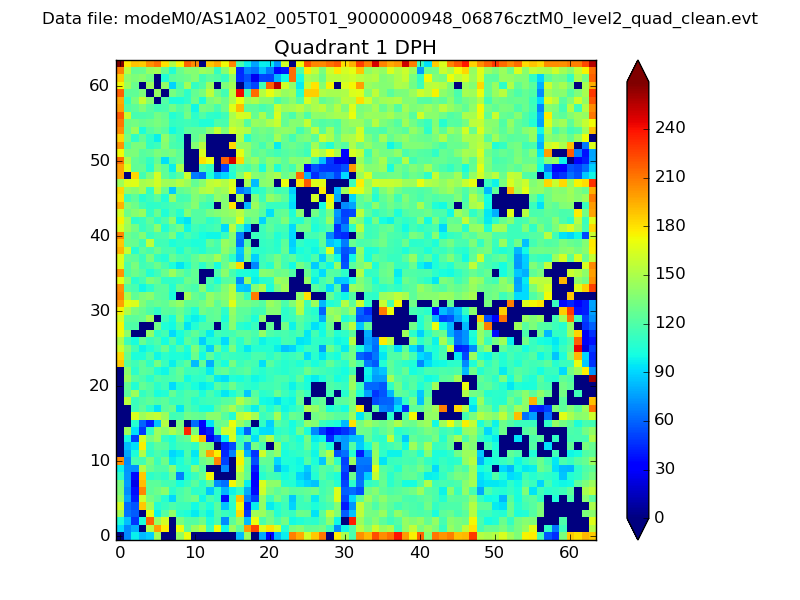
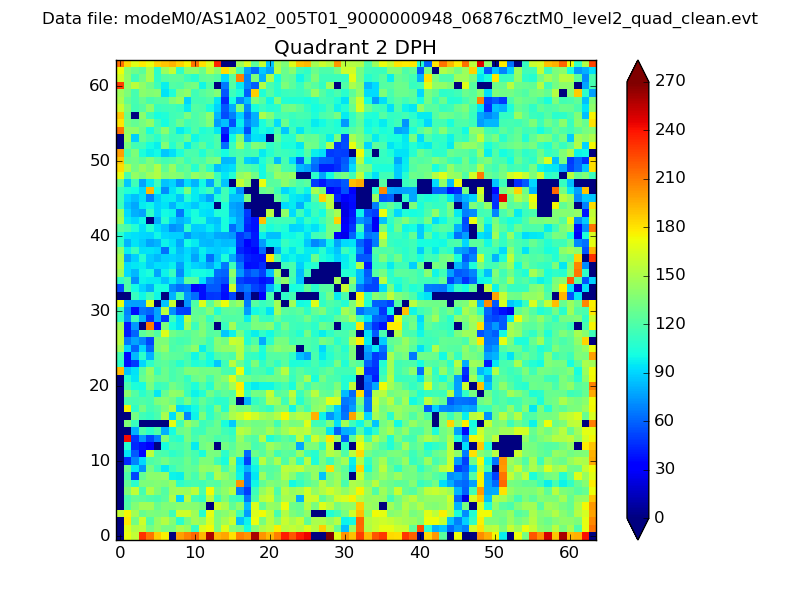
Top three noisy pixels from each quadrant. If the there are fewer than three noisy pixels in the level2.evt file, extra rows are filled as -1
| Pixel properties | Quadrant properties | ||||||
|---|---|---|---|---|---|---|---|
| Quadrant | DetID | PixID | Counts | Sigma | Mean | Median | Sigma |
| A | 15 | 223 | 51514 | 315.23 | 794 | 778 | 161.0 |
| A | 13 | 248 | 18668 | 111.15 | 794 | 778 | 161.0 |
| A | 0 | 226 | 7664 | 42.78 | 794 | 778 | 161.0 |
| B | 0 | 219 | 108815 | 716.67 | 801 | 783 | 150.7 |
| B | 15 | 204 | 44039 | 286.96 | 801 | 783 | 150.7 |
| B | 0 | 214 | 41054 | 267.15 | 801 | 783 | 150.7 |
| C | 9 | 247 | 221343 | 1222.1 | 779 | 784 | 180.5 |
| C | 13 | 61 | 6280 | 30.45 | 779 | 784 | 180.5 |
| C | 9 | 16 | 5237 | 24.67 | 779 | 784 | 180.5 |
| D | 13 | 169 | 121729 | 640.42 | 779 | 756 | 188.9 |
| D | 8 | 195 | 84908 | 445.49 | 779 | 756 | 188.9 |
| D | 12 | 221 | 78576 | 411.97 | 779 | 756 | 188.9 |
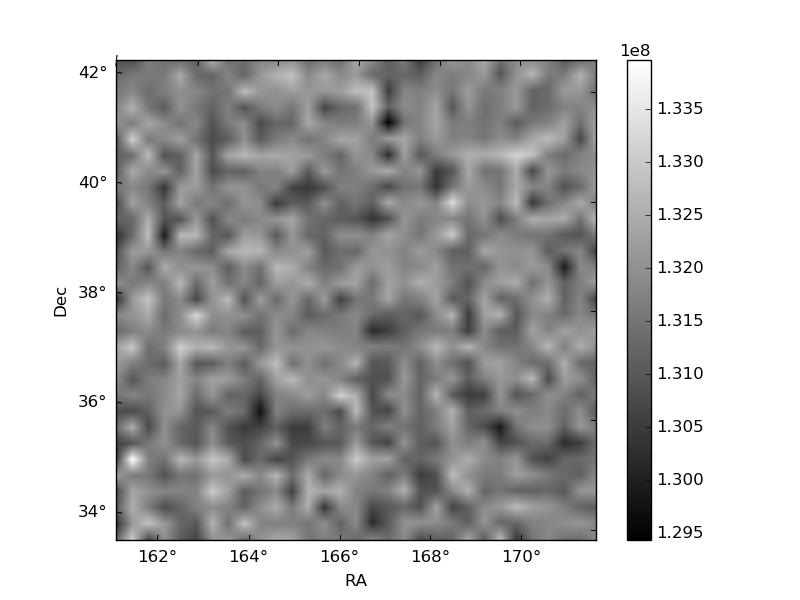
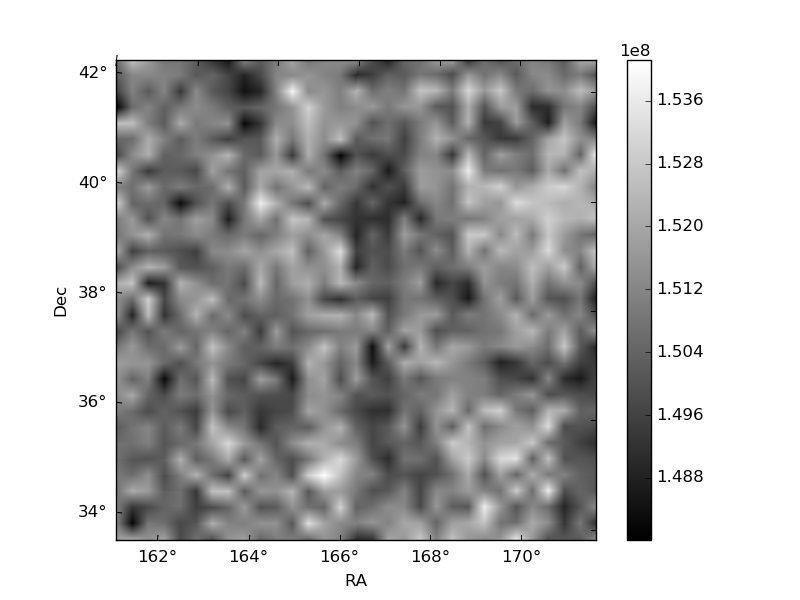
Histogram calculated using DETX and DETY for each event in the final _common_clean file
| Quadrant A | 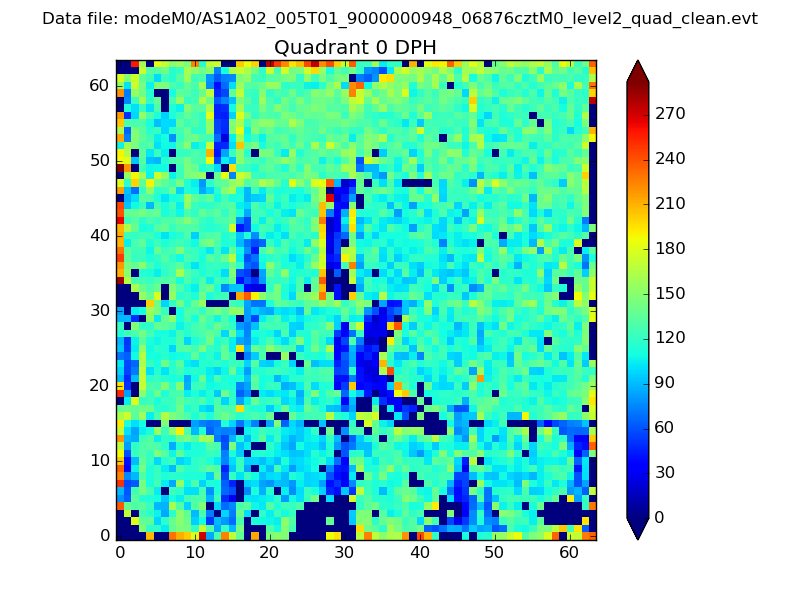 |
 |
Quadrant B |
|---|---|---|---|
| Quadrant D | 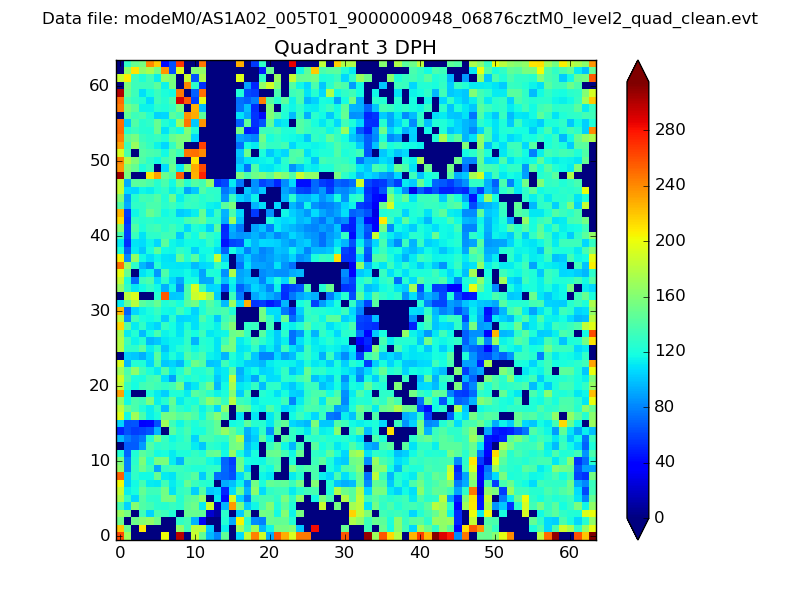 |
 |
Quadrant C |
| Plot type | Count rate plots | Images |
|---|---|---|
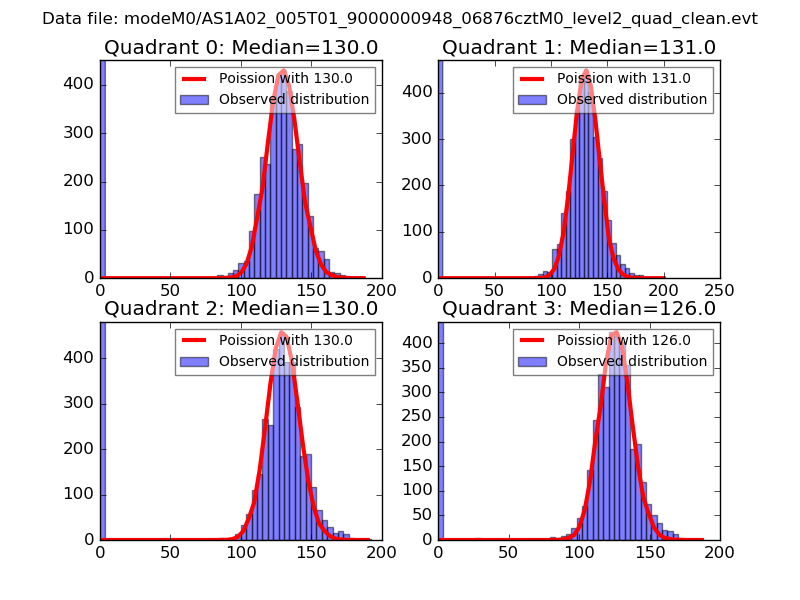
| Comparison with Poisson distribution Blue bars denote a histogram of data divided into 1 sec bins. Red curve is a Poisson curve with rate = median count rate of data. |
 |
 |
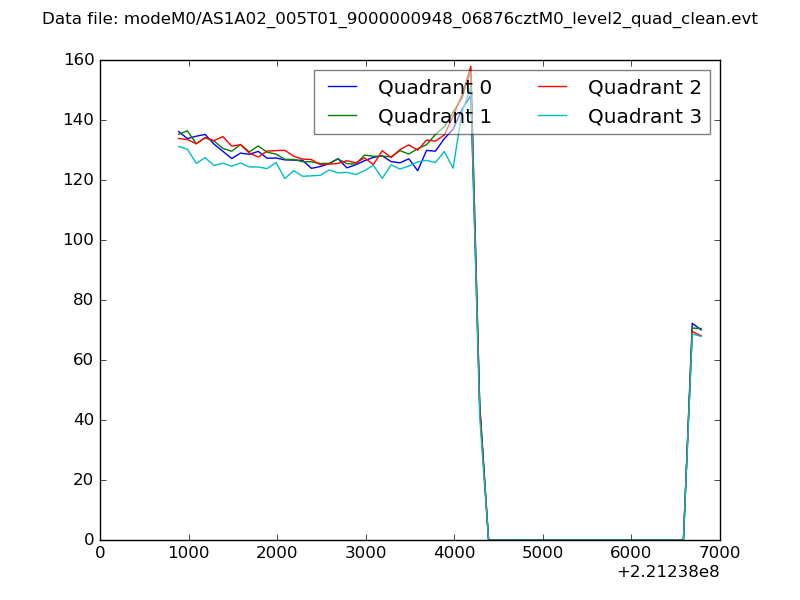
| Quadrant-wise count rates Data is divided into 100 sec bins |
 |
|
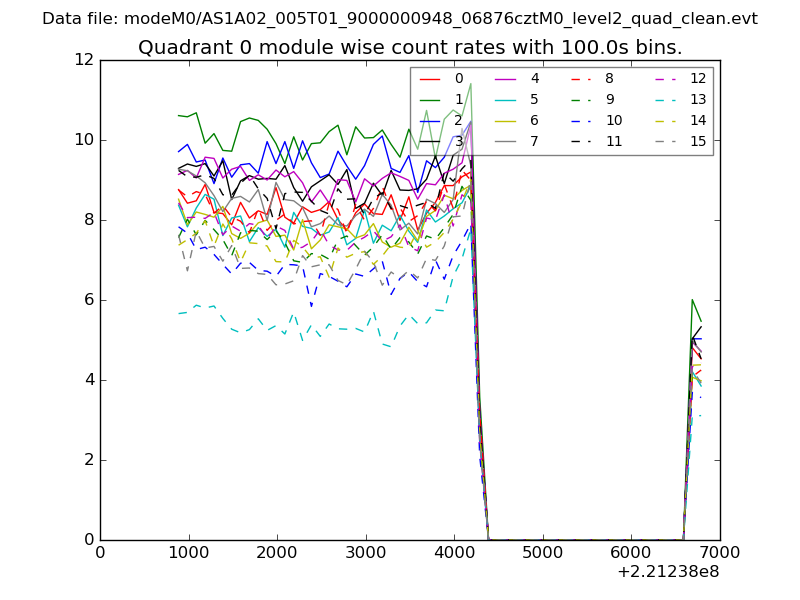
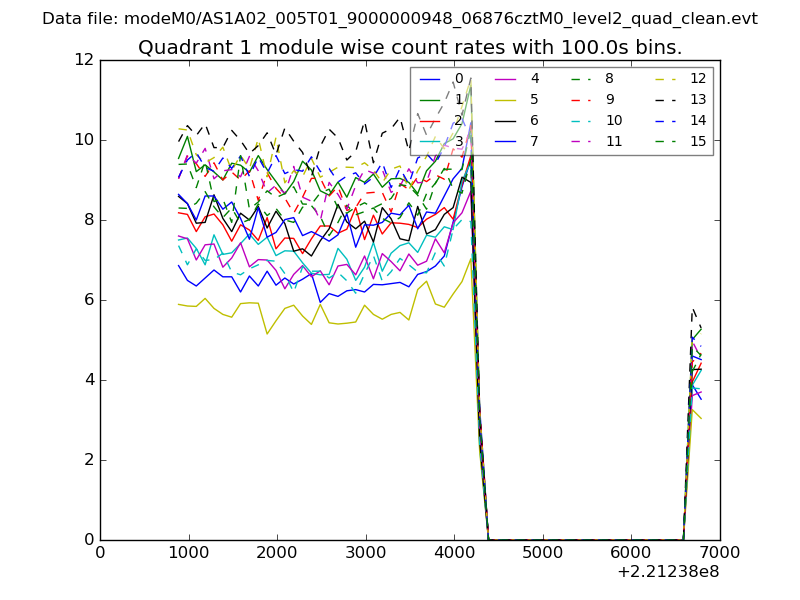
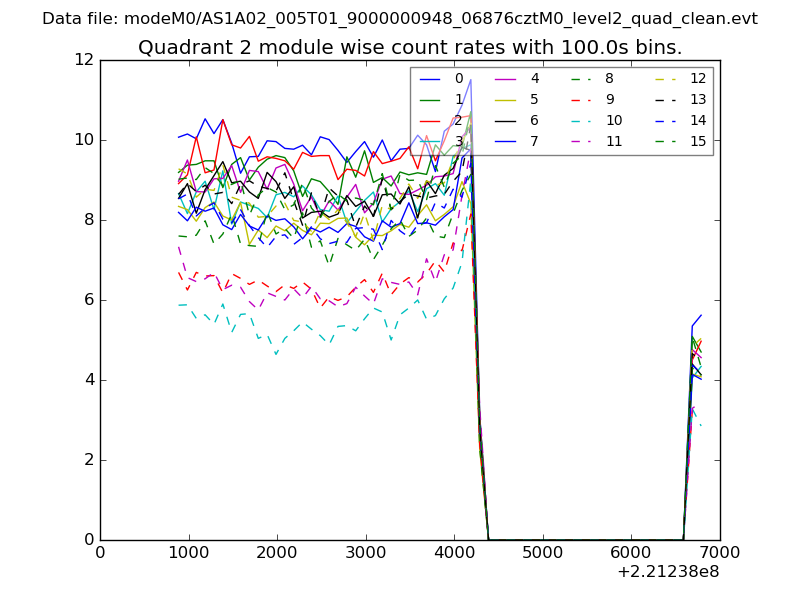
| Module-wise count rates for Quadrant A Data is divided into 100 sec bins |
 |
 |
| Module-wise count rates for Quadrant B Data is divided into 100 sec bins |
 |
 |
| Module-wise count rates for Quadrant C Data is divided into 100 sec bins |
 |
 |
| Module-wise count rates for Quadrant D Data is divided into 100 sec bins |
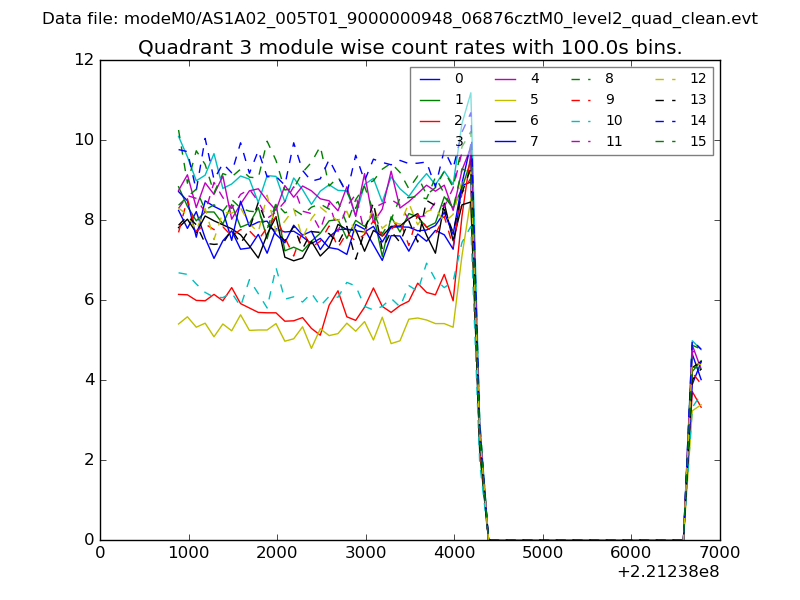 |
 |
| Parameter | Plot |
|---|---|
| CZT HV Monitor | 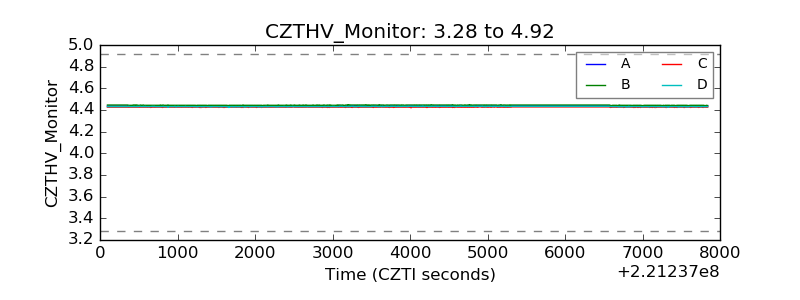 |
| D_VDD | 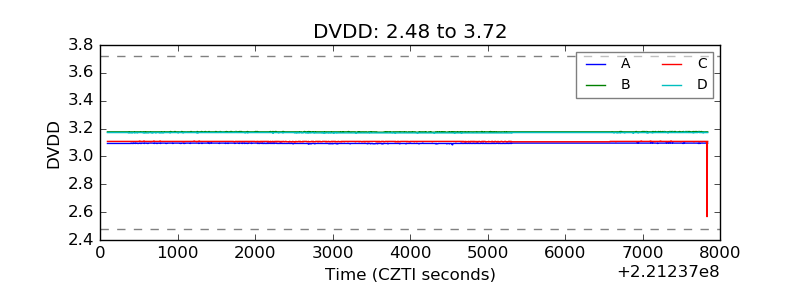 |
| Temperature 1 | 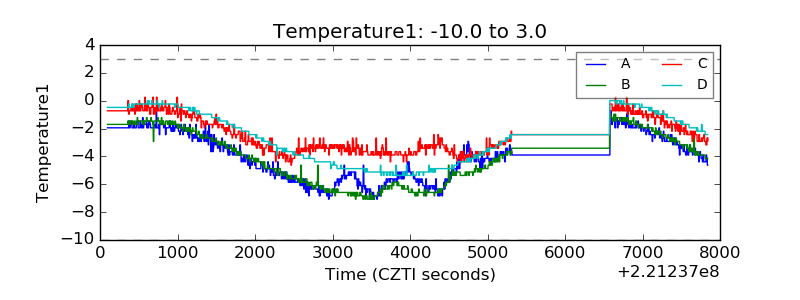 |
| Veto HV Monitor | 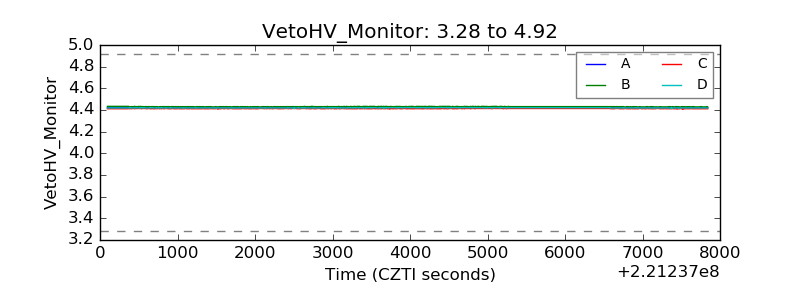 |
| Veto LLD | 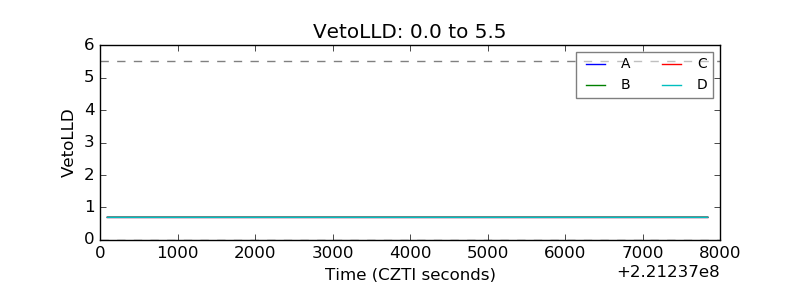 |
| Alpha Counter | 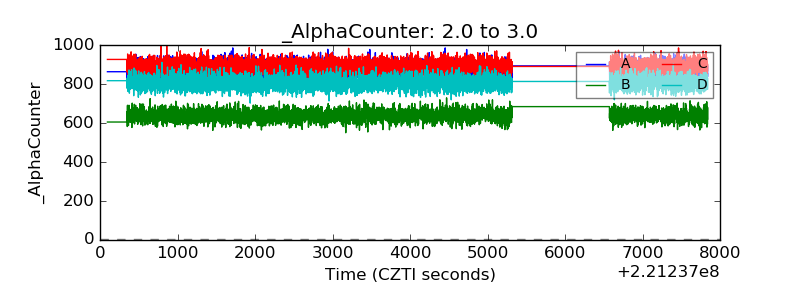 |
| _CPM_Rate | 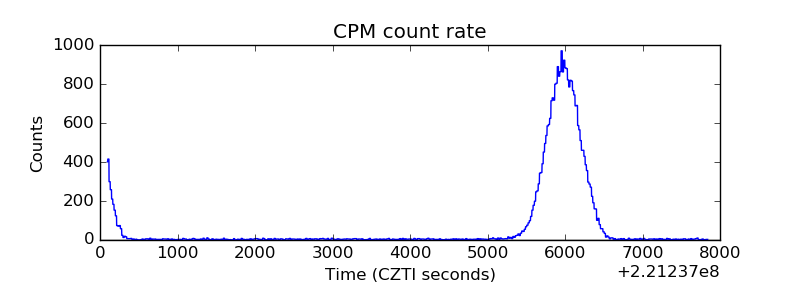 |
| CZT Counter | 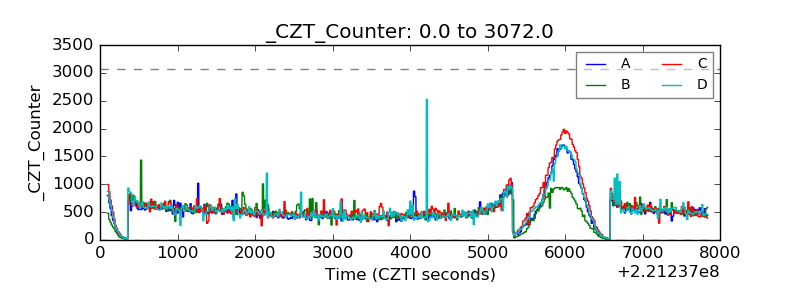 |
| +2.5 Volts monitor |  |
| +5 Volts monitor | 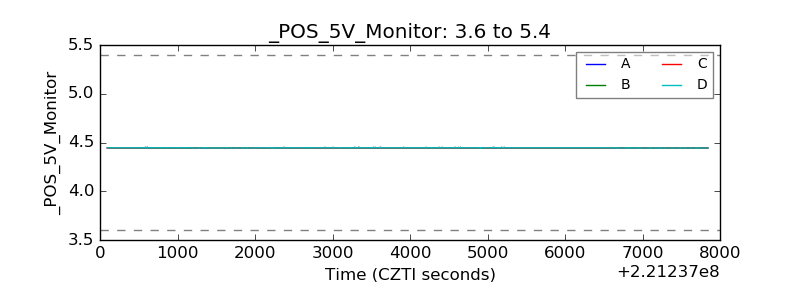 |
| _ROLL_ROT | 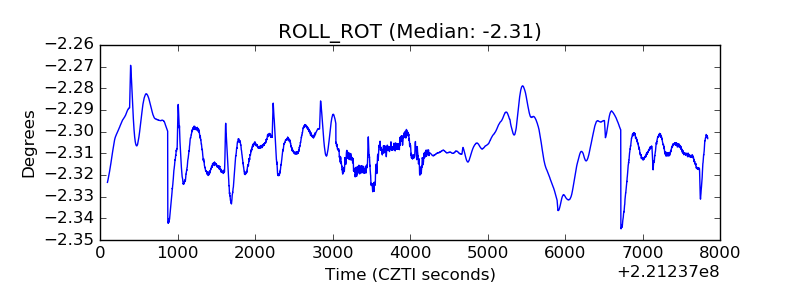 |
| _Roll_DEC | 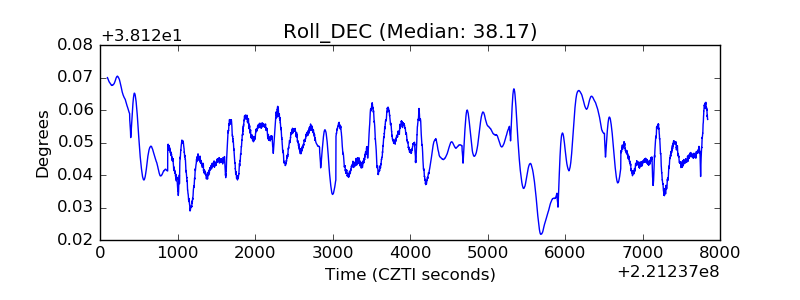 |
| _Roll_RA | 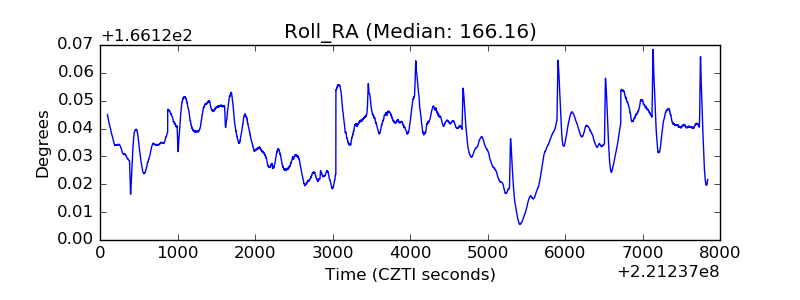 |
| Veto Counter | 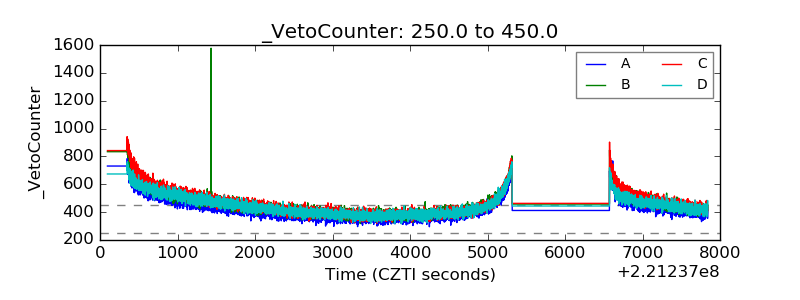 |