| Param | Original file | Final file |
|---|---|---|
| Filename | modeM0/AS1A02_005T01_9000000948_06877cztM0_level2.evt | modeM0/AS1A02_005T01_9000000948_06877cztM0_level2_quad_clean.evt |
| Size (bytes) | 452,825,280 | 86,699,520 |
| Size | 431.8 MB | 82.7 MB |
| Events in quadrant A | 3,150,750 | 542,152 |
| Events in quadrant B | 3,246,211 | 550,863 |
| Events in quadrant C | 3,362,371 | 547,629 |
| Events in quadrant D | 3,507,057 | 525,975 |
| Mode SS | |||
|---|---|---|---|
| Quadrant | BADHDUFLAG | Total packets | Discarded packets |
| A | 0 | 136 | 0 |
| B | 0 | 136 | 0 |
| C | 0 | 136 | 0 |
| D | 0 | 136 | 0 |
| Mode M0 | |||
|---|---|---|---|
| Quadrant | BADHDUFLAG | Total packets | Discarded packets |
| A | 0 | 13744 | 3 |
| B | 0 | 14015 | 2 |
| C | 0 | 14091 | 2 |
| D | 0 | 14958 | 2 |
| Mode M9 | |||
|---|---|---|---|
| Quadrant | BADHDUFLAG | Total packets | Discarded packets |
| A | 0 | 23 | 0 |
| B | 0 | 23 | 0 |
| C | 0 | 23 | 0 |
| D | 0 | 23 | 0 |
| Quadrant | Total seconds | Saturated seconds | Saturation percentage |
|---|---|---|---|
| A | 6580 | 73 | 1.109422% |
| B | 6580 | 95 | 1.443769% |
| C | 6580 | 104 | 1.580547% |
| D | 6580 | 127 | 1.930091% |
Noise dominated data is calculated using 1-second bins in cleaned event files. If a bin has >2000 counts, and if more than 50% of those come from <1% of pixels, then it is considered to be noise-dominated and hence unusable.
| Quadrant | # 1 sec bins | Bins with >0 counts | Bins with >2000 counts | High rate bins dominated by noise | Noise dominated (total time) | Noise dominated (detector-on time) | Marked lightcurve |
|---|---|---|---|---|---|---|---|
| A | 8880 | 6582 | 0 | 0 | 0.00% | 0.00% | 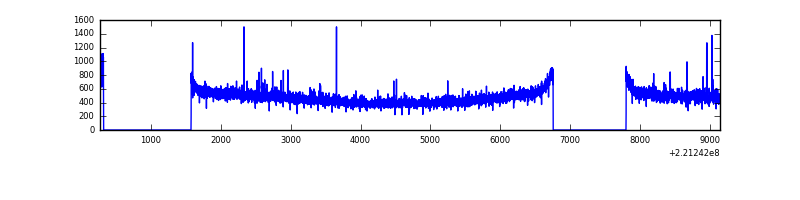 |
| B | 8880 | 6582 | 0 | 0 | 0.00% | 0.00% | 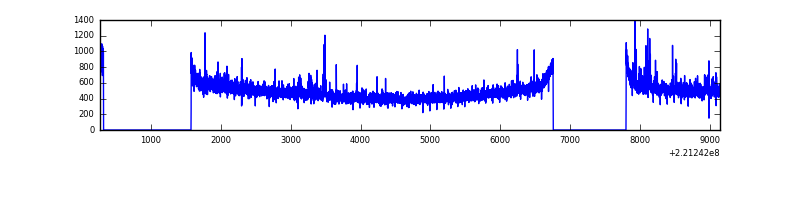 |
| C | 8880 | 6582 | 1 | 1 | 0.01% | 0.02% |  |
| D | 8880 | 6582 | 30 | 30 | 0.34% | 0.46% |  |
Top three noisy pixels from each quadrant. If the there are fewer than three noisy pixels in the level2.evt file, extra rows are filled as -1
| Pixel properties | Quadrant properties | ||||||
|---|---|---|---|---|---|---|---|
| Quadrant | DetID | PixID | Counts | Sigma | Mean | Median | Sigma |
| A | 13 | 251 | 30392 | 181.83 | 802 | 786 | 162.8 |
| A | 15 | 223 | 10920 | 62.24 | 802 | 786 | 162.8 |
| A | 0 | 226 | 7843 | 43.34 | 802 | 786 | 162.8 |
| B | 15 | 204 | 41393 | 264.26 | 809 | 791 | 153.6 |
| B | 0 | 214 | 26282 | 165.91 | 809 | 791 | 153.6 |
| B | 4 | 80 | 15354 | 94.78 | 809 | 791 | 153.6 |
| C | 9 | 247 | 291361 | 1594.74 | 785 | 790 | 182.2 |
| C | 13 | 61 | 6100 | 29.14 | 785 | 790 | 182.2 |
| C | 7 | 159 | 3904 | 17.09 | 785 | 790 | 182.2 |
| D | 13 | 169 | 242990 | 1259.89 | 785 | 759 | 192.3 |
| D | 12 | 221 | 162420 | 840.83 | 785 | 759 | 192.3 |
| D | 8 | 195 | 74148 | 381.71 | 785 | 759 | 192.3 |
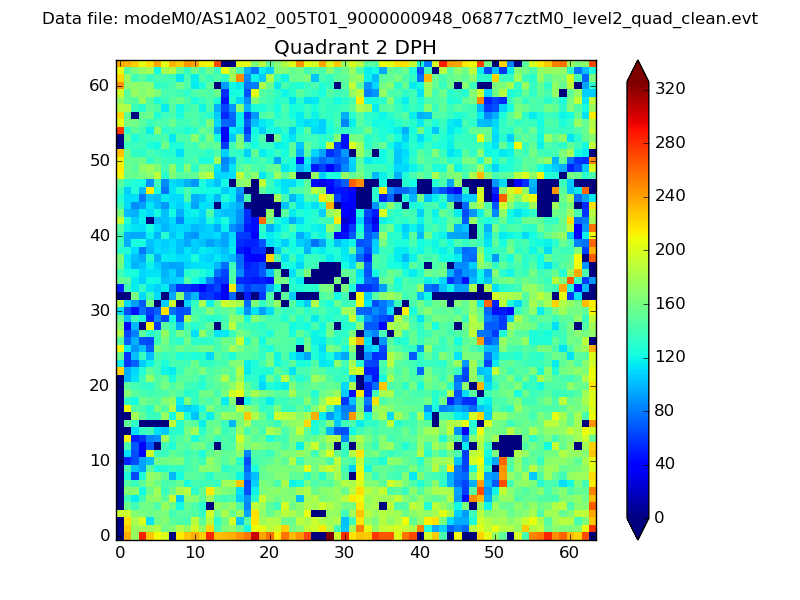
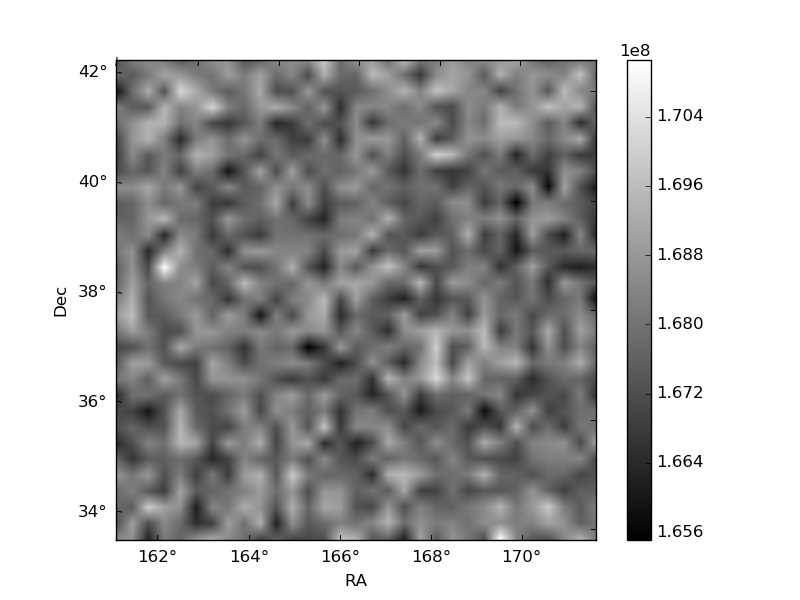
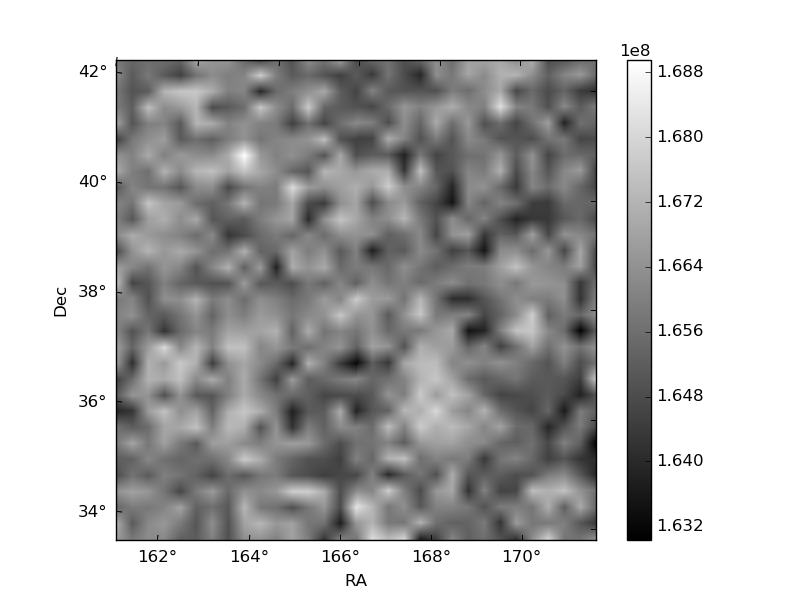
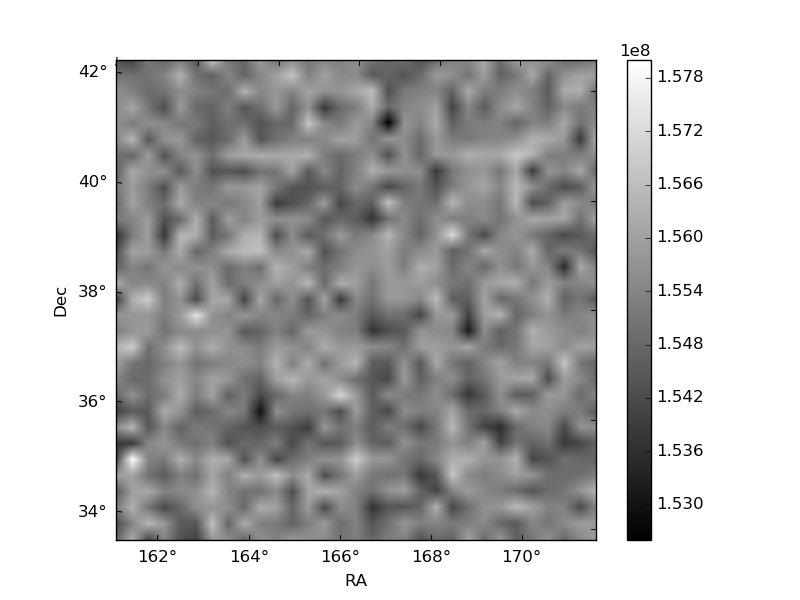
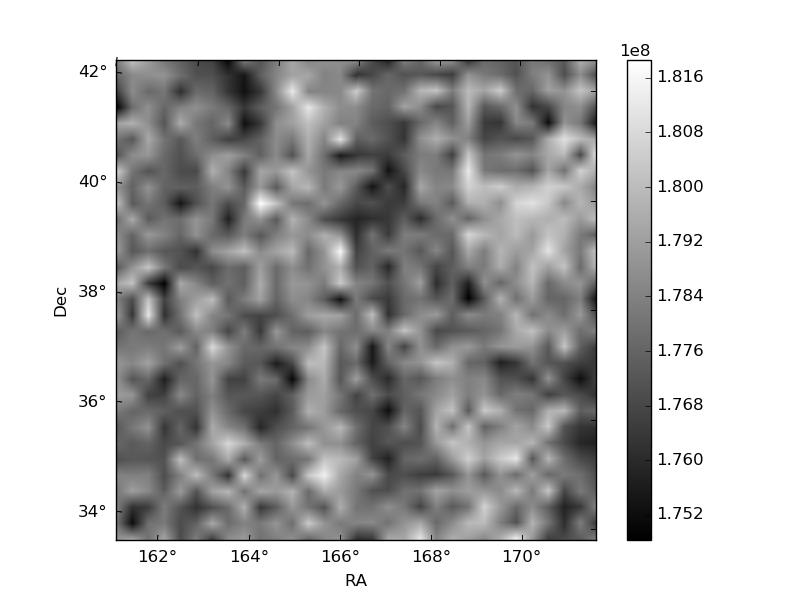
Histogram calculated using DETX and DETY for each event in the final _common_clean file
| Quadrant A | 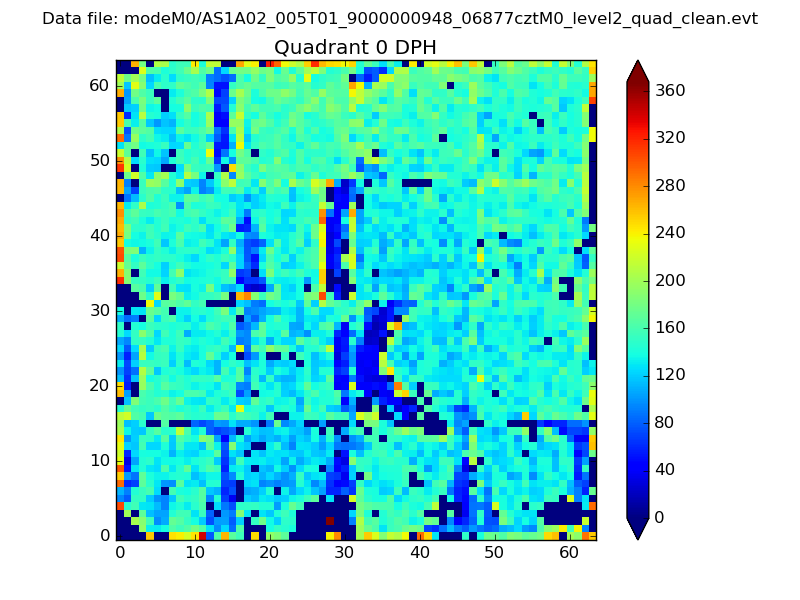 |
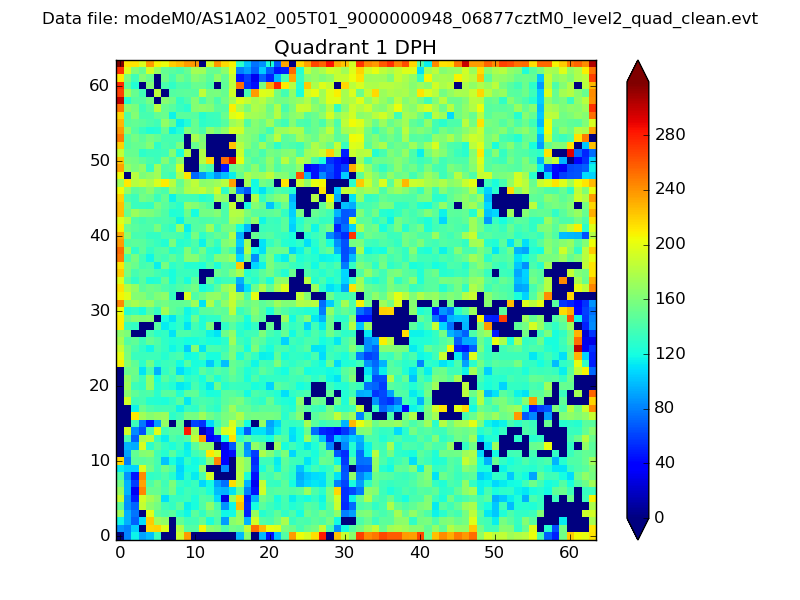 |
Quadrant B |
|---|---|---|---|
| Quadrant D | 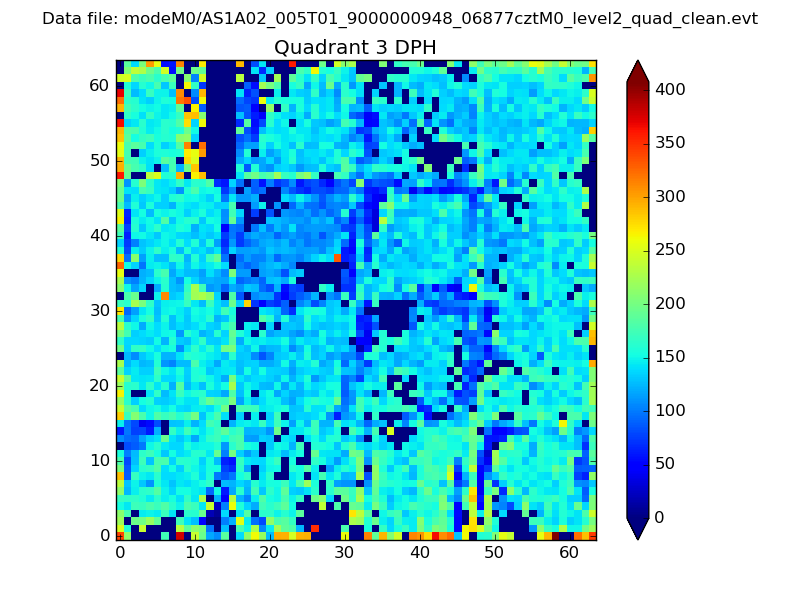 |
 |
Quadrant C |
| Plot type | Count rate plots | Images |
|---|---|---|
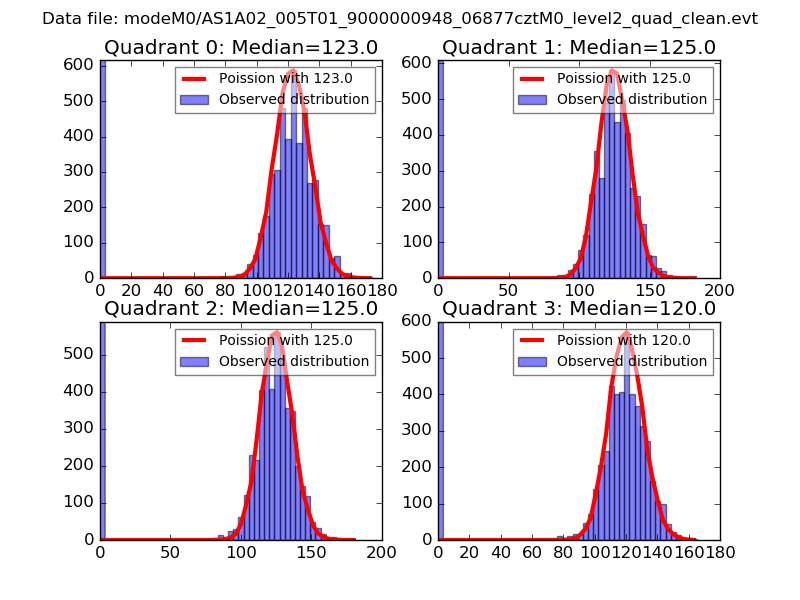
| Comparison with Poisson distribution Blue bars denote a histogram of data divided into 1 sec bins. Red curve is a Poisson curve with rate = median count rate of data. |
 |
 |
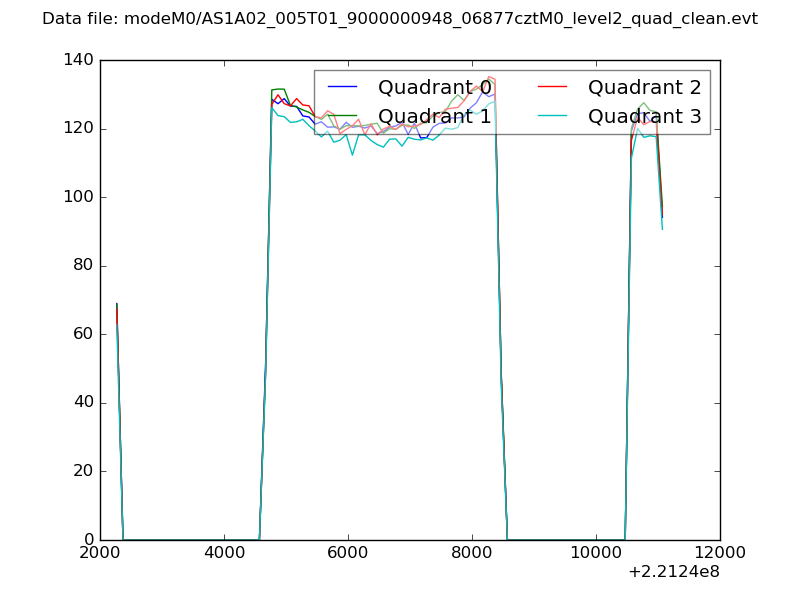
| Quadrant-wise count rates Data is divided into 100 sec bins |
 |
|
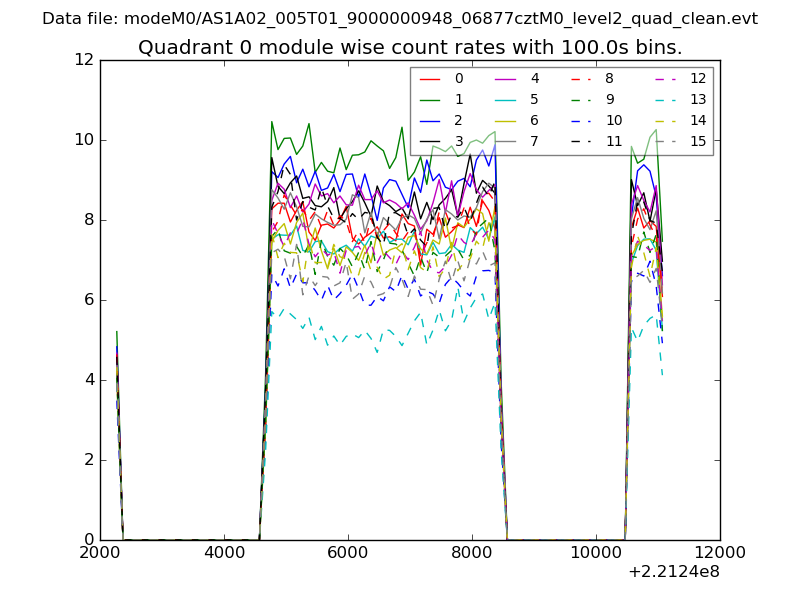
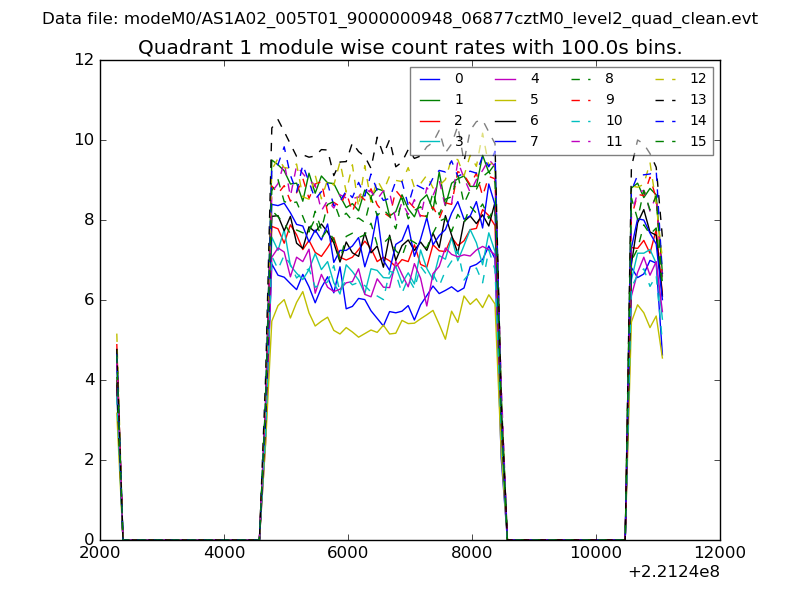
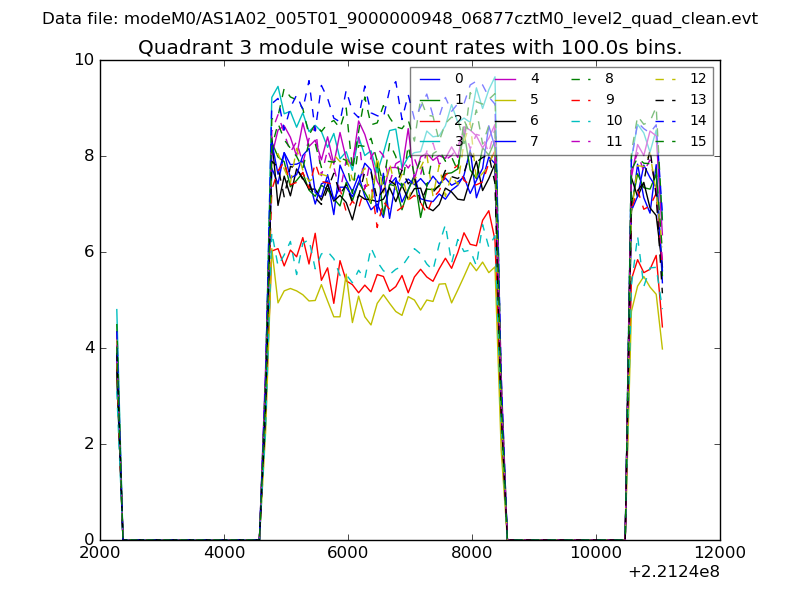
| Module-wise count rates for Quadrant A Data is divided into 100 sec bins |
 |
 |
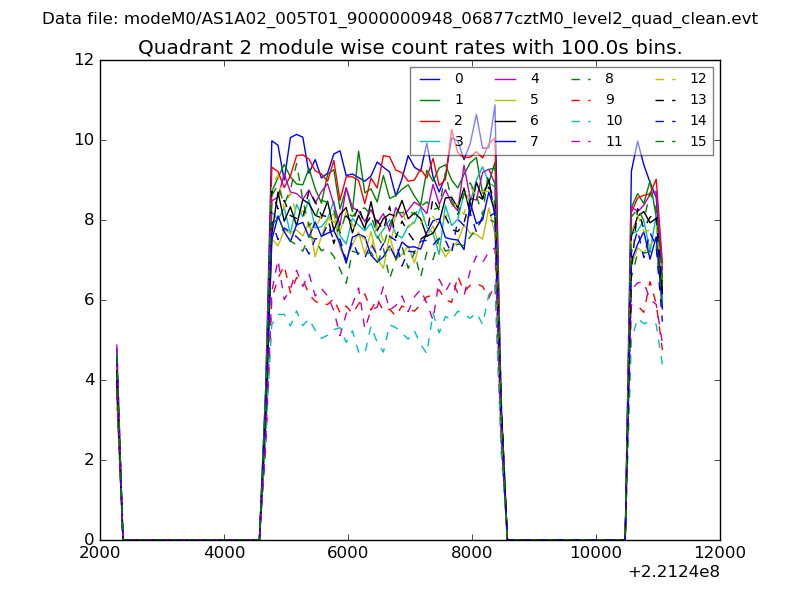
| Module-wise count rates for Quadrant B Data is divided into 100 sec bins |
 |
 |
| Module-wise count rates for Quadrant C Data is divided into 100 sec bins |
 |
 |
| Module-wise count rates for Quadrant D Data is divided into 100 sec bins |
 |
 |
| Parameter | Plot |
|---|---|
| CZT HV Monitor | 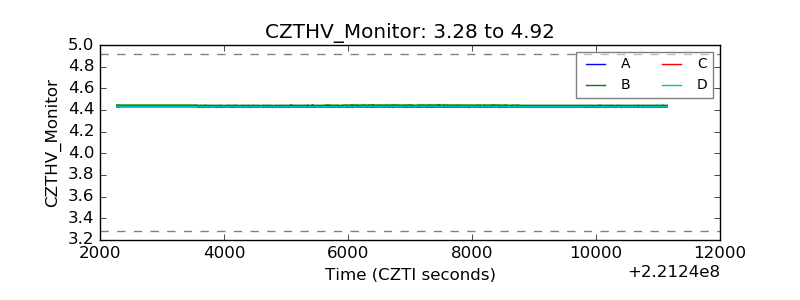 |
| D_VDD | 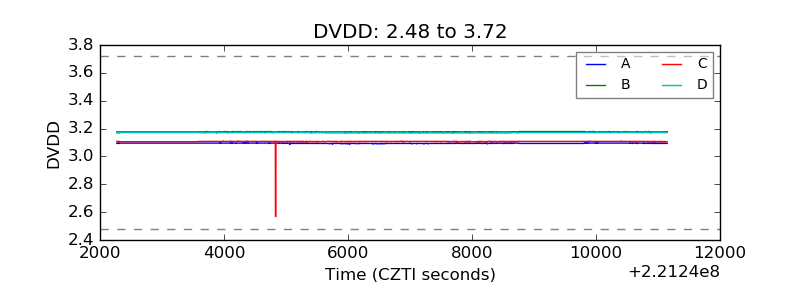 |
| Temperature 1 | 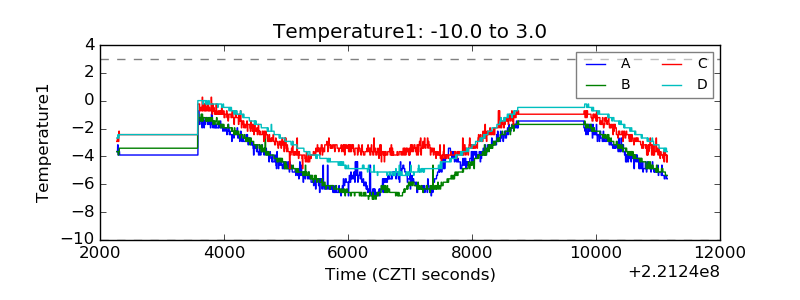 |
| Veto HV Monitor | 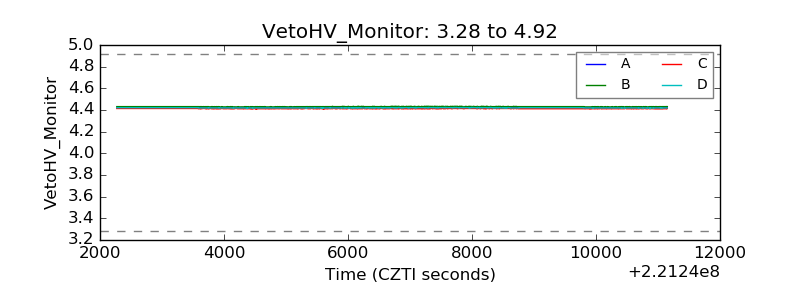 |
| Veto LLD | 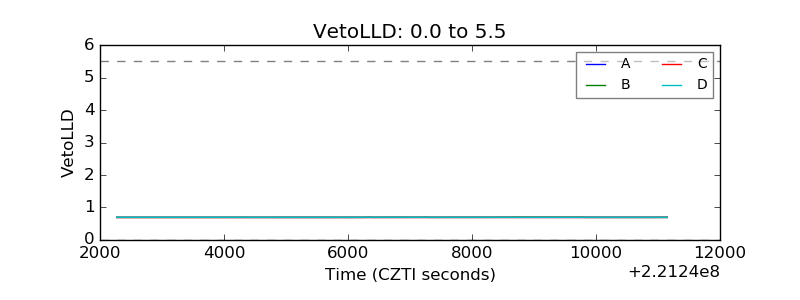 |
| Alpha Counter | 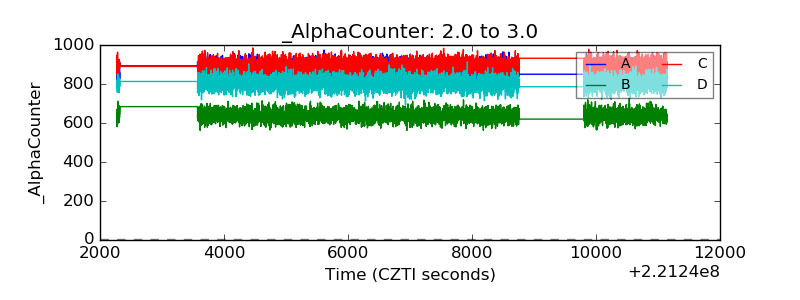 |
| _CPM_Rate | 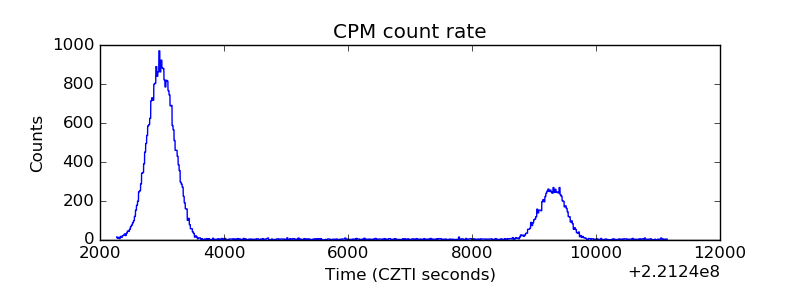 |
| CZT Counter | 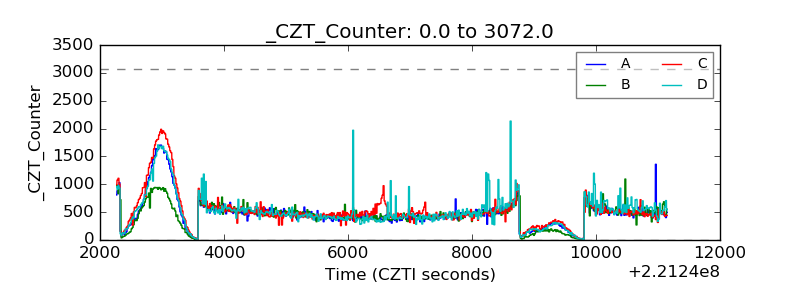 |
| +2.5 Volts monitor | 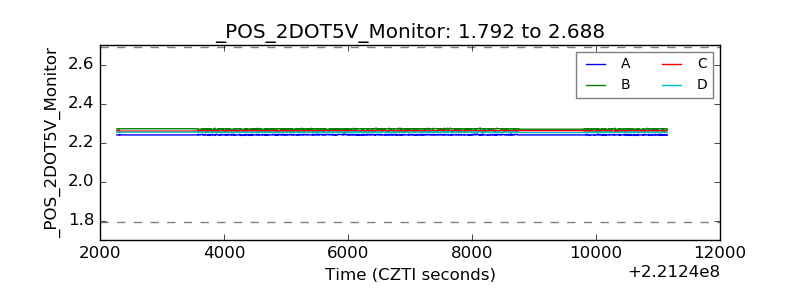 |
| +5 Volts monitor | 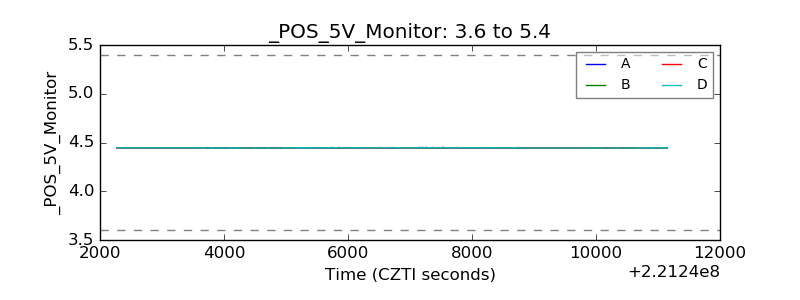 |
| _ROLL_ROT | 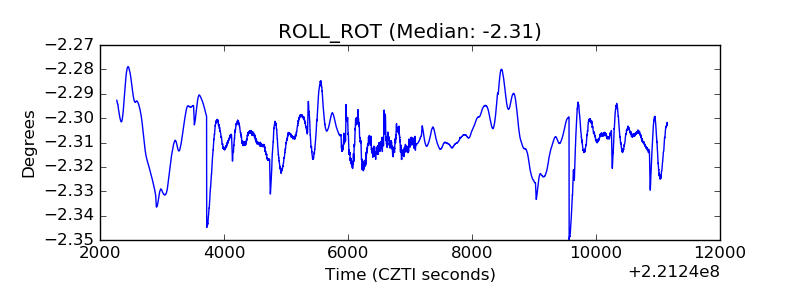 |
| _Roll_DEC | 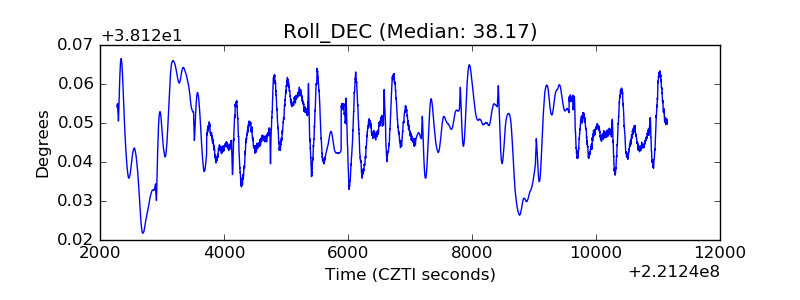 |
| _Roll_RA | 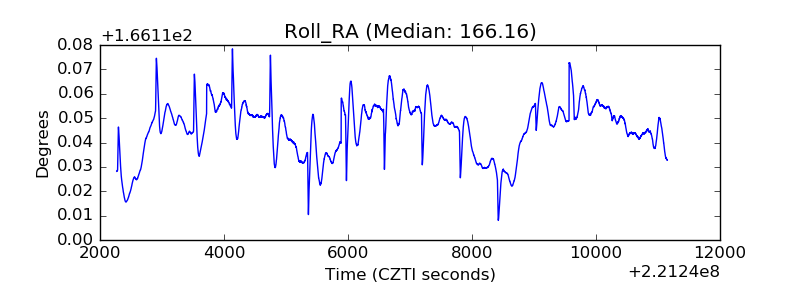 |
| Veto Counter | 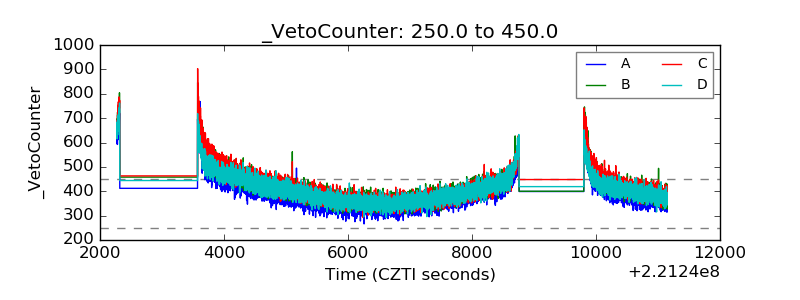 |