| Param | Original file | Final file |
|---|---|---|
| Filename | modeM0/AS1A02_005T01_9000000948_06878cztM0_level2.evt | modeM0/AS1A02_005T01_9000000948_06878cztM0_level2_quad_clean.evt |
| Size (bytes) | 467,150,400 | 90,567,360 |
| Size | 445.5 MB | 86.4 MB |
| Events in quadrant A | 3,247,768 | 565,759 |
| Events in quadrant B | 3,374,829 | 572,703 |
| Events in quadrant C | 3,389,874 | 567,939 |
| Events in quadrant D | 3,659,224 | 548,392 |
| Mode SS | |||
|---|---|---|---|
| Quadrant | BADHDUFLAG | Total packets | Discarded packets |
| A | 0 | 144 | 0 |
| B | 0 | 144 | 0 |
| C | 0 | 144 | 0 |
| D | 0 | 144 | 0 |
| Mode M0 | |||
|---|---|---|---|
| Quadrant | BADHDUFLAG | Total packets | Discarded packets |
| A | 0 | 14510 | 3 |
| B | 0 | 14773 | 2 |
| C | 0 | 14665 | 2 |
| D | 0 | 15633 | 2 |
| Mode M9 | |||
|---|---|---|---|
| Quadrant | BADHDUFLAG | Total packets | Discarded packets |
| A | 0 | 17 | 0 |
| B | 0 | 17 | 0 |
| C | 0 | 17 | 0 |
| D | 0 | 17 | 0 |
| Quadrant | Total seconds | Saturated seconds | Saturation percentage |
|---|---|---|---|
| A | 7005 | 50 | 0.713776% |
| B | 7005 | 80 | 1.142041% |
| C | 7005 | 101 | 1.441827% |
| D | 7005 | 79 | 1.127766% |
Noise dominated data is calculated using 1-second bins in cleaned event files. If a bin has >2000 counts, and if more than 50% of those come from <1% of pixels, then it is considered to be noise-dominated and hence unusable.
| Quadrant | # 1 sec bins | Bins with >0 counts | Bins with >2000 counts | High rate bins dominated by noise | Noise dominated (total time) | Noise dominated (detector-on time) | Marked lightcurve |
|---|---|---|---|---|---|---|---|
| A | 8690 | 7008 | 1 | 1 | 0.01% | 0.01% | 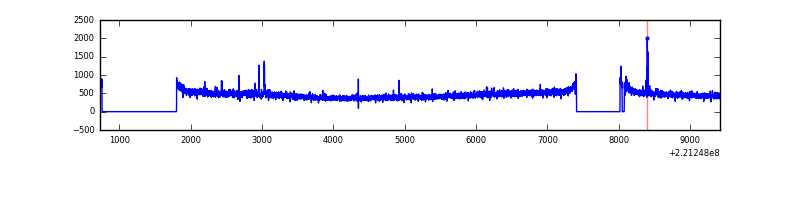 |
| B | 8690 | 7008 | 1 | 1 | 0.01% | 0.01% |  |
| C | 8690 | 7008 | 4 | 4 | 0.05% | 0.06% | 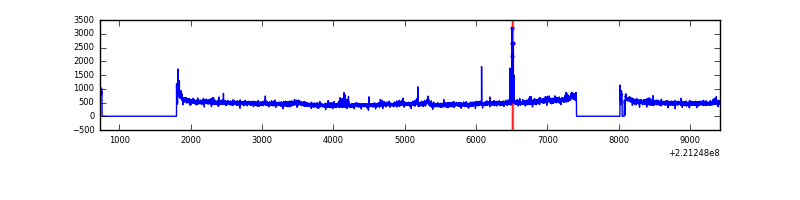 |
| D | 8690 | 7008 | 15 | 15 | 0.17% | 0.21% | 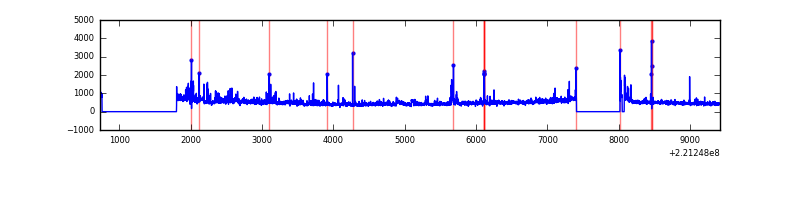 |
Top three noisy pixels from each quadrant. If the there are fewer than three noisy pixels in the level2.evt file, extra rows are filled as -1
| Pixel properties | Quadrant properties | ||||||
|---|---|---|---|---|---|---|---|
| Quadrant | DetID | PixID | Counts | Sigma | Mean | Median | Sigma |
| A | 15 | 223 | 34311 | 197.85 | 827 | 809 | 169.3 |
| A | 13 | 251 | 14617 | 81.55 | 827 | 809 | 169.3 |
| A | 14 | 111 | 9194 | 49.52 | 827 | 809 | 169.3 |
| B | 0 | 214 | 57764 | 352.73 | 836 | 815 | 161.5 |
| B | 15 | 204 | 38145 | 231.22 | 836 | 815 | 161.5 |
| B | 4 | 80 | 16248 | 95.59 | 836 | 815 | 161.5 |
| C | 9 | 247 | 205821 | 1096.01 | 804 | 808 | 187.1 |
| C | 1 | 3 | 26891 | 139.44 | 804 | 808 | 187.1 |
| C | 12 | 4 | 12588 | 62.98 | 804 | 808 | 187.1 |
| D | 12 | 221 | 273711 | 1358.25 | 808 | 781 | 200.9 |
| D | 13 | 169 | 130189 | 644.01 | 808 | 781 | 200.9 |
| D | 8 | 195 | 87963 | 433.87 | 808 | 781 | 200.9 |
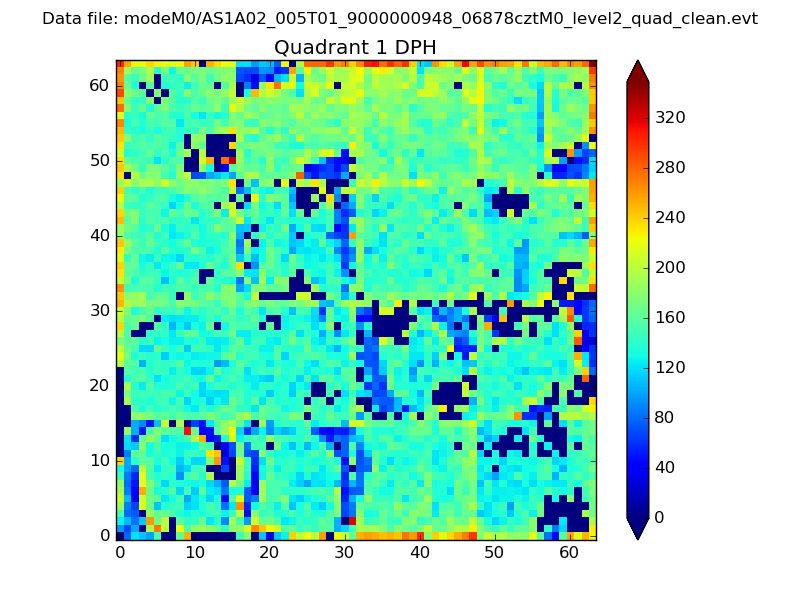
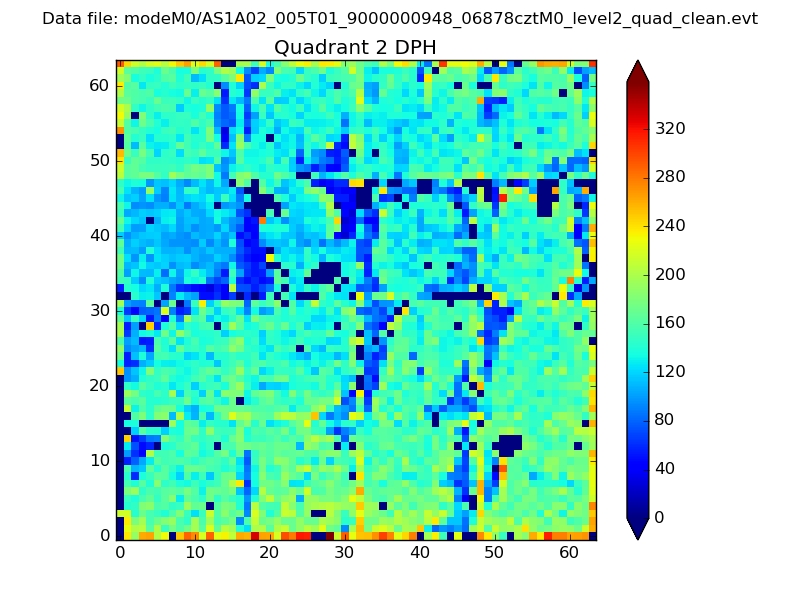
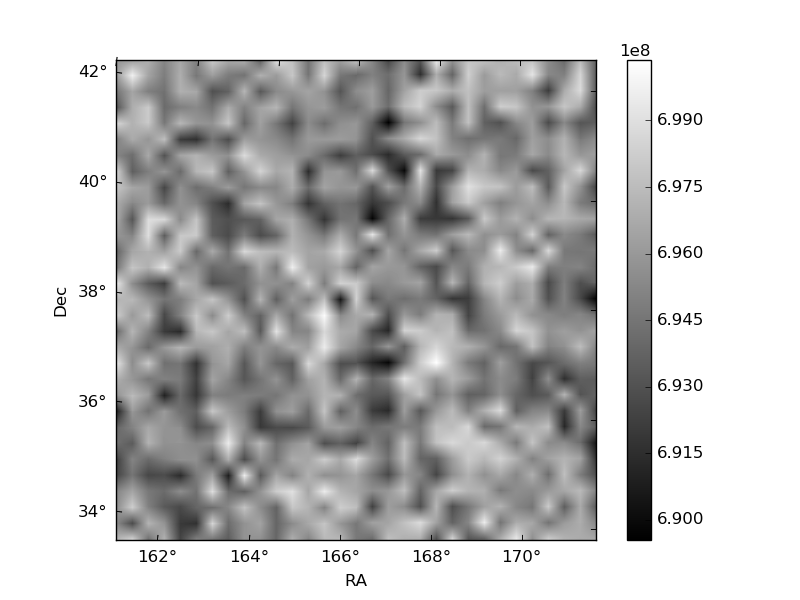
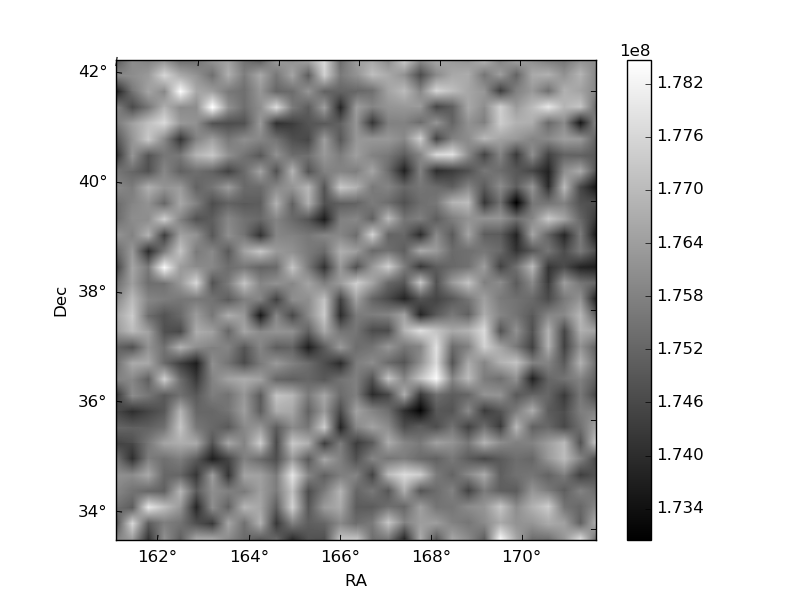
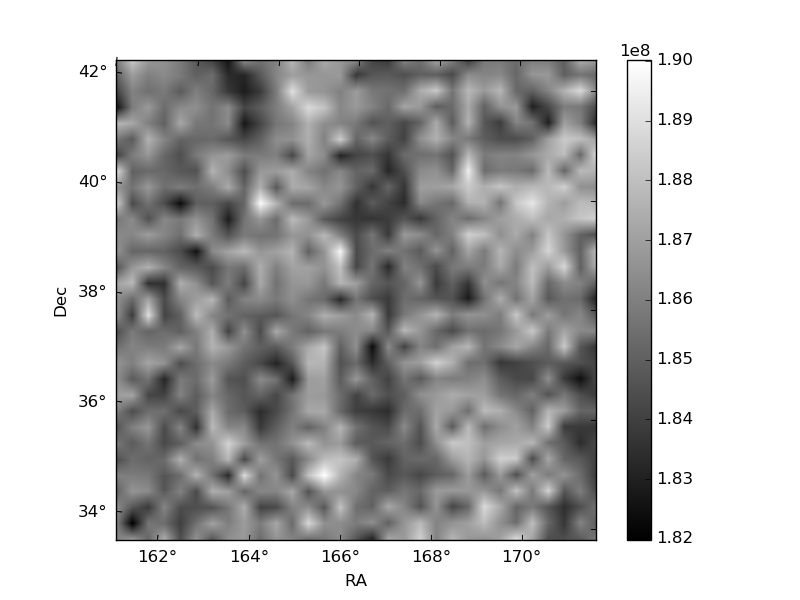
Histogram calculated using DETX and DETY for each event in the final _common_clean file
| Quadrant A | 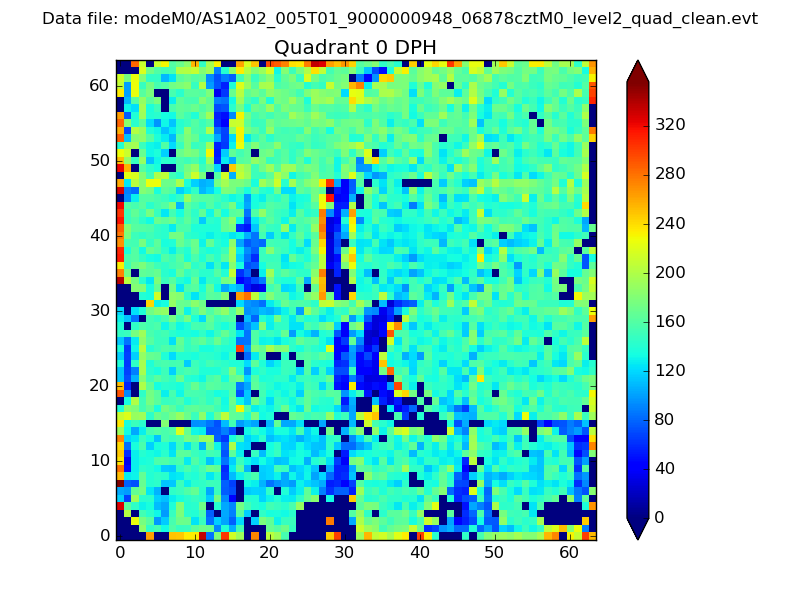 |
 |
Quadrant B |
|---|---|---|---|
| Quadrant D | 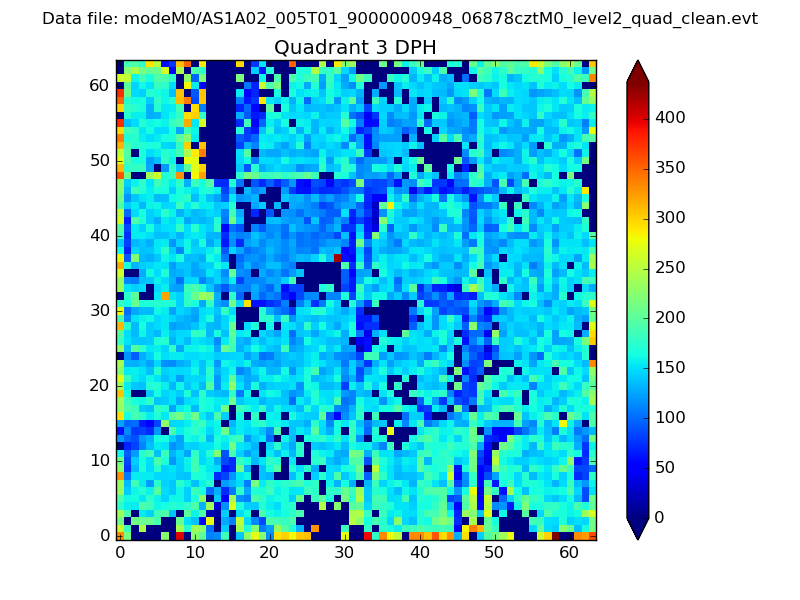 |
 |
Quadrant C |
| Plot type | Count rate plots | Images |
|---|---|---|
| Comparison with Poisson distribution Blue bars denote a histogram of data divided into 1 sec bins. Red curve is a Poisson curve with rate = median count rate of data. |
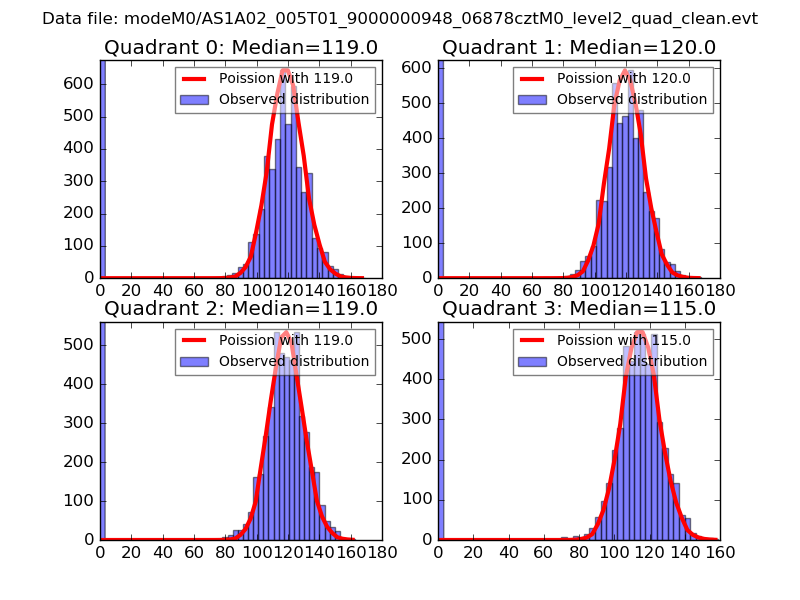 |
 |
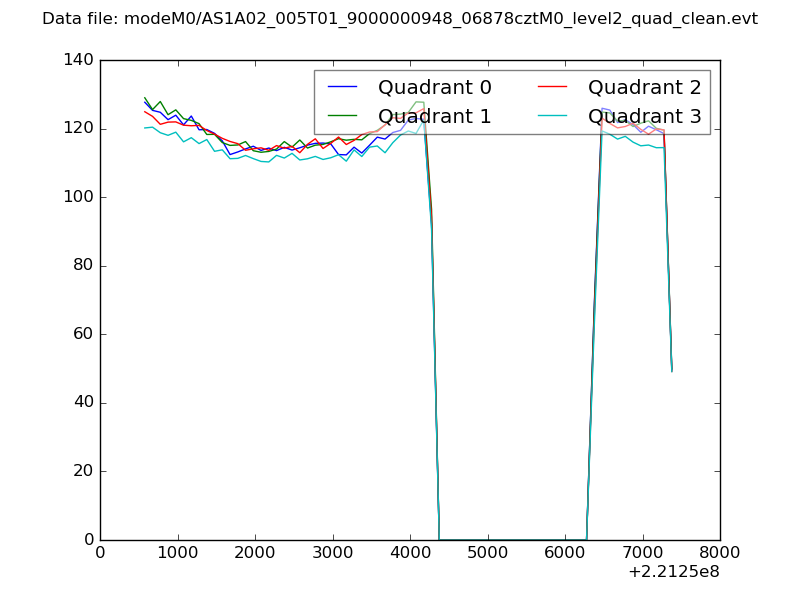
| Quadrant-wise count rates Data is divided into 100 sec bins |
 |
|
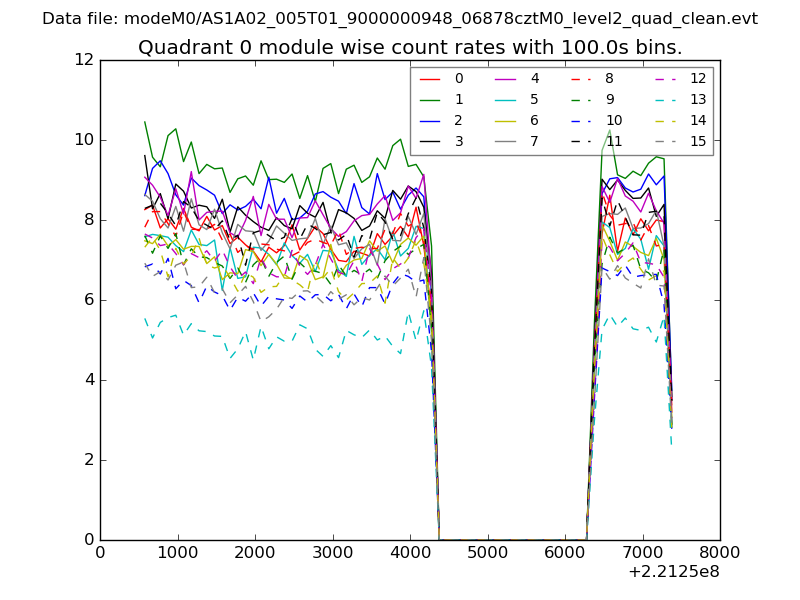
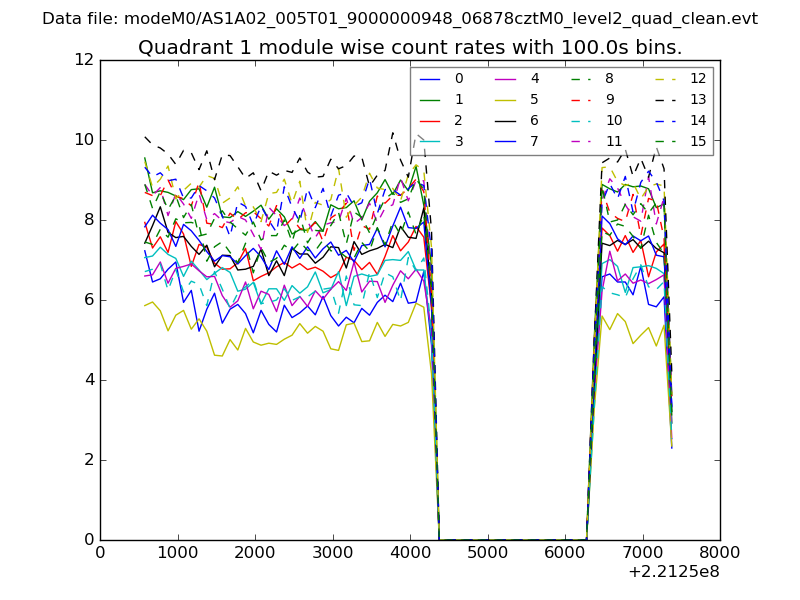
| Module-wise count rates for Quadrant A Data is divided into 100 sec bins |
 |
 |
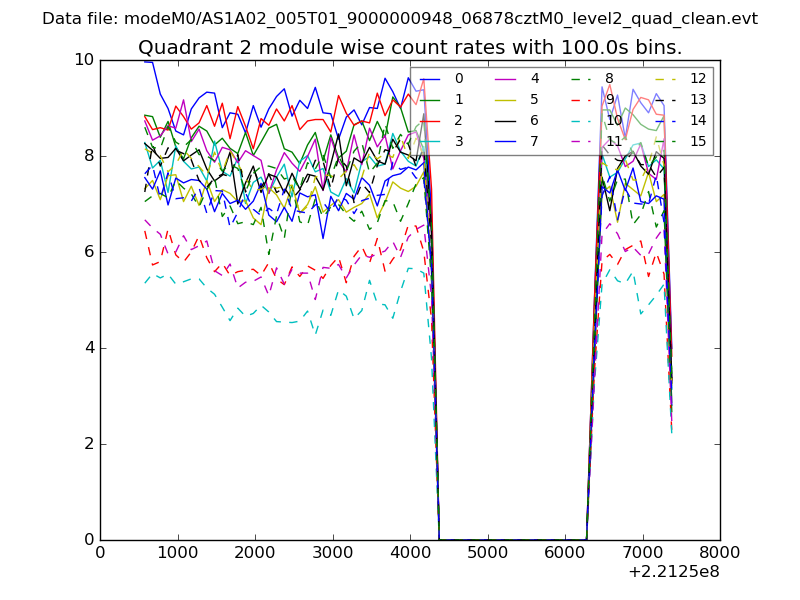
| Module-wise count rates for Quadrant B Data is divided into 100 sec bins |
 |
 |
| Module-wise count rates for Quadrant C Data is divided into 100 sec bins |
 |
 |
| Module-wise count rates for Quadrant D Data is divided into 100 sec bins |
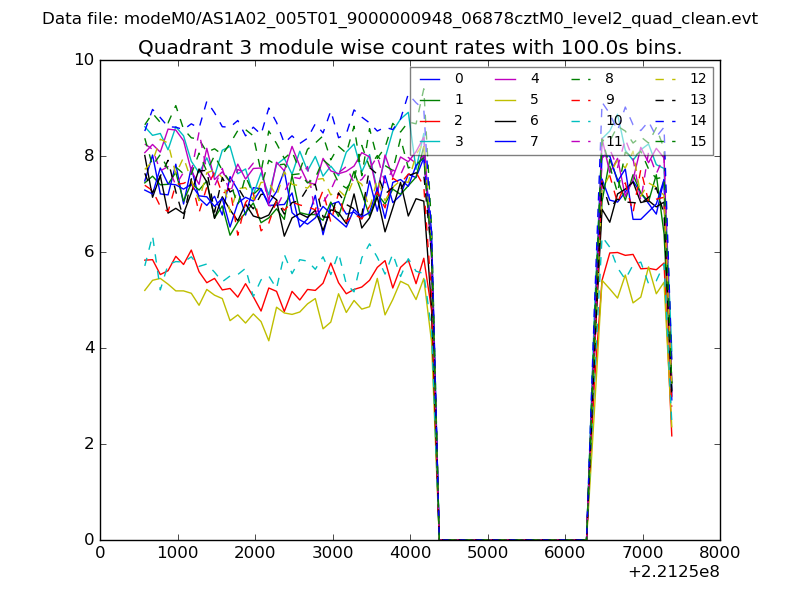 |
 |
| Parameter | Plot |
|---|---|
| CZT HV Monitor | 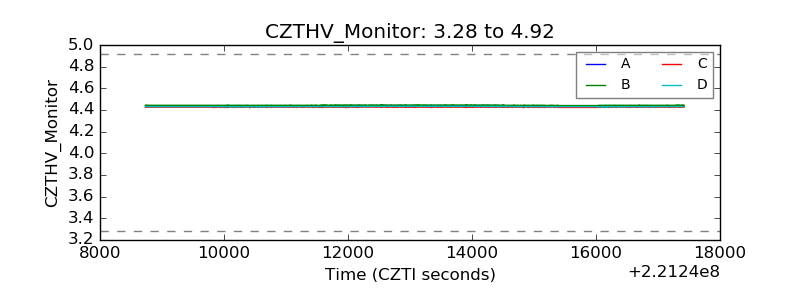 |
| D_VDD | 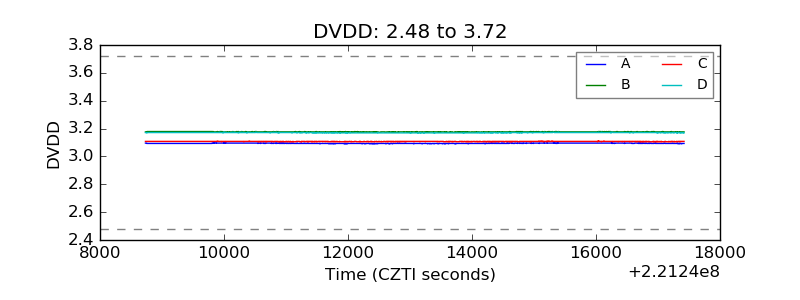 |
| Temperature 1 | 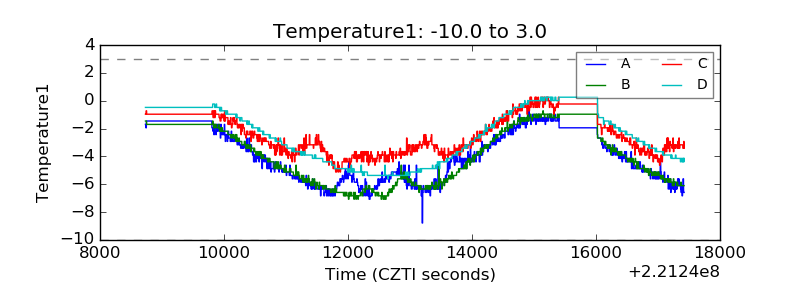 |
| Veto HV Monitor | 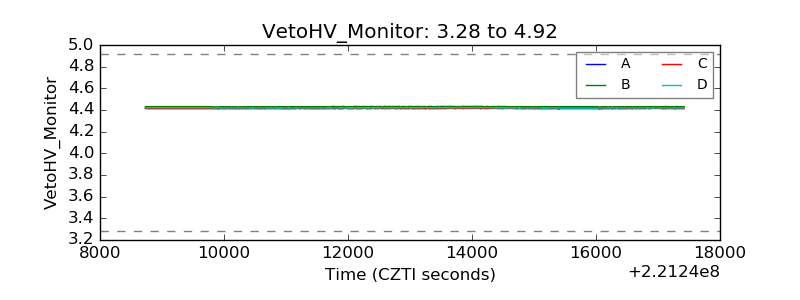 |
| Veto LLD | 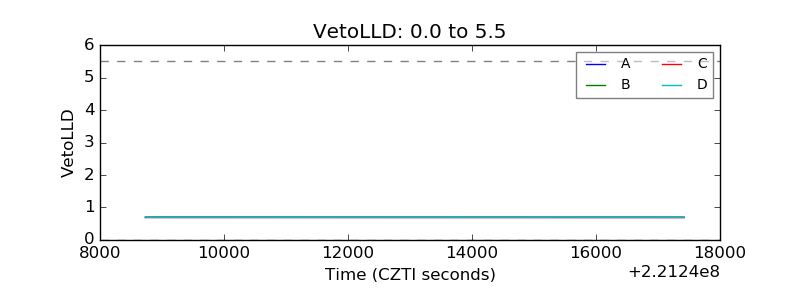 |
| Alpha Counter | 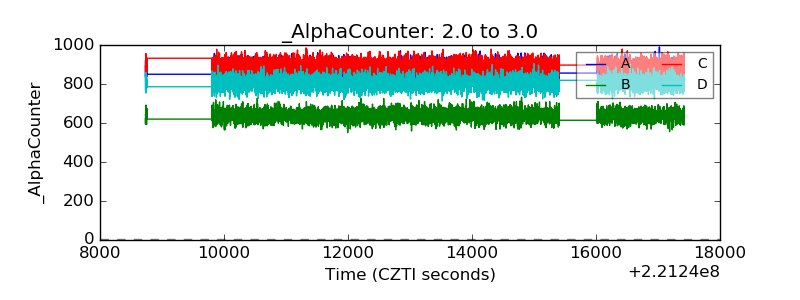 |
| _CPM_Rate | 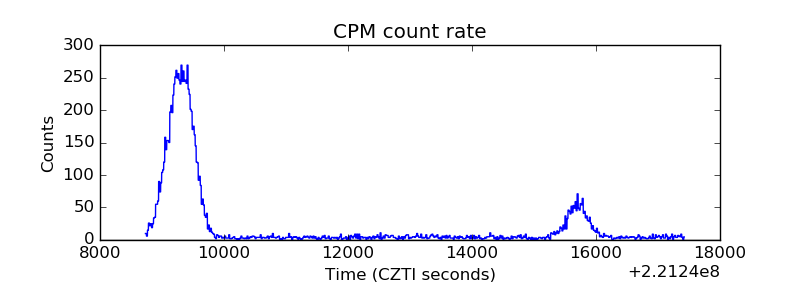 |
| CZT Counter | 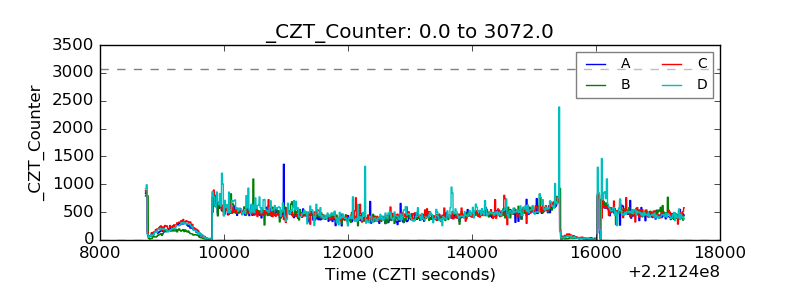 |
| +2.5 Volts monitor | 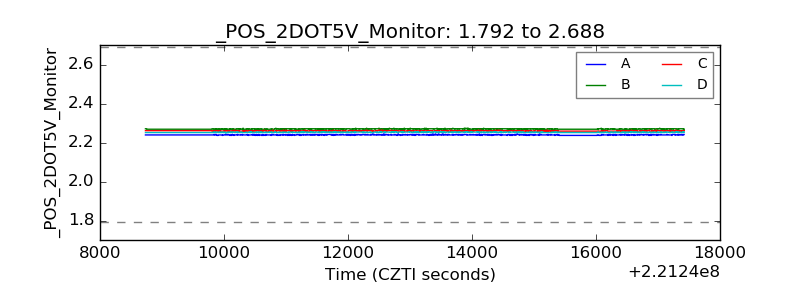 |
| +5 Volts monitor |  |
| _ROLL_ROT | 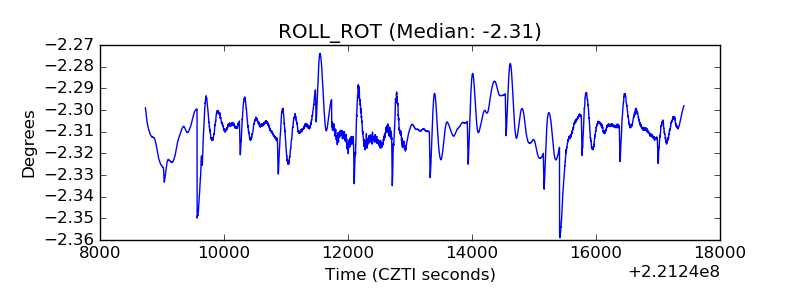 |
| _Roll_DEC | 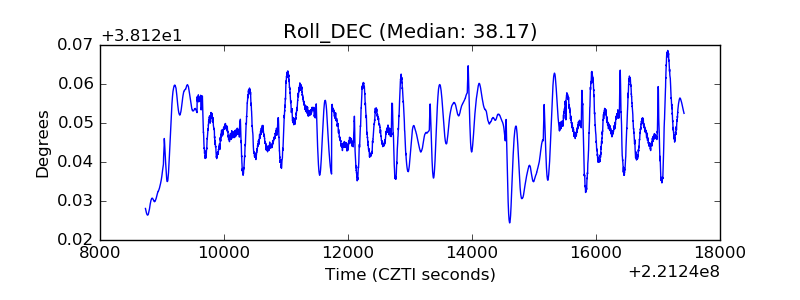 |
| _Roll_RA | 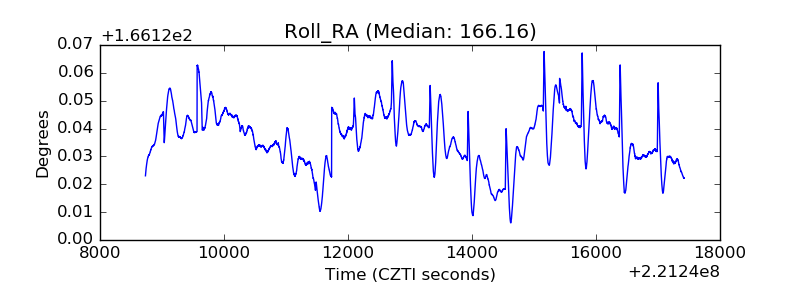 |
| Veto Counter | 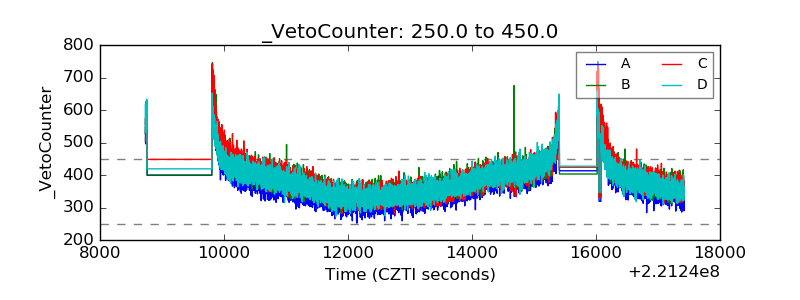 |