| Param | Original file | Final file |
|---|---|---|
| Filename | modeM0/AS1A02_005T01_9000000948_06885cztM0_level2.evt | modeM0/AS1A02_005T01_9000000948_06885cztM0_level2_quad_clean.evt |
| Size (bytes) | 387,339,840 | 73,609,920 |
| Size | 369.4 MB | 70.2 MB |
| Events in quadrant A | 2,746,499 | 459,717 |
| Events in quadrant B | 2,805,477 | 459,945 |
| Events in quadrant C | 3,040,862 | 451,455 |
| Events in quadrant D | 2,735,534 | 445,022 |
| Mode SS | |||
|---|---|---|---|
| Quadrant | BADHDUFLAG | Total packets | Discarded packets |
| A | 0 | 120 | 0 |
| B | 0 | 120 | 0 |
| C | 0 | 120 | 0 |
| D | 0 | 120 | 0 |
| Mode M0 | |||
|---|---|---|---|
| Quadrant | BADHDUFLAG | Total packets | Discarded packets |
| A | 0 | 12073 | 2 |
| B | 0 | 12169 | 1 |
| C | 0 | 12935 | 1 |
| D | 0 | 12195 | 1 |
| Mode M9 | |||
|---|---|---|---|
| Quadrant | BADHDUFLAG | Total packets | Discarded packets |
| A | 0 | 11 | 0 |
| B | 0 | 11 | 0 |
| C | 0 | 11 | 0 |
| D | 0 | 11 | 0 |
| Quadrant | Total seconds | Saturated seconds | Saturation percentage |
|---|---|---|---|
| A | 5908 | 59 | 0.998646% |
| B | 5908 | 52 | 0.880162% |
| C | 5908 | 91 | 1.540284% |
| D | 5908 | 48 | 0.812458% |
Noise dominated data is calculated using 1-second bins in cleaned event files. If a bin has >2000 counts, and if more than 50% of those come from <1% of pixels, then it is considered to be noise-dominated and hence unusable.
| Quadrant | # 1 sec bins | Bins with >0 counts | Bins with >2000 counts | High rate bins dominated by noise | Noise dominated (total time) | Noise dominated (detector-on time) | Marked lightcurve |
|---|---|---|---|---|---|---|---|
| A | 6973 | 5909 | 0 | 0 | 0.00% | 0.00% | 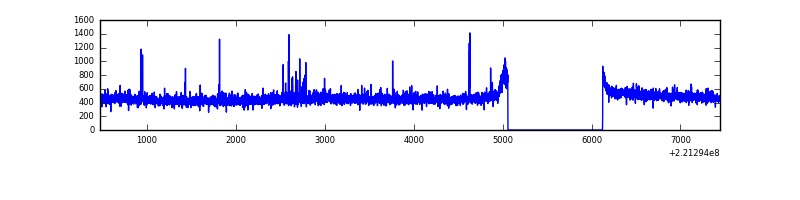 |
| B | 6973 | 5909 | 0 | 0 | 0.00% | 0.00% | 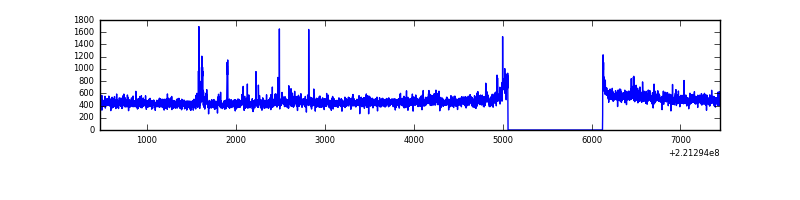 |
| C | 6973 | 5909 | 38 | 38 | 0.54% | 0.64% | 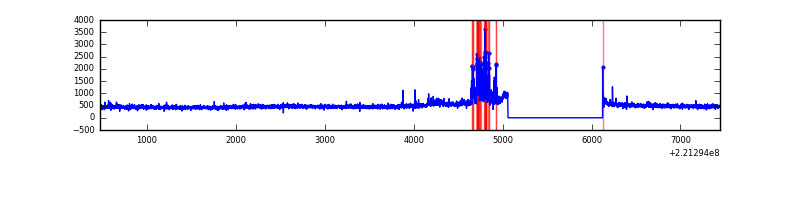 |
| D | 6973 | 5909 | 5 | 5 | 0.07% | 0.08% | 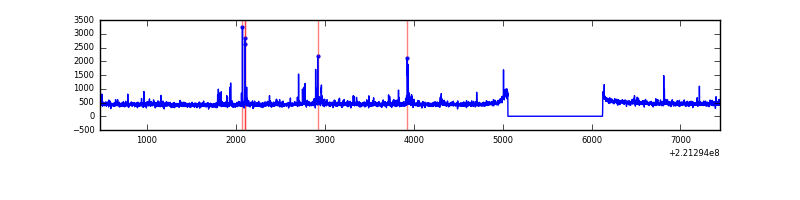 |
Top three noisy pixels from each quadrant. If the there are fewer than three noisy pixels in the level2.evt file, extra rows are filled as -1
| Pixel properties | Quadrant properties | ||||||
|---|---|---|---|---|---|---|---|
| Quadrant | DetID | PixID | Counts | Sigma | Mean | Median | Sigma |
| A | 8 | 15 | 37902 | 260.79 | 701 | 687 | 142.7 |
| A | 0 | 226 | 6738 | 42.4 | 701 | 687 | 142.7 |
| A | 12 | 194 | 6620 | 41.57 | 701 | 687 | 142.7 |
| B | 4 | 48 | 29191 | 211.59 | 698 | 680 | 134.7 |
| B | 4 | 81 | 21118 | 151.68 | 698 | 680 | 134.7 |
| B | 0 | 219 | 20198 | 144.85 | 698 | 680 | 134.7 |
| C | 9 | 247 | 416207 | 2666.82 | 670 | 674 | 155.8 |
| C | 13 | 61 | 5255 | 29.4 | 670 | 674 | 155.8 |
| C | 1 | 3 | 3385 | 17.4 | 670 | 674 | 155.8 |
| D | 8 | 195 | 58629 | 347.48 | 680 | 657 | 166.8 |
| D | 13 | 169 | 53270 | 315.36 | 680 | 657 | 166.8 |
| D | 2 | 152 | 16487 | 94.89 | 680 | 657 | 166.8 |
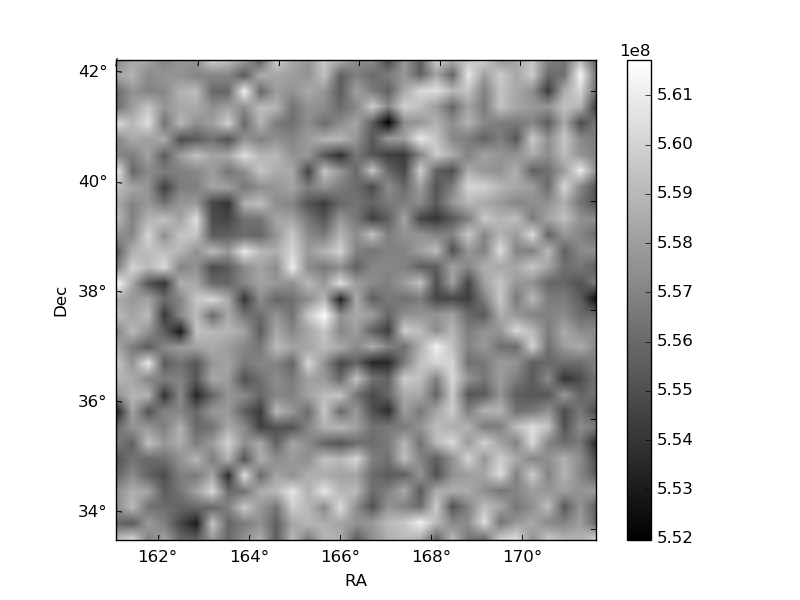
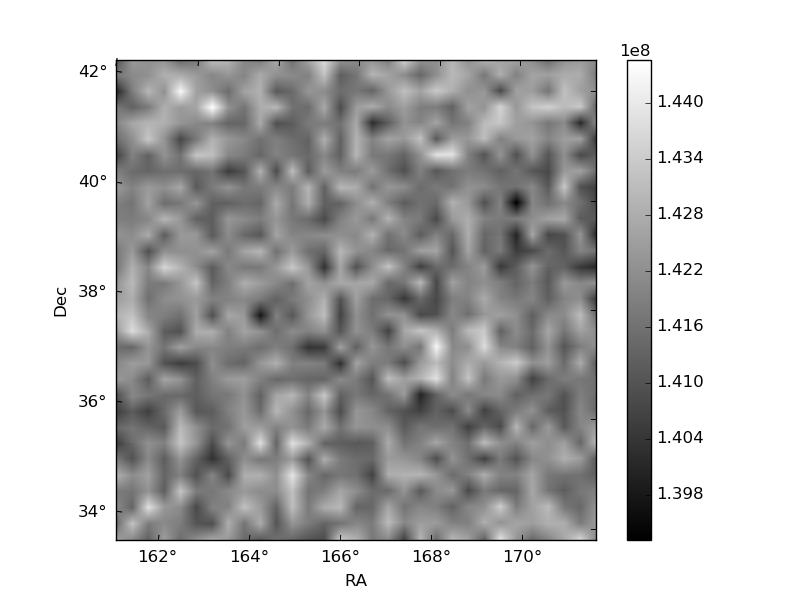
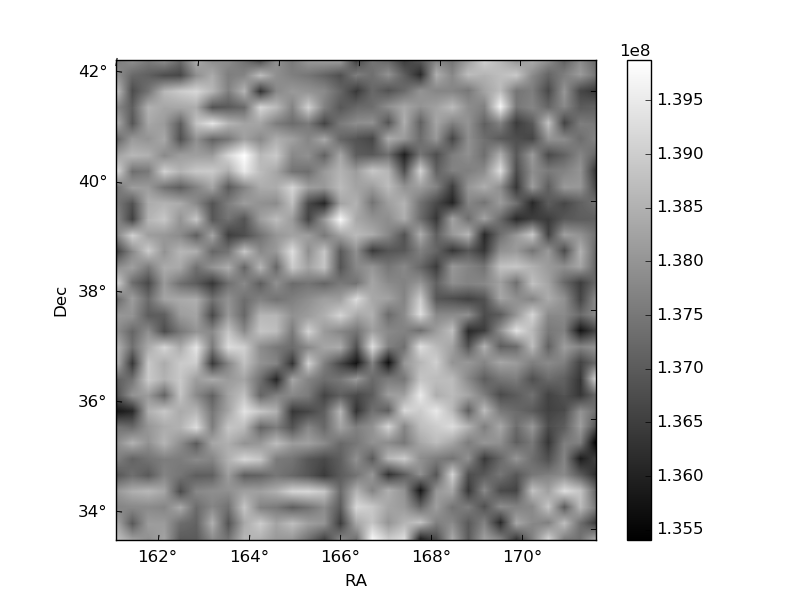
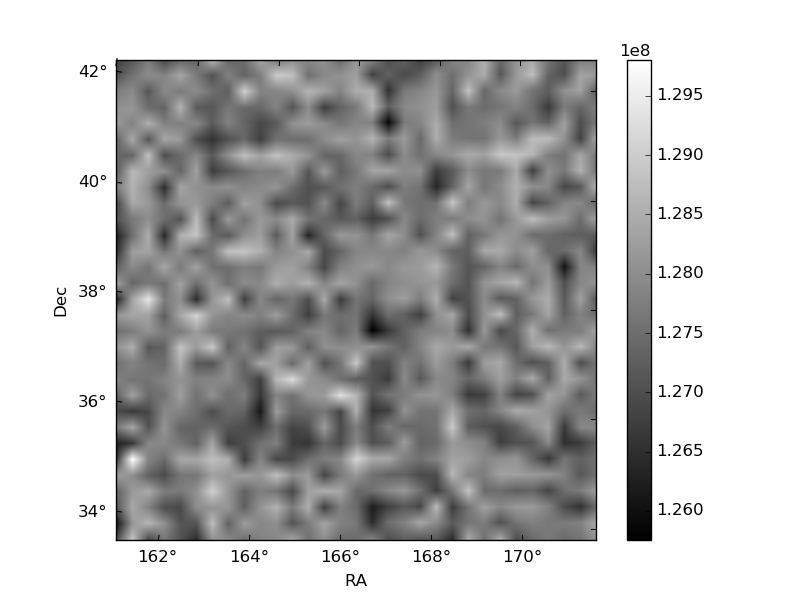
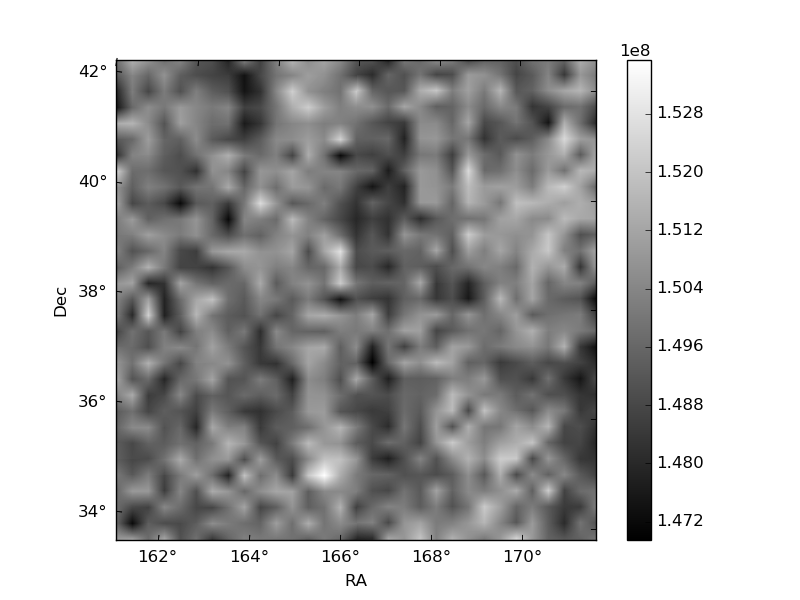
Histogram calculated using DETX and DETY for each event in the final _common_clean file
| Quadrant A | 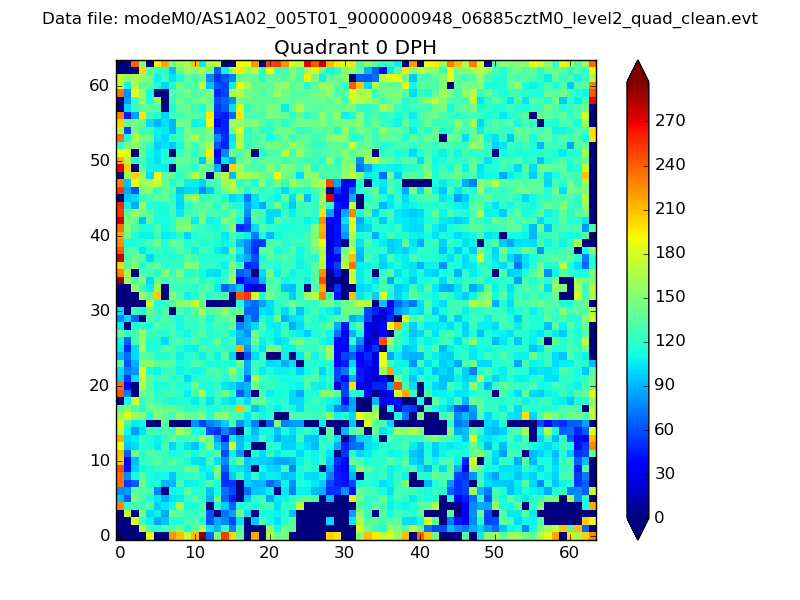 |
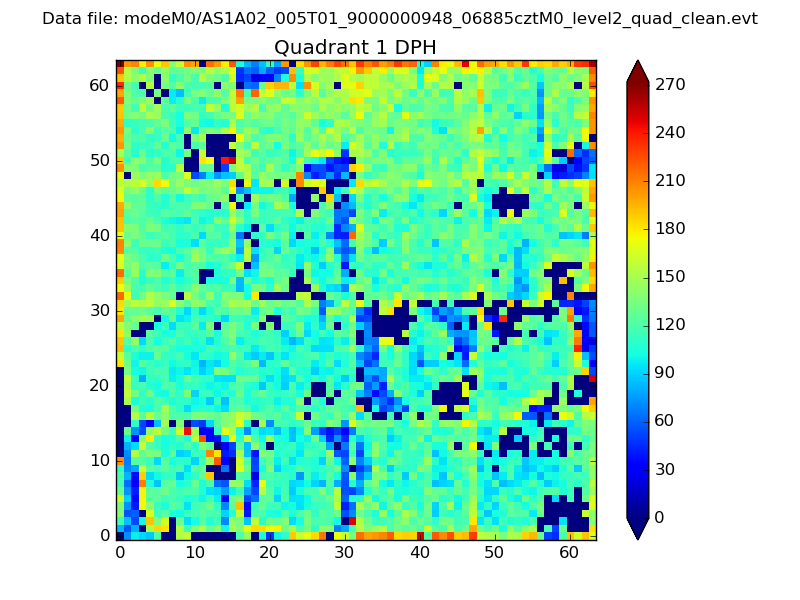 |
Quadrant B |
|---|---|---|---|
| Quadrant D | 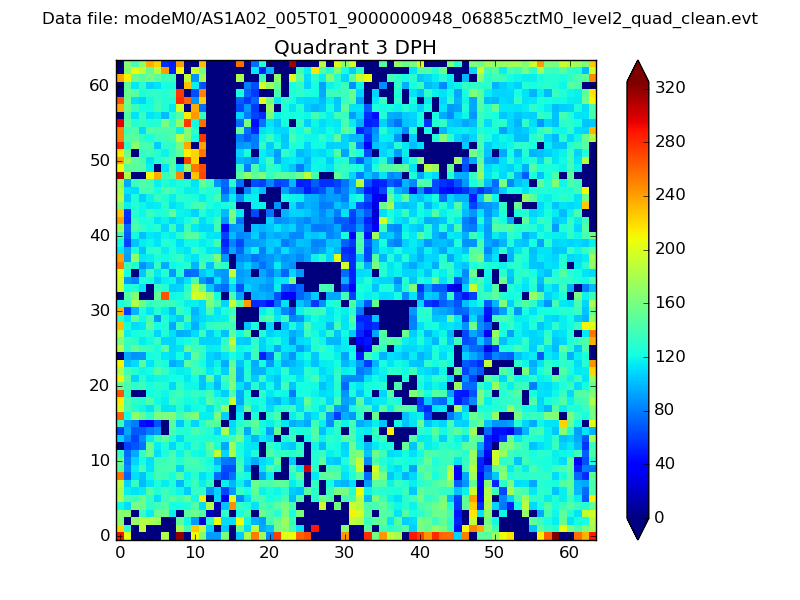 |
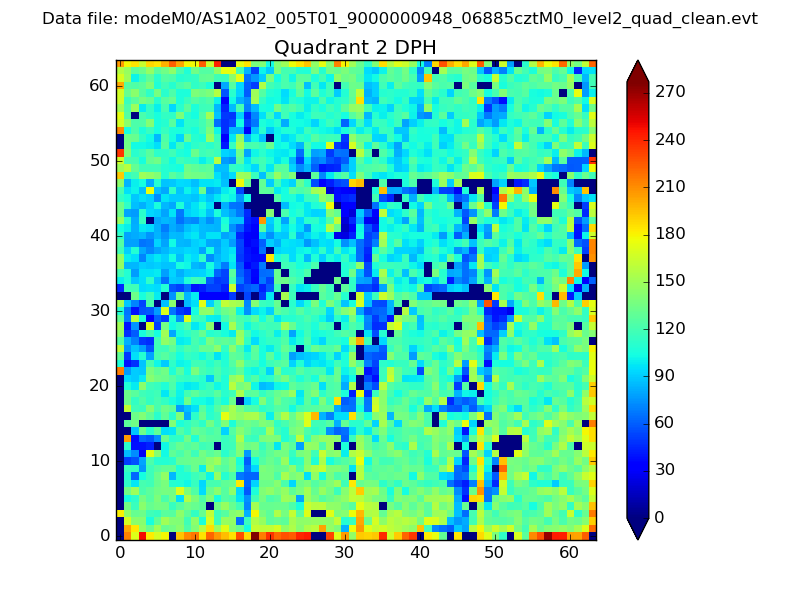 |
Quadrant C |
| Plot type | Count rate plots | Images |
|---|---|---|
| Comparison with Poisson distribution Blue bars denote a histogram of data divided into 1 sec bins. Red curve is a Poisson curve with rate = median count rate of data. |
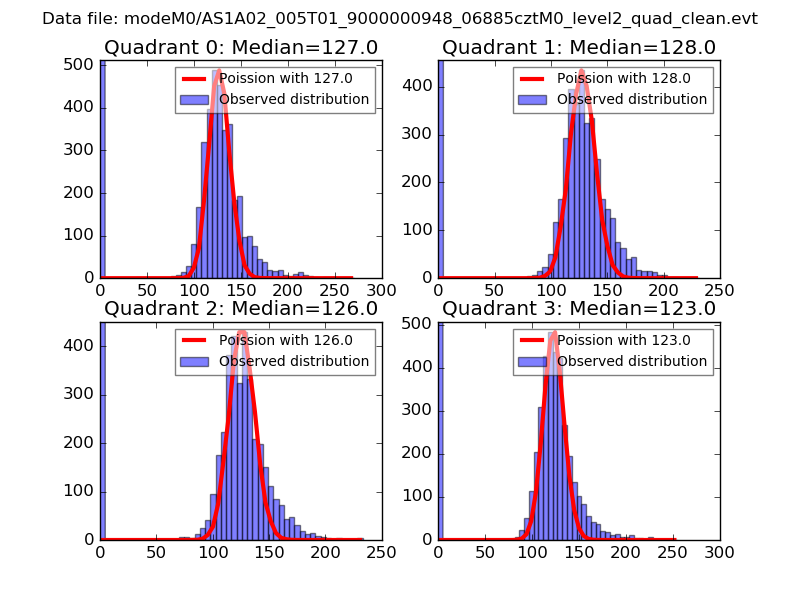 |
 |
| Quadrant-wise count rates Data is divided into 100 sec bins |
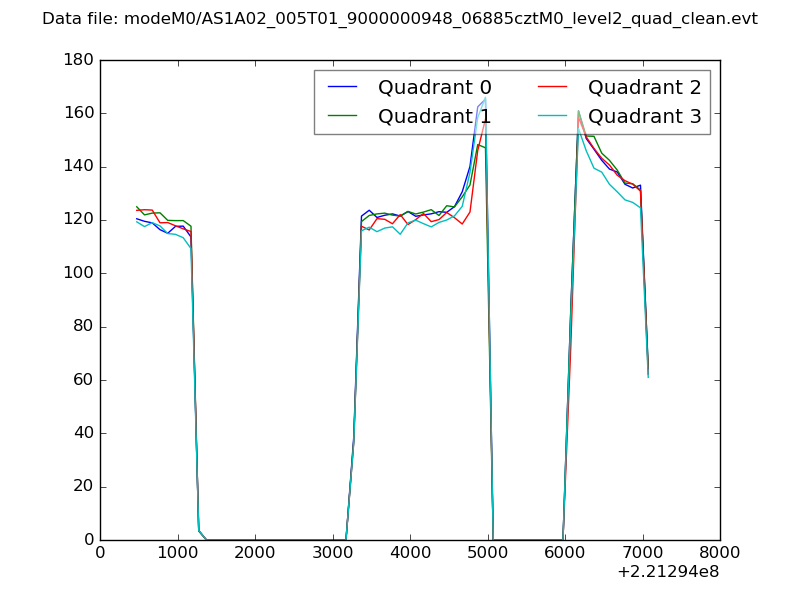 |
|
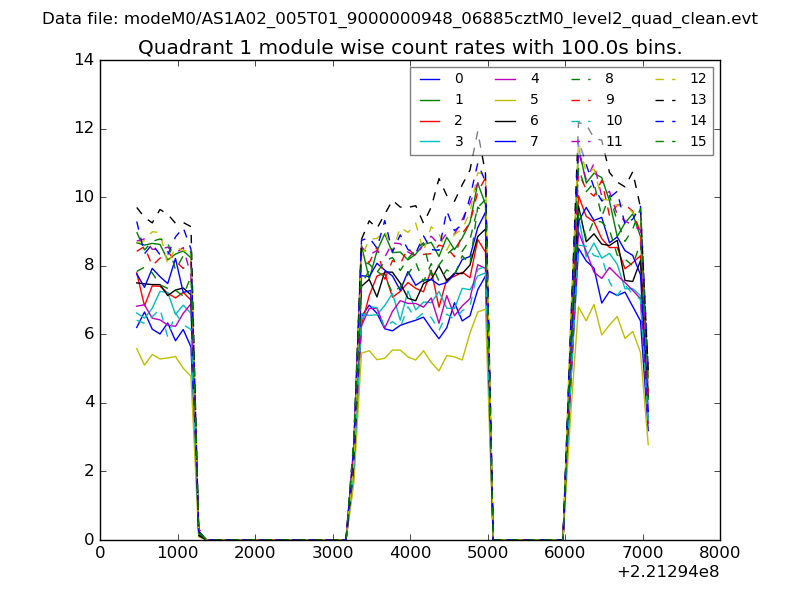
| Module-wise count rates for Quadrant A Data is divided into 100 sec bins |
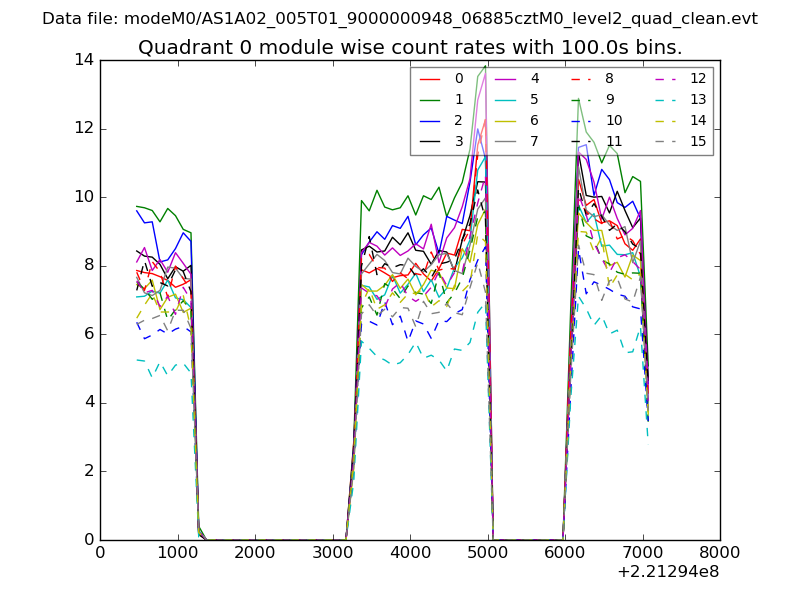 |
 |
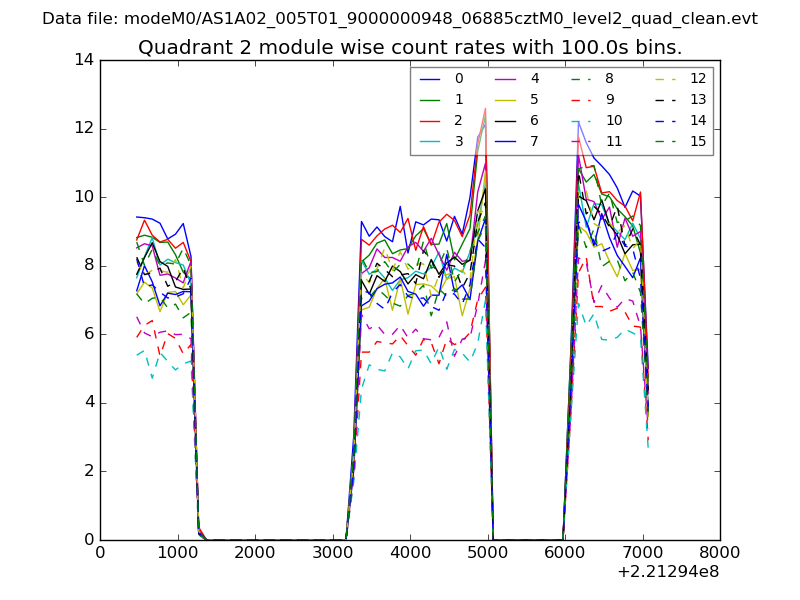
| Module-wise count rates for Quadrant B Data is divided into 100 sec bins |
 |
 |
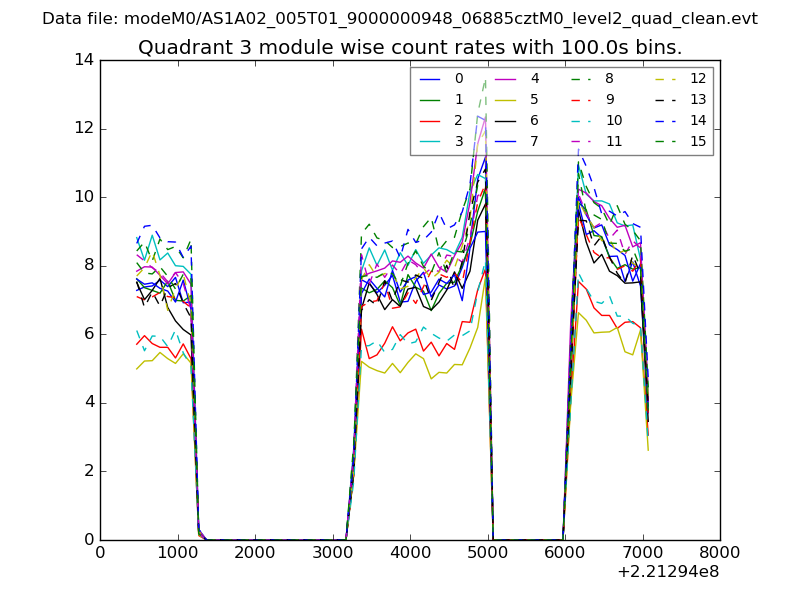
| Module-wise count rates for Quadrant C Data is divided into 100 sec bins |
 |
 |
| Module-wise count rates for Quadrant D Data is divided into 100 sec bins |
 |
 |
| Parameter | Plot |
|---|---|
| CZT HV Monitor | 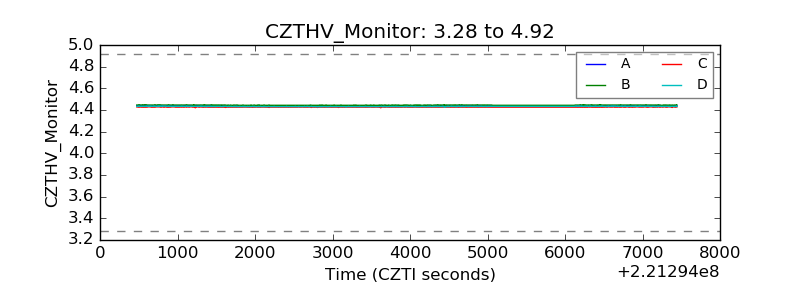 |
| D_VDD | 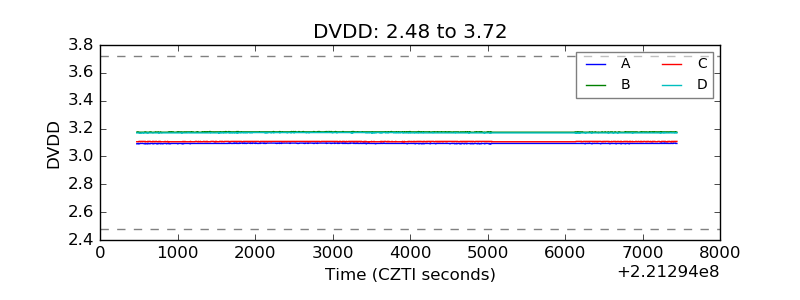 |
| Temperature 1 | 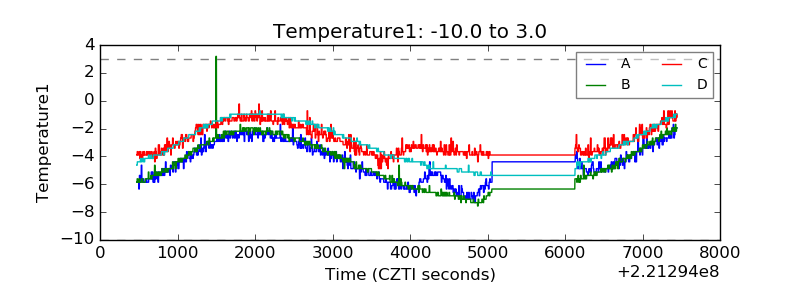 |
| Veto HV Monitor | 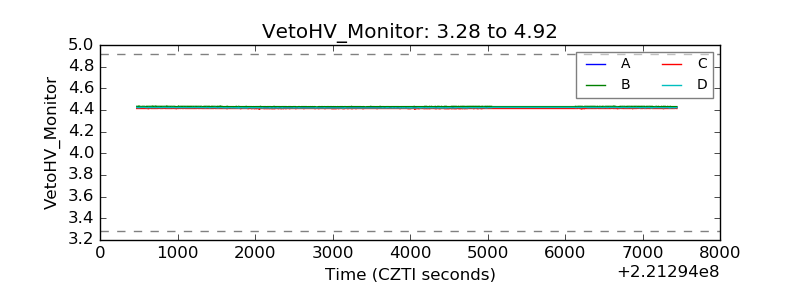 |
| Veto LLD | 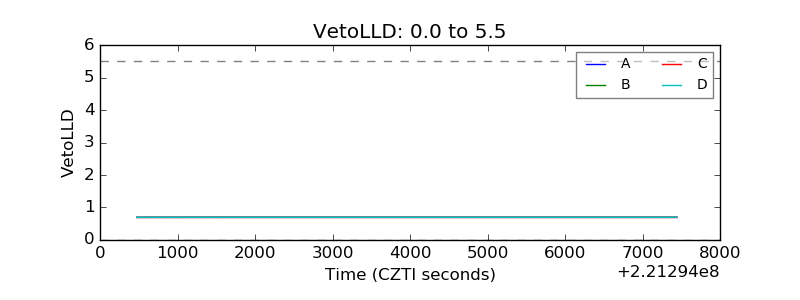 |
| Alpha Counter | 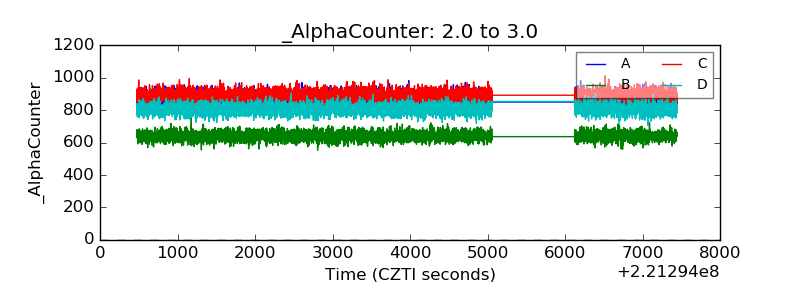 |
| _CPM_Rate | 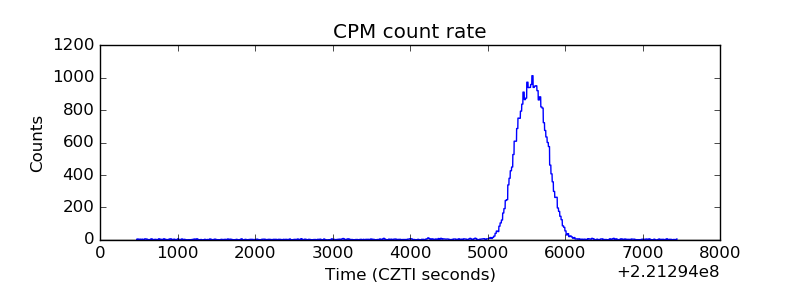 |
| CZT Counter | 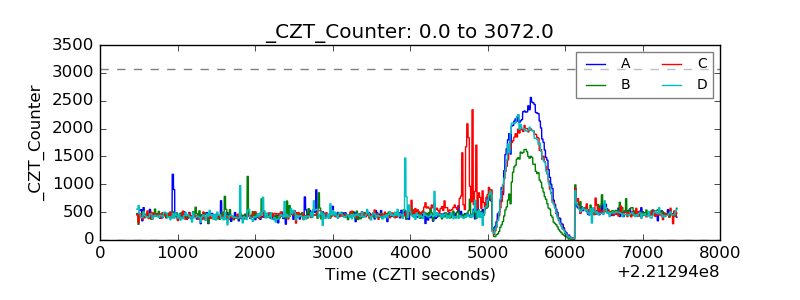 |
| +2.5 Volts monitor | 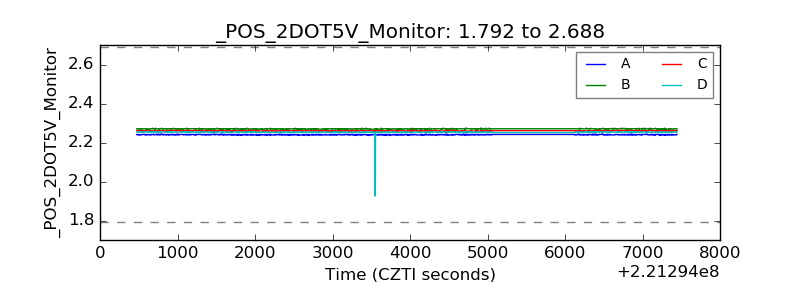 |
| +5 Volts monitor | 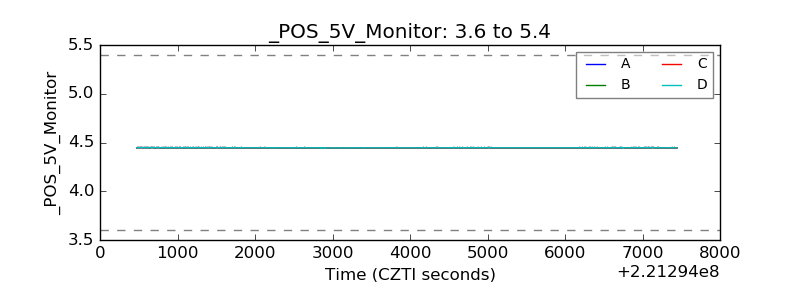 |
| _ROLL_ROT | 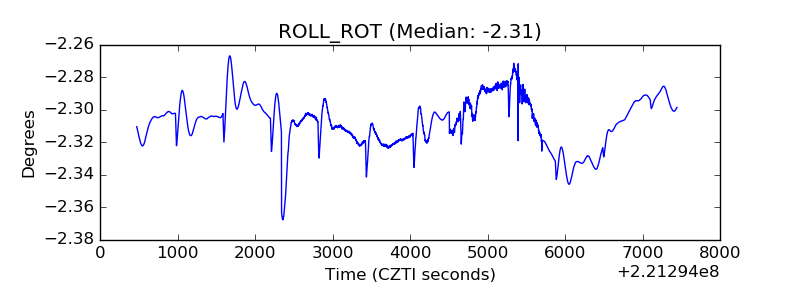 |
| _Roll_DEC | 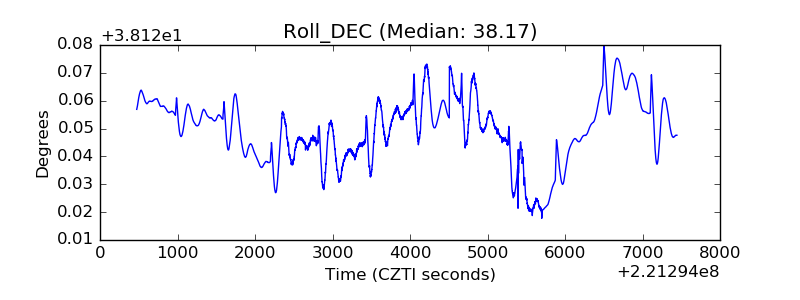 |
| _Roll_RA | 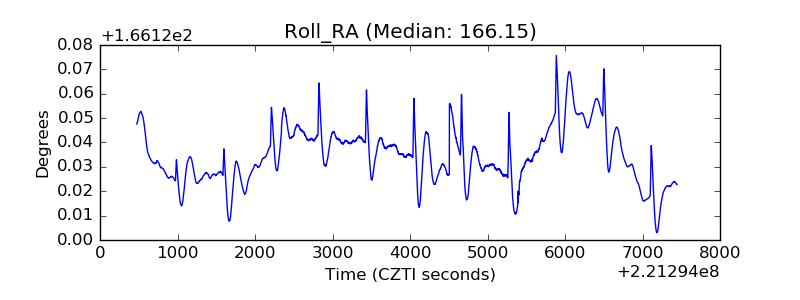 |
| Veto Counter | 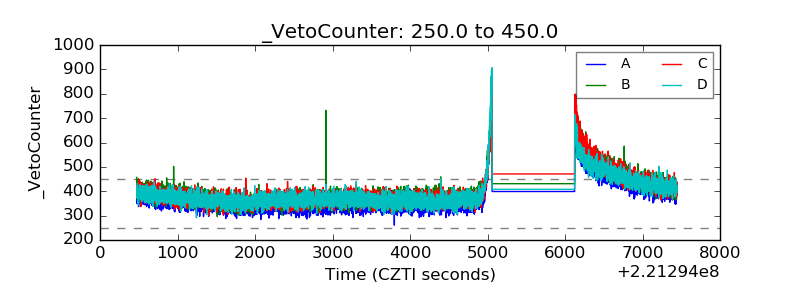 |