| Param | Original file | Final file |
|---|---|---|
| Filename | modeM0/AS1A02_005T01_9000000948_06890cztM0_level2.evt | modeM0/AS1A02_005T01_9000000948_06890cztM0_level2_quad_clean.evt |
| Size (bytes) | 1,694,505,600 | 293,616,000 |
| Size | 1.6 GB | 280.0 MB |
| Events in quadrant A | 11,811,550 | 1,836,288 |
| Events in quadrant B | 12,159,967 | 1,839,942 |
| Events in quadrant C | 13,208,370 | 1,813,258 |
| Events in quadrant D | 12,538,339 | 1,773,107 |
| Mode SS | |||
|---|---|---|---|
| Quadrant | BADHDUFLAG | Total packets | Discarded packets |
| A | 0 | 482 | 0 |
| B | 0 | 482 | 0 |
| C | 0 | 482 | 0 |
| D | 0 | 482 | 0 |
| Mode M0 | |||
|---|---|---|---|
| Quadrant | BADHDUFLAG | Total packets | Discarded packets |
| A | 0 | 50239 | 6 |
| B | 0 | 51161 | 5 |
| C | 0 | 53957 | 5 |
| D | 0 | 52872 | 5 |
| Mode M9 | |||
|---|---|---|---|
| Quadrant | BADHDUFLAG | Total packets | Discarded packets |
| A | 0 | 60 | 0 |
| B | 0 | 60 | 0 |
| C | 0 | 60 | 0 |
| D | 0 | 60 | 0 |
| Quadrant | Total seconds | Saturated seconds | Saturation percentage |
|---|---|---|---|
| A | 23688 | 462 | 1.950355% |
| B | 23688 | 455 | 1.920804% |
| C | 23688 | 534 | 2.254306% |
| D | 23688 | 727 | 3.069065% |
Noise dominated data is calculated using 1-second bins in cleaned event files. If a bin has >2000 counts, and if more than 50% of those come from <1% of pixels, then it is considered to be noise-dominated and hence unusable.
| Quadrant | # 1 sec bins | Bins with >0 counts | Bins with >2000 counts | High rate bins dominated by noise | Noise dominated (total time) | Noise dominated (detector-on time) | Marked lightcurve |
|---|---|---|---|---|---|---|---|
| A | 29714 | 23695 | 24 | 24 | 0.08% | 0.10% | 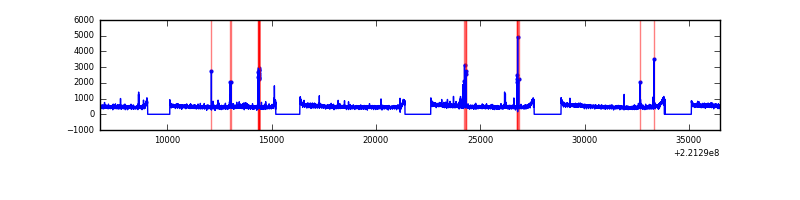 |
| B | 29714 | 23695 | 25 | 25 | 0.08% | 0.11% | 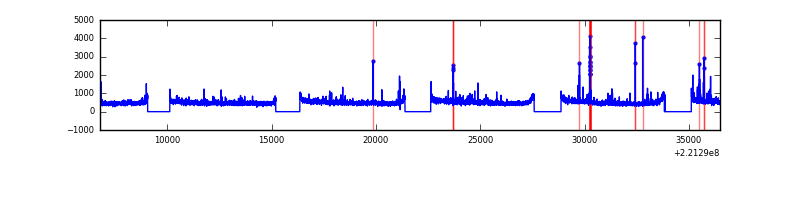 |
| C | 29714 | 23695 | 139 | 139 | 0.47% | 0.59% | 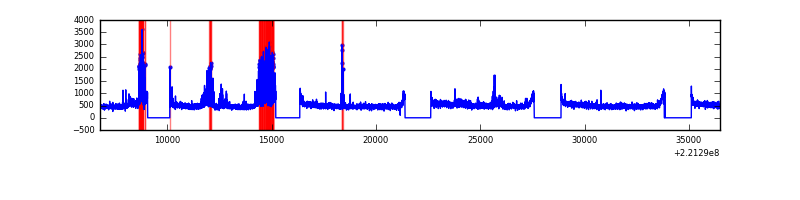 |
| D | 29714 | 23695 | 264 | 264 | 0.89% | 1.11% | 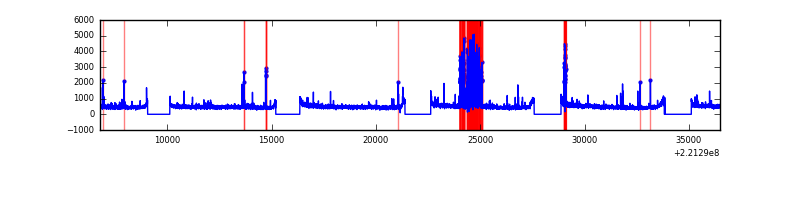 |
Top three noisy pixels from each quadrant. If the there are fewer than three noisy pixels in the level2.evt file, extra rows are filled as -1
| Pixel properties | Quadrant properties | ||||||
|---|---|---|---|---|---|---|---|
| Quadrant | DetID | PixID | Counts | Sigma | Mean | Median | Sigma |
| A | 8 | 15 | 131399 | 217.07 | 2981 | 2927 | 591.8 |
| A | 13 | 248 | 101053 | 165.8 | 2981 | 2927 | 591.8 |
| A | 13 | 251 | 70200 | 113.67 | 2981 | 2927 | 591.8 |
| B | 0 | 219 | 133399 | 234.37 | 2985 | 2916 | 556.7 |
| B | 4 | 48 | 120658 | 211.49 | 2985 | 2916 | 556.7 |
| B | 4 | 81 | 85222 | 147.84 | 2985 | 2916 | 556.7 |
| C | 9 | 247 | 1824337 | 2750.83 | 2899 | 2915 | 662.1 |
| C | 9 | 54 | 59873 | 86.02 | 2899 | 2915 | 662.1 |
| C | 13 | 61 | 22977 | 30.3 | 2899 | 2915 | 662.1 |
| D | 2 | 33 | 913683 | 1283.68 | 2908 | 2815 | 709.6 |
| D | 8 | 195 | 300667 | 419.76 | 2908 | 2815 | 709.6 |
| D | 2 | 14 | 148400 | 205.17 | 2908 | 2815 | 709.6 |
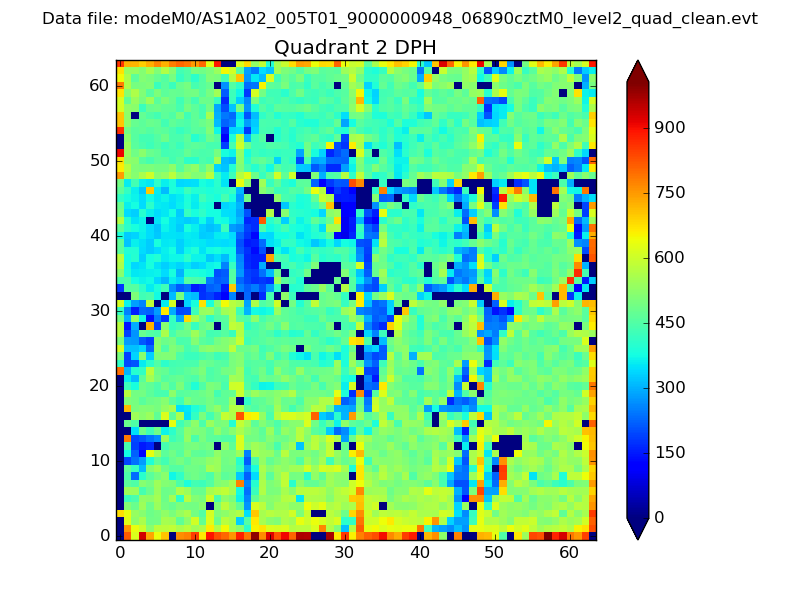
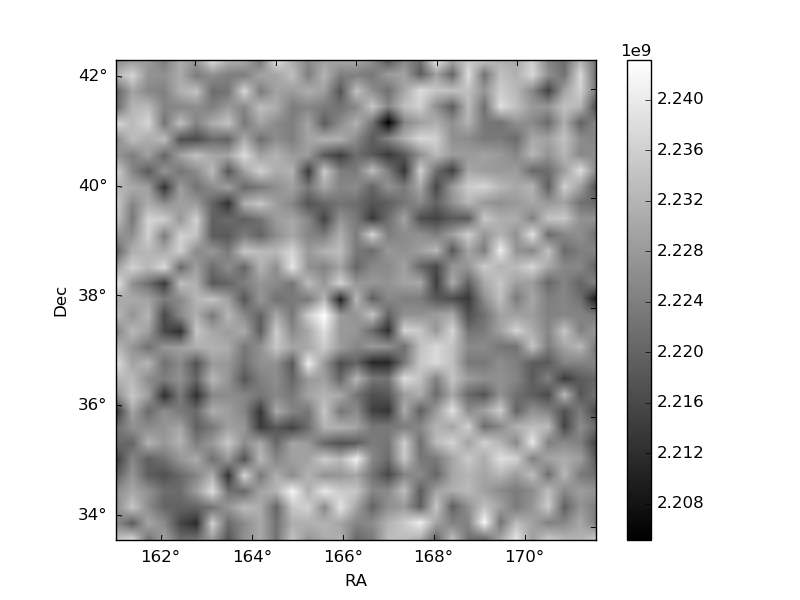
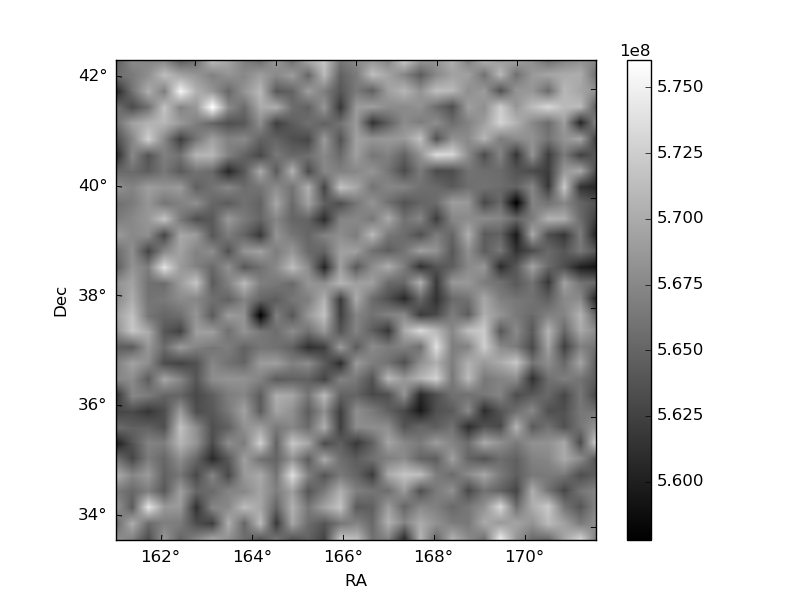
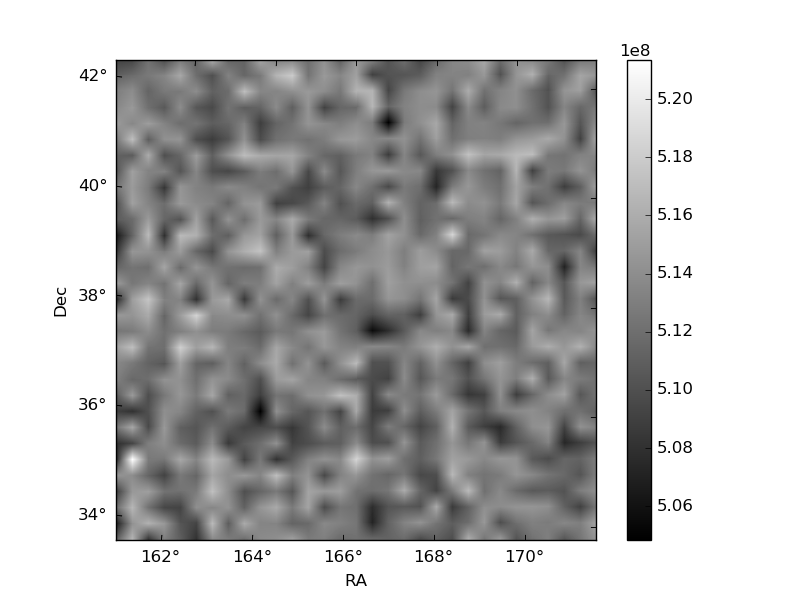
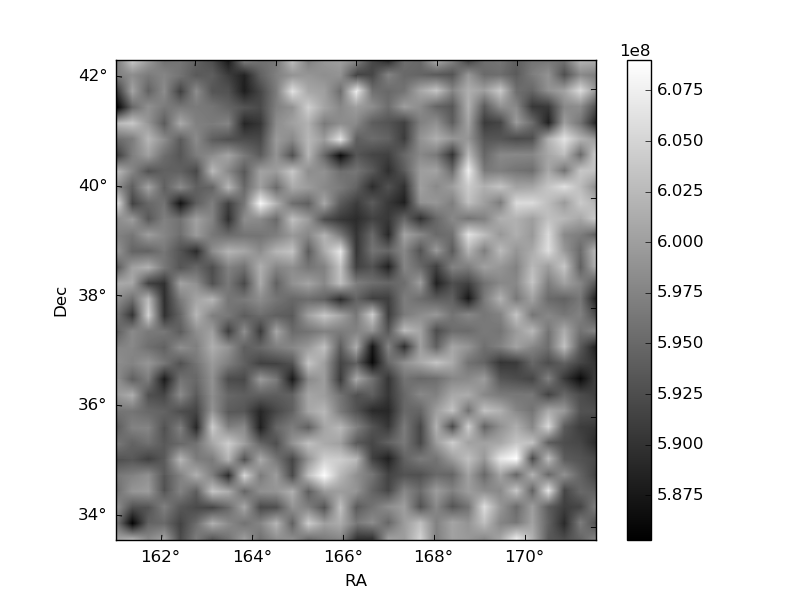
Histogram calculated using DETX and DETY for each event in the final _common_clean file
| Quadrant A | 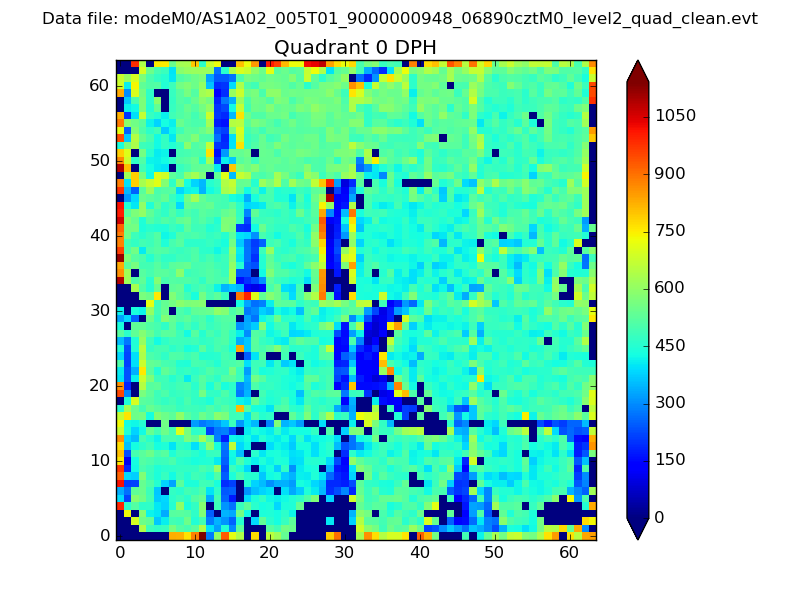 |
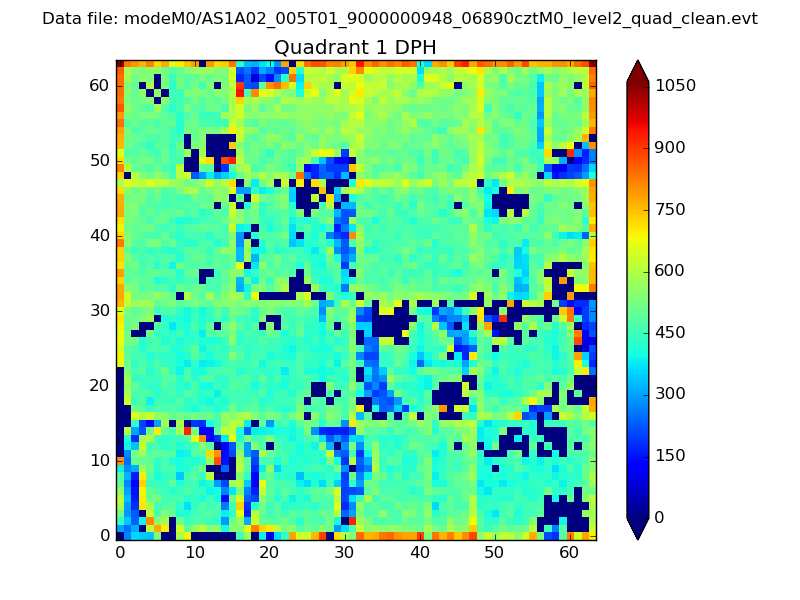 |
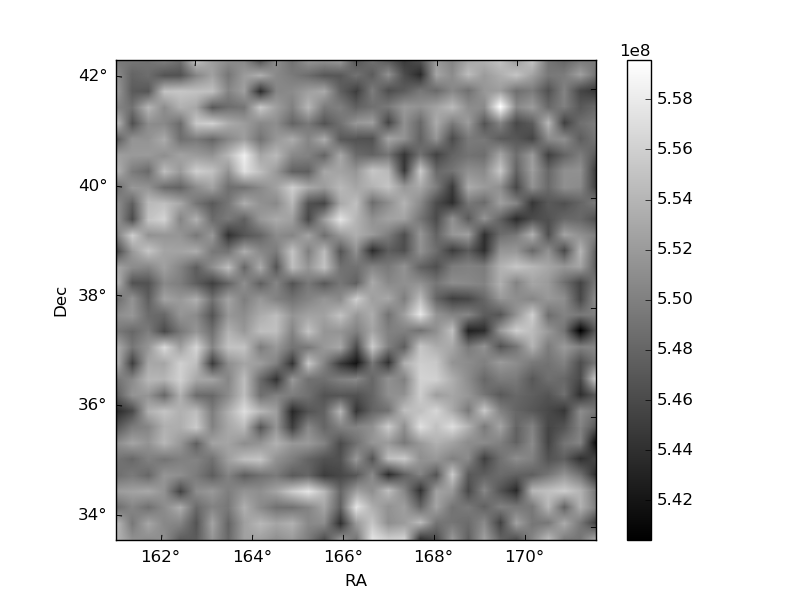
Quadrant B |
|---|---|---|---|
| Quadrant D | 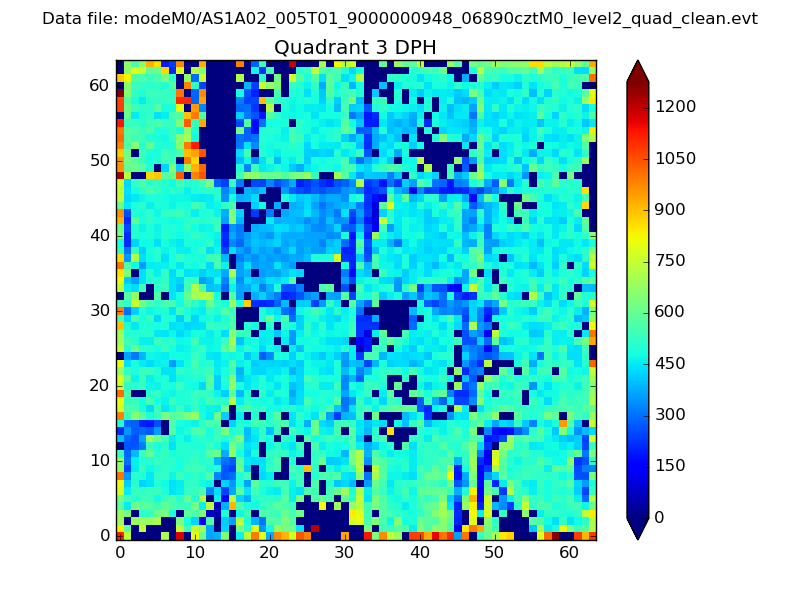 |
 |
Quadrant C |
| Plot type | Count rate plots | Images |
|---|---|---|
| Comparison with Poisson distribution Blue bars denote a histogram of data divided into 1 sec bins. Red curve is a Poisson curve with rate = median count rate of data. |
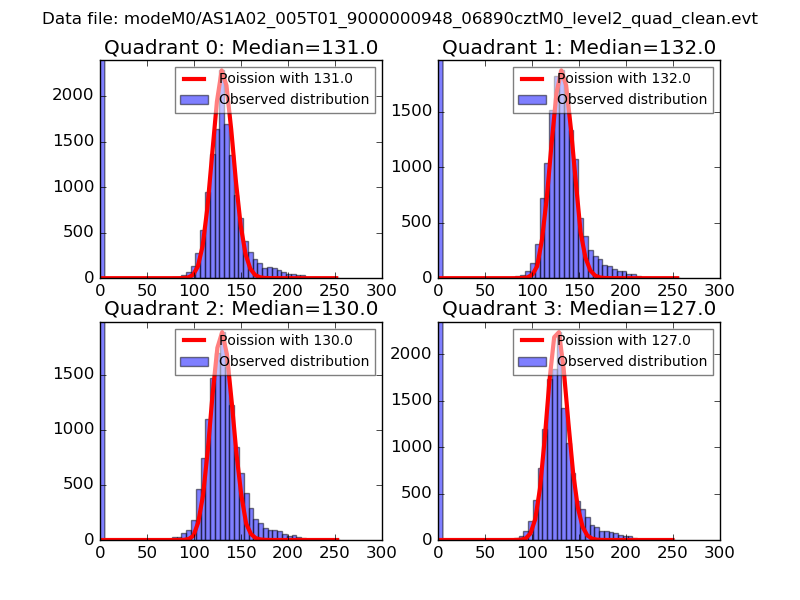 |
 |
| Quadrant-wise count rates Data is divided into 100 sec bins |
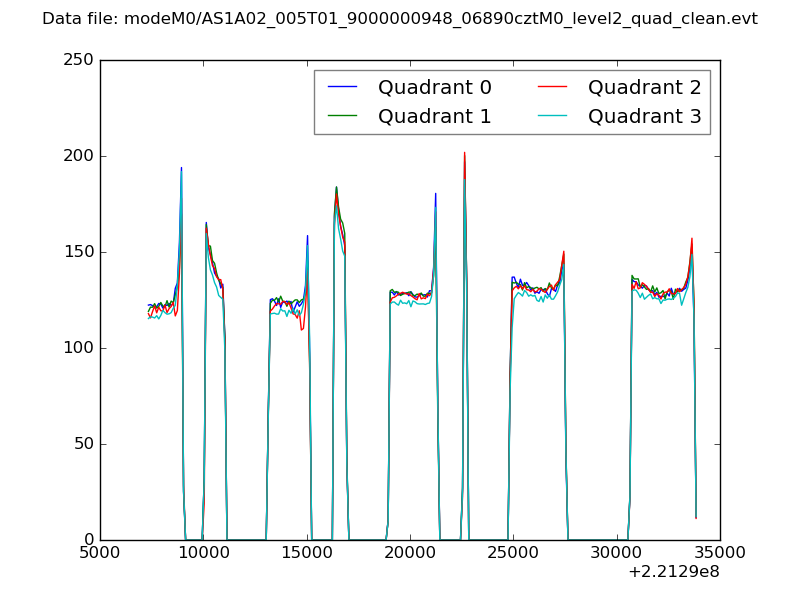 |
|
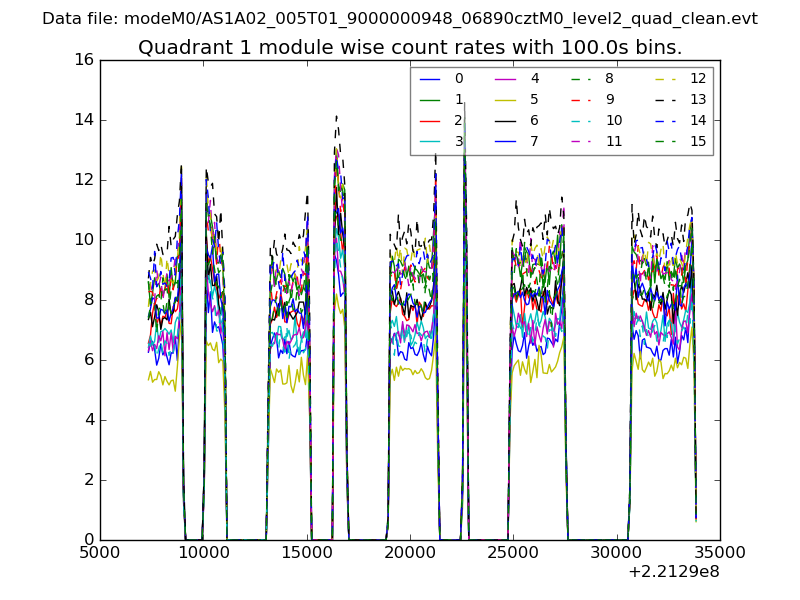
| Module-wise count rates for Quadrant A Data is divided into 100 sec bins |
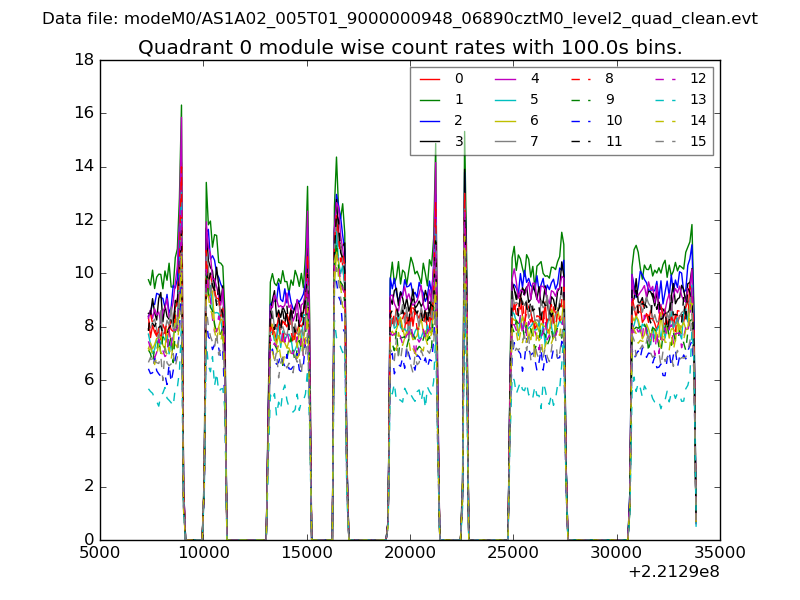 |
 |
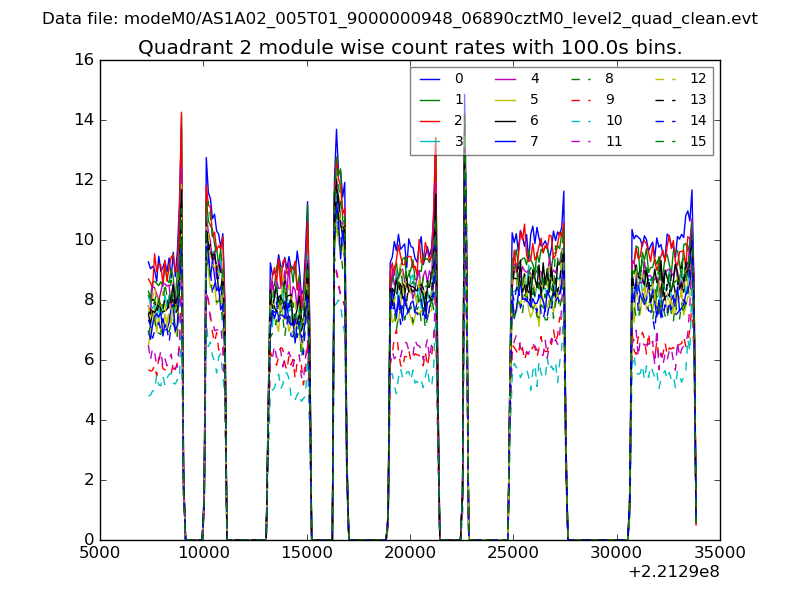
| Module-wise count rates for Quadrant B Data is divided into 100 sec bins |
 |
 |
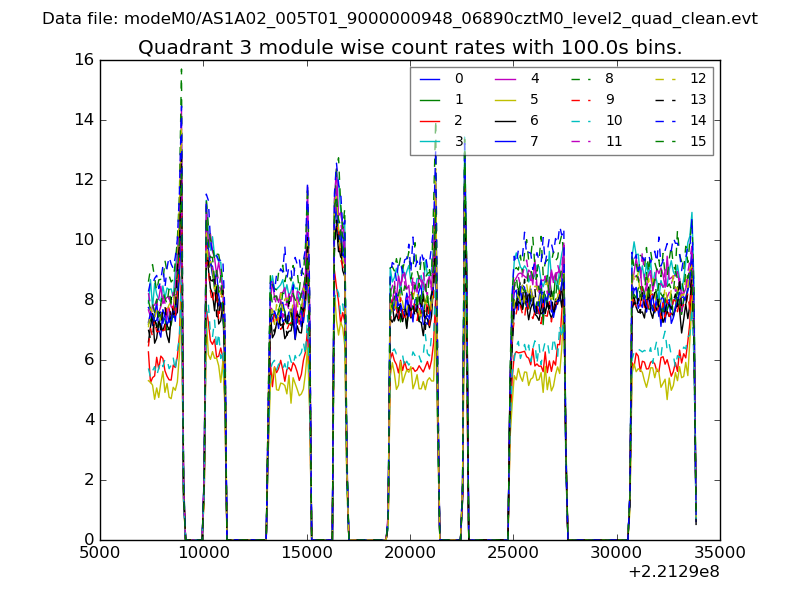
| Module-wise count rates for Quadrant C Data is divided into 100 sec bins |
 |
 |
| Module-wise count rates for Quadrant D Data is divided into 100 sec bins |
 |
 |
| Parameter | Plot |
|---|---|
| CZT HV Monitor | 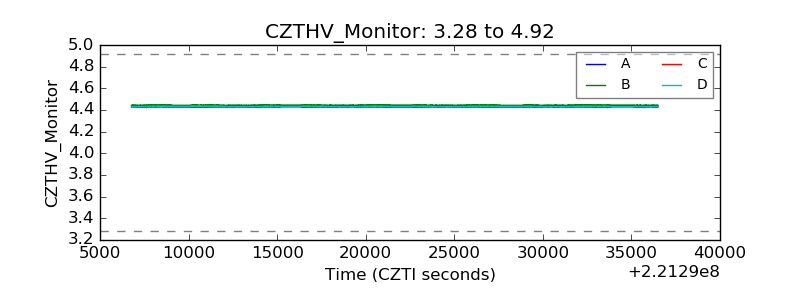 |
| D_VDD | 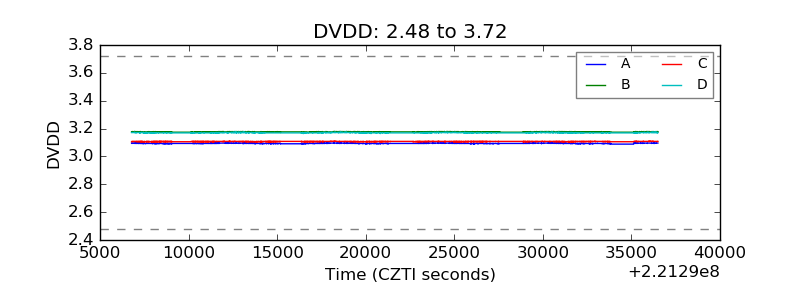 |
| Temperature 1 | 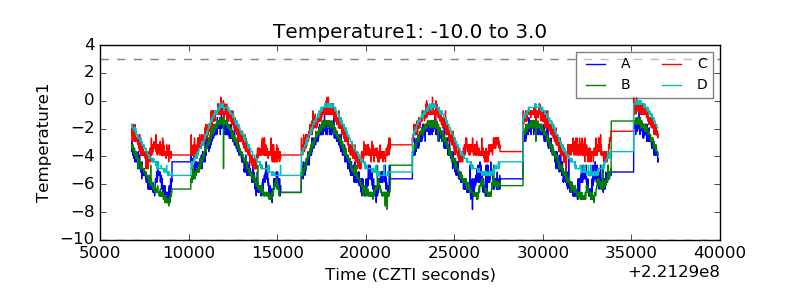 |
| Veto HV Monitor | 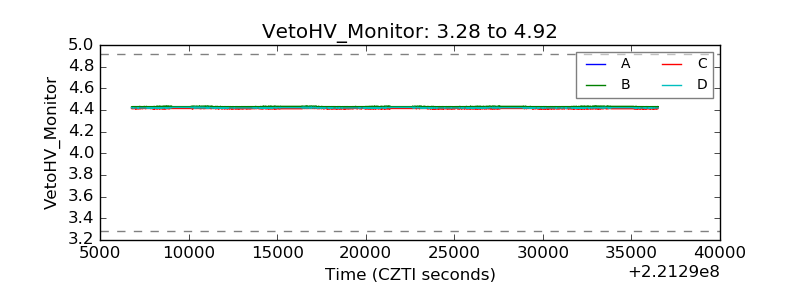 |
| Veto LLD | 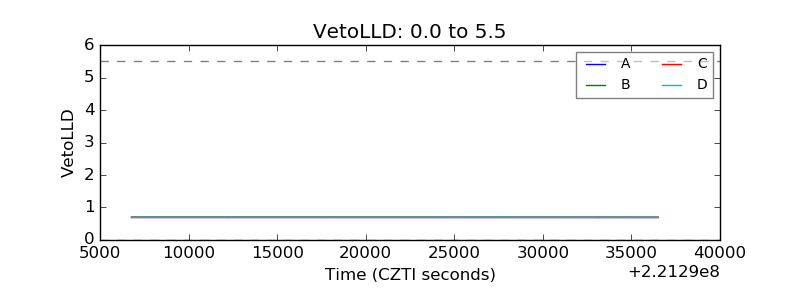 |
| Alpha Counter | 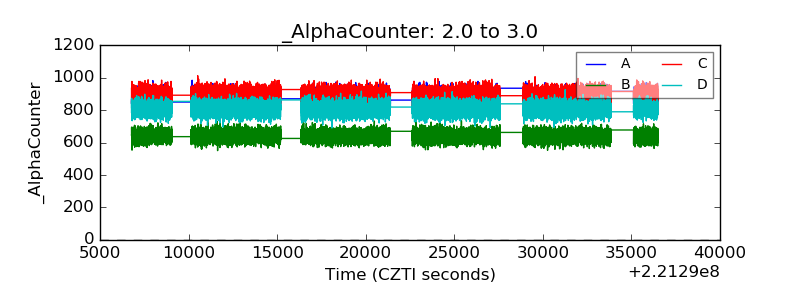 |
| _CPM_Rate | 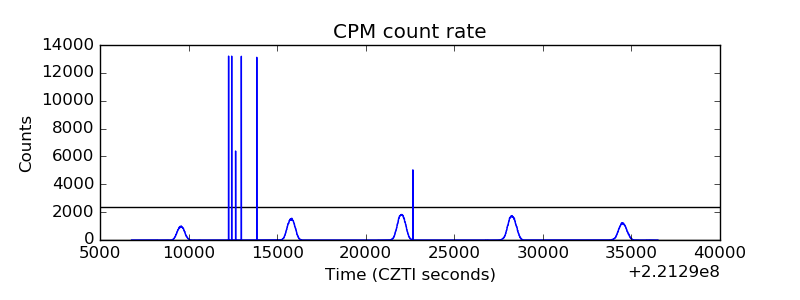 |
| CZT Counter | 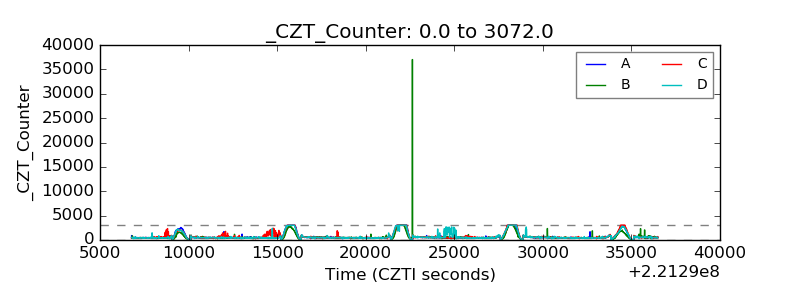 |
| +2.5 Volts monitor | 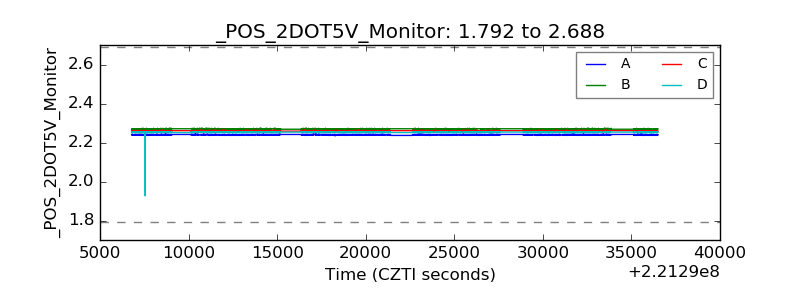 |
| +5 Volts monitor | 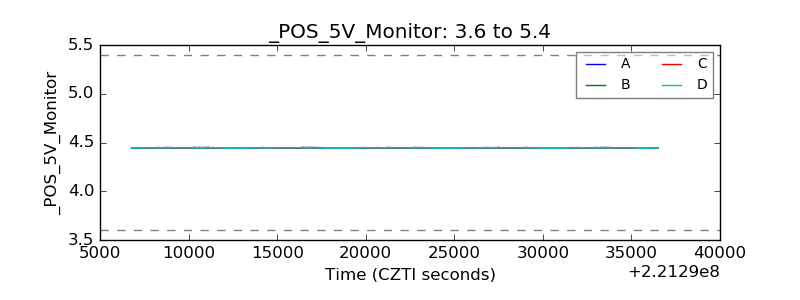 |
| _ROLL_ROT | 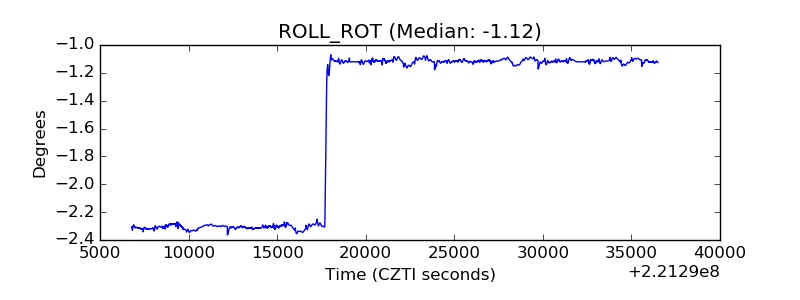 |
| _Roll_DEC | 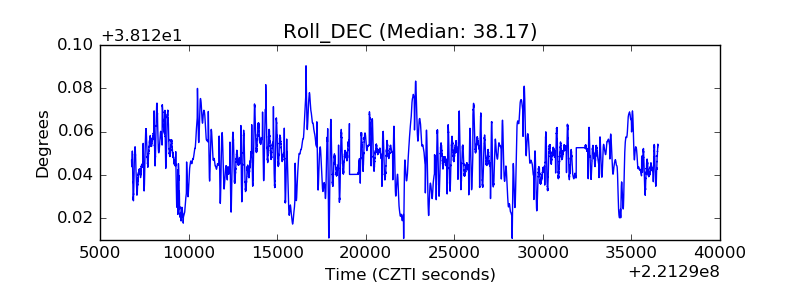 |
| _Roll_RA | 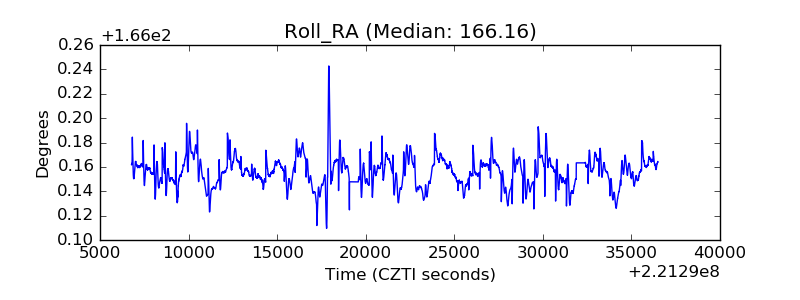 |
| Veto Counter | 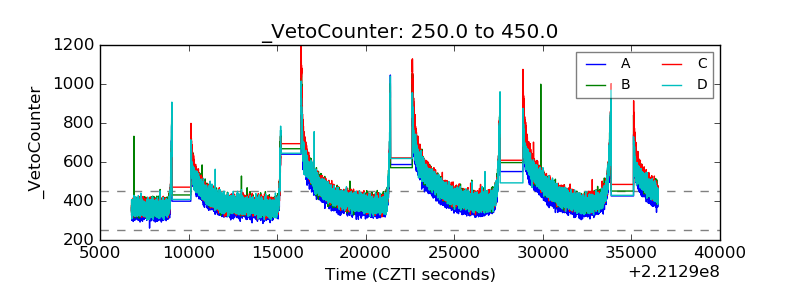 |