| Param | Original file | Final file |
|---|---|---|
| Filename | modeM0/AS1A02_005T01_9000000948_06893cztM0_level2.evt | modeM0/AS1A02_005T01_9000000948_06893cztM0_level2_quad_clean.evt |
| Size (bytes) | 508,429,440 | 92,122,560 |
| Size | 484.9 MB | 87.9 MB |
| Events in quadrant A | 3,379,405 | 575,518 |
| Events in quadrant B | 3,572,449 | 582,837 |
| Events in quadrant C | 3,369,448 | 577,896 |
| Events in quadrant D | 4,581,079 | 545,817 |
| Mode SS | |||
|---|---|---|---|
| Quadrant | BADHDUFLAG | Total packets | Discarded packets |
| A | 0 | 148 | 0 |
| B | 0 | 148 | 0 |
| C | 0 | 148 | 0 |
| D | 0 | 148 | 0 |
| Mode M0 | |||
|---|---|---|---|
| Quadrant | BADHDUFLAG | Total packets | Discarded packets |
| A | 0 | 15137 | 3 |
| B | 0 | 15583 | 2 |
| C | 0 | 15067 | 2 |
| D | 0 | 18941 | 2 |
| Mode M9 | |||
|---|---|---|---|
| Quadrant | BADHDUFLAG | Total packets | Discarded packets |
| A | 0 | 4 | 0 |
| B | 0 | 4 | 0 |
| C | 0 | 4 | 0 |
| D | 0 | 4 | 0 |
| Quadrant | Total seconds | Saturated seconds | Saturation percentage |
|---|---|---|---|
| A | 7290 | 46 | 0.631001% |
| B | 7290 | 100 | 1.371742% |
| C | 7290 | 41 | 0.562414% |
| D | 7291 | 474 | 6.501166% |
Noise dominated data is calculated using 1-second bins in cleaned event files. If a bin has >2000 counts, and if more than 50% of those come from <1% of pixels, then it is considered to be noise-dominated and hence unusable.
| Quadrant | # 1 sec bins | Bins with >0 counts | Bins with >2000 counts | High rate bins dominated by noise | Noise dominated (total time) | Noise dominated (detector-on time) | Marked lightcurve |
|---|---|---|---|---|---|---|---|
| A | 7650 | 7291 | 2 | 2 | 0.03% | 0.03% | 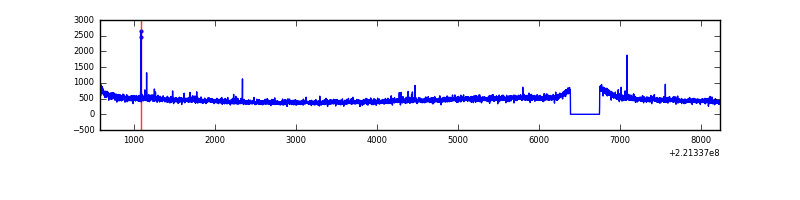 |
| B | 7650 | 7291 | 2 | 2 | 0.03% | 0.03% | 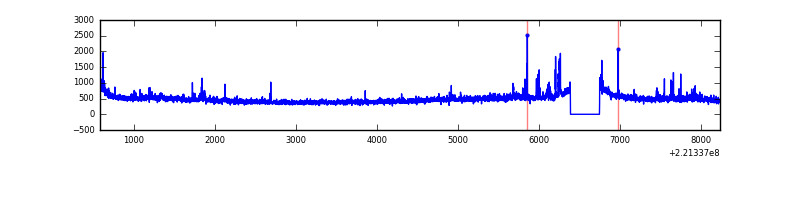 |
| C | 7650 | 7291 | 0 | 0 | 0.00% | 0.00% | 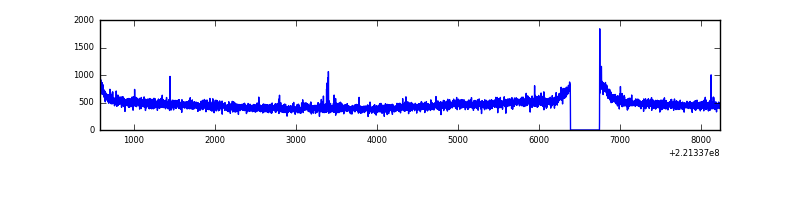 |
| D | 7651 | 7292 | 376 | 376 | 4.91% | 5.16% | 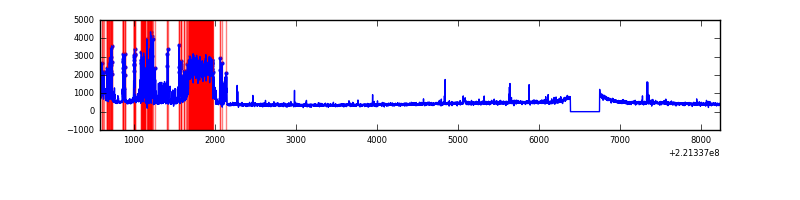 |
Top three noisy pixels from each quadrant. If the there are fewer than three noisy pixels in the level2.evt file, extra rows are filled as -1
| Pixel properties | Quadrant properties | ||||||
|---|---|---|---|---|---|---|---|
| Quadrant | DetID | PixID | Counts | Sigma | Mean | Median | Sigma |
| A | 8 | 15 | 35738 | 199.12 | 859 | 842 | 175.3 |
| A | 13 | 251 | 18633 | 101.52 | 859 | 842 | 175.3 |
| A | 13 | 14 | 15856 | 85.67 | 859 | 842 | 175.3 |
| B | 0 | 228 | 96370 | 576.02 | 867 | 845 | 165.8 |
| B | 0 | 219 | 45215 | 267.55 | 867 | 845 | 165.8 |
| B | 0 | 214 | 24433 | 142.24 | 867 | 845 | 165.8 |
| C | 9 | 247 | 73775 | 372.89 | 840 | 844 | 195.6 |
| C | 9 | 54 | 14776 | 71.23 | 840 | 844 | 195.6 |
| C | 13 | 61 | 6832 | 30.62 | 840 | 844 | 195.6 |
| D | 12 | 6 | 1277365 | 6324.31 | 822 | 796 | 201.9 |
| D | 7 | 55 | 72979 | 357.61 | 822 | 796 | 201.9 |
| D | 8 | 195 | 63229 | 309.3 | 822 | 796 | 201.9 |
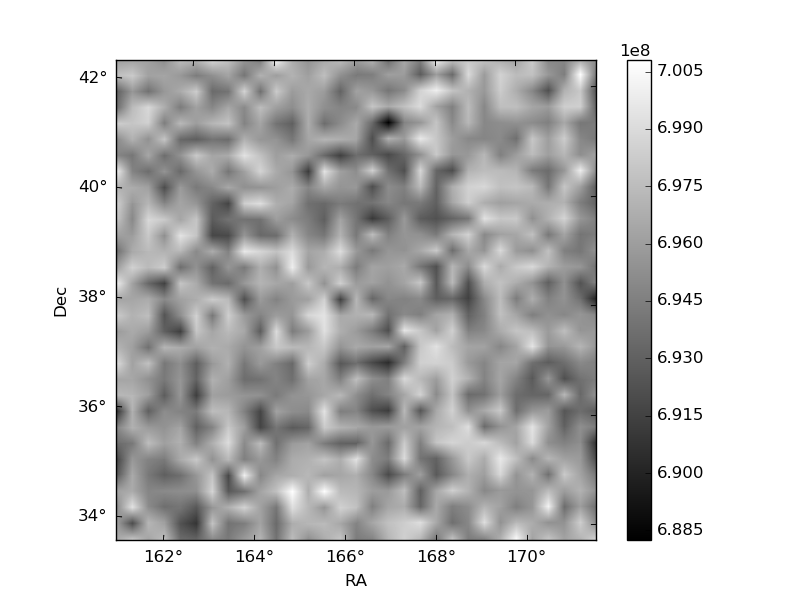
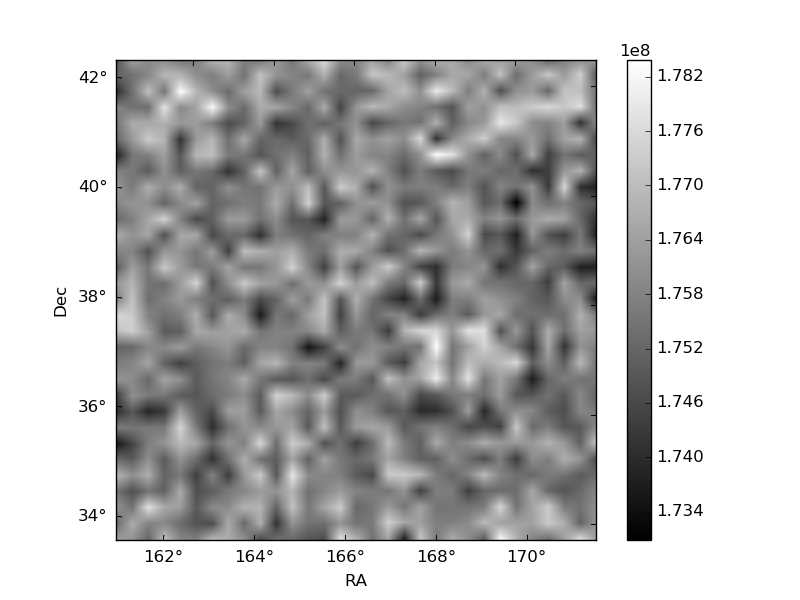
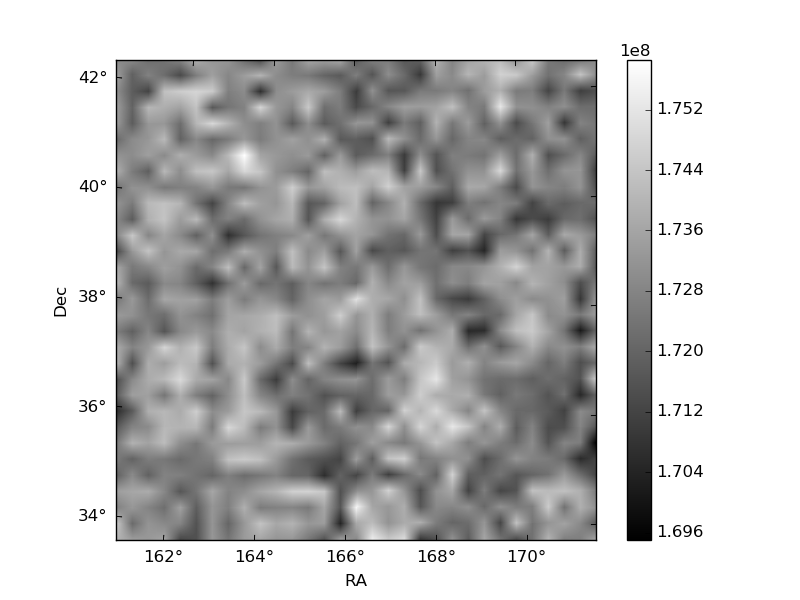
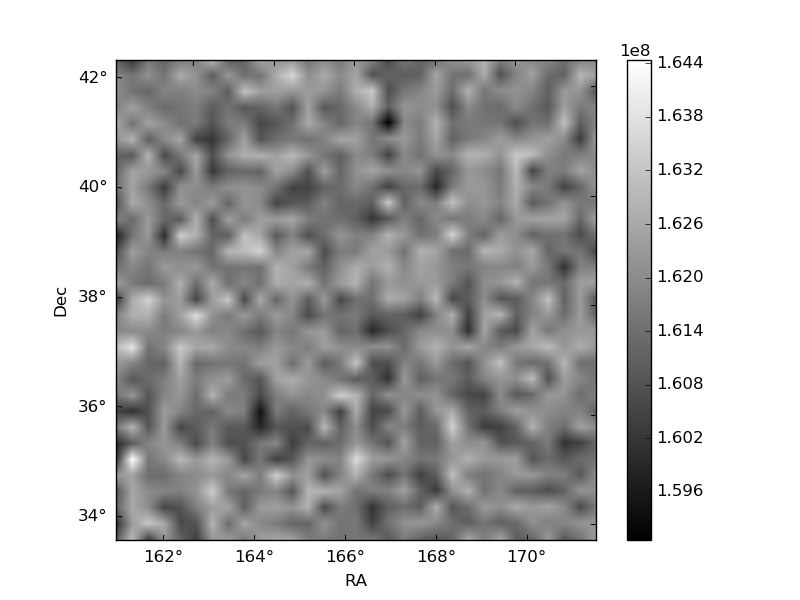
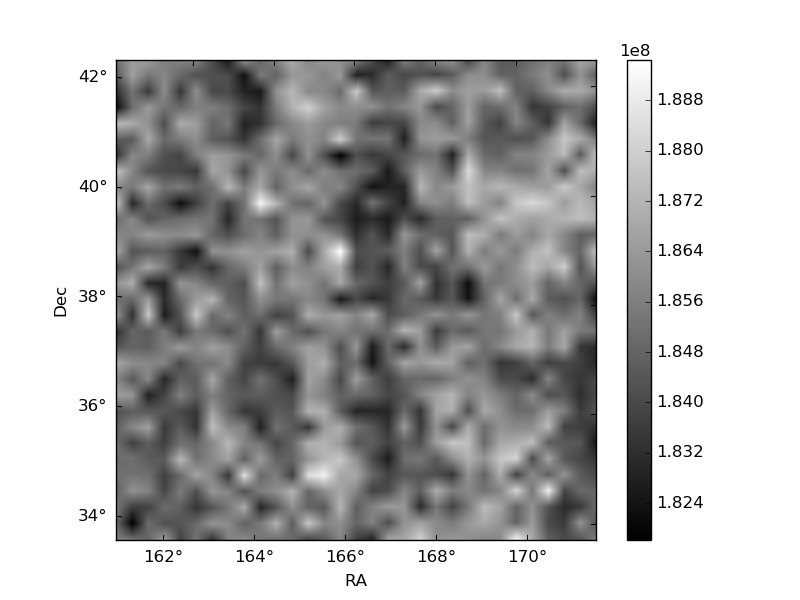
Histogram calculated using DETX and DETY for each event in the final _common_clean file
| Quadrant A | 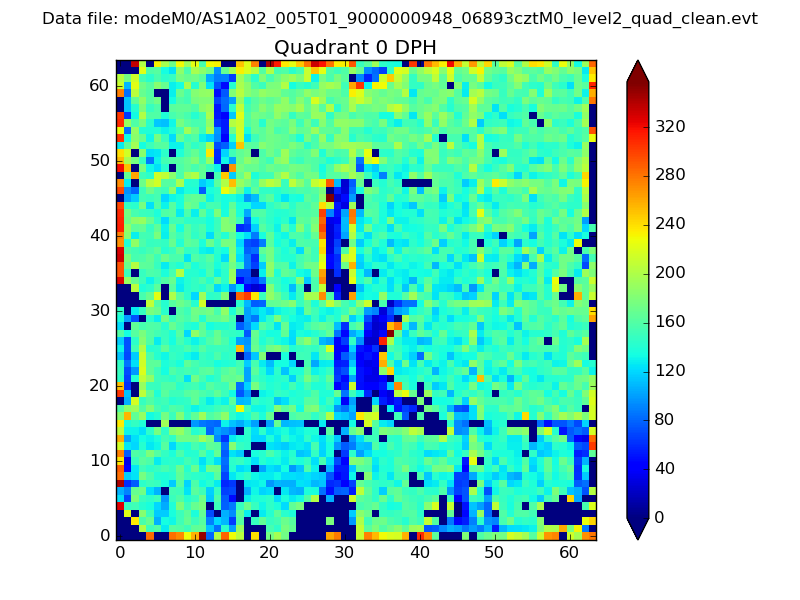 |
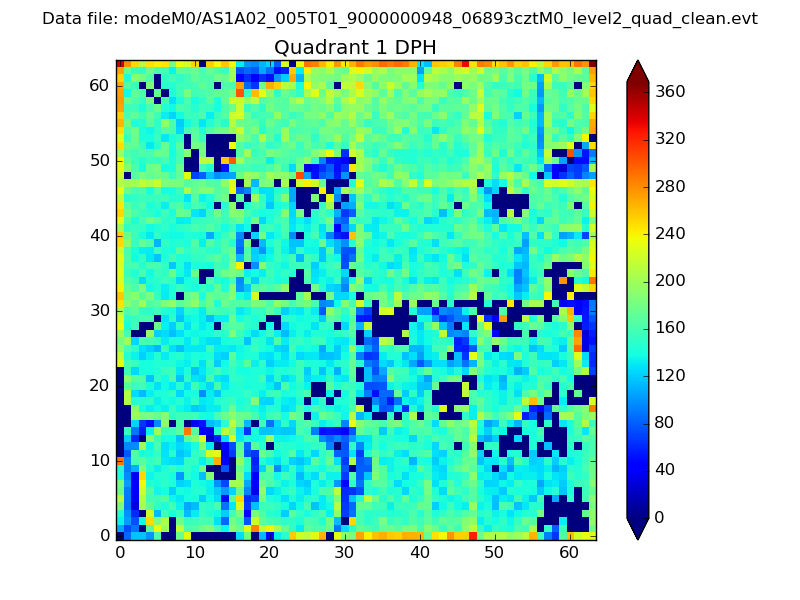 |
Quadrant B |
|---|---|---|---|
| Quadrant D | 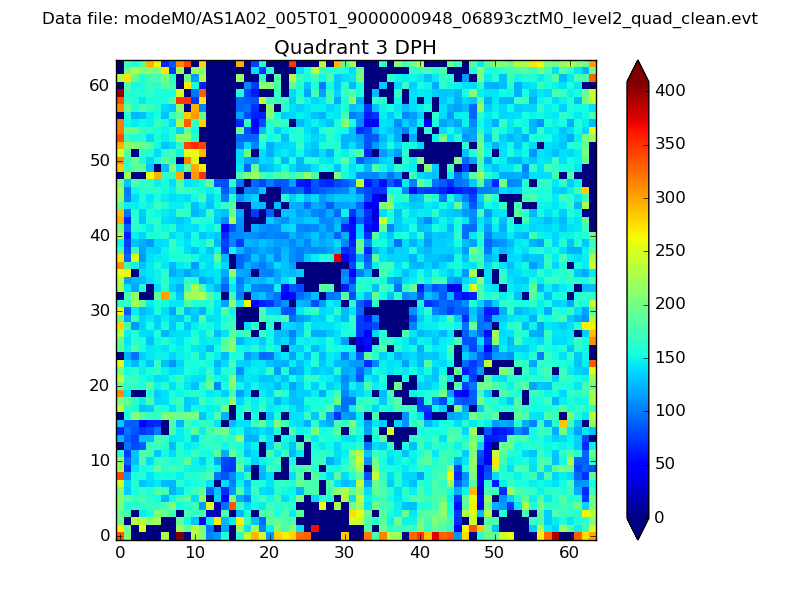 |
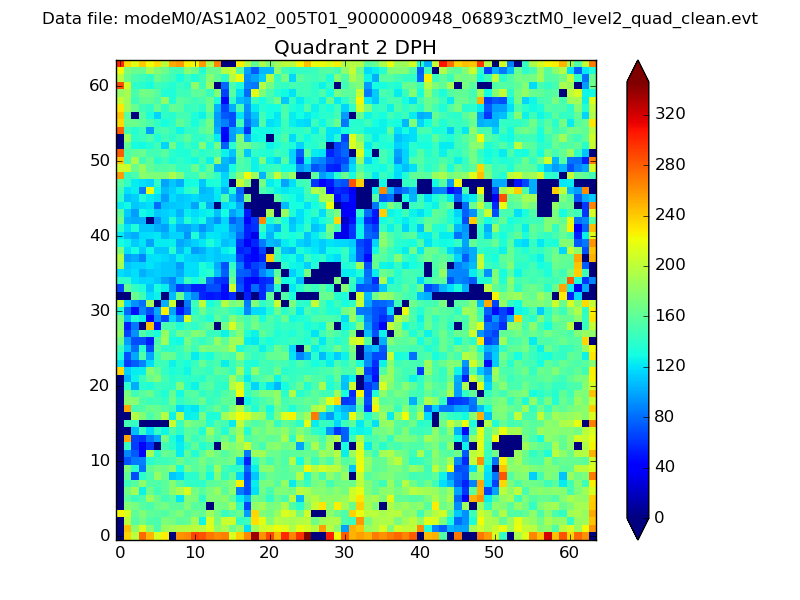 |
Quadrant C |
| Plot type | Count rate plots | Images |
|---|---|---|
| Comparison with Poisson distribution Blue bars denote a histogram of data divided into 1 sec bins. Red curve is a Poisson curve with rate = median count rate of data. |
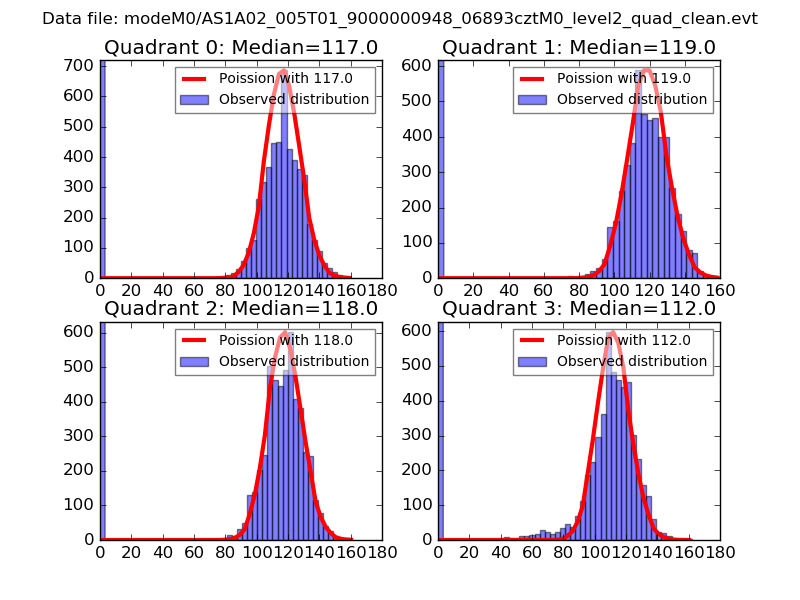 |
 |
| Quadrant-wise count rates Data is divided into 100 sec bins |
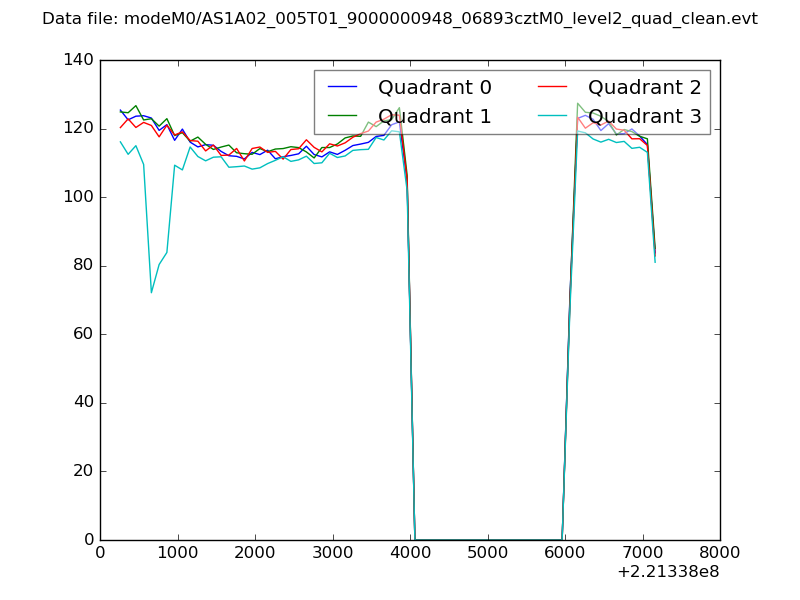 |
|
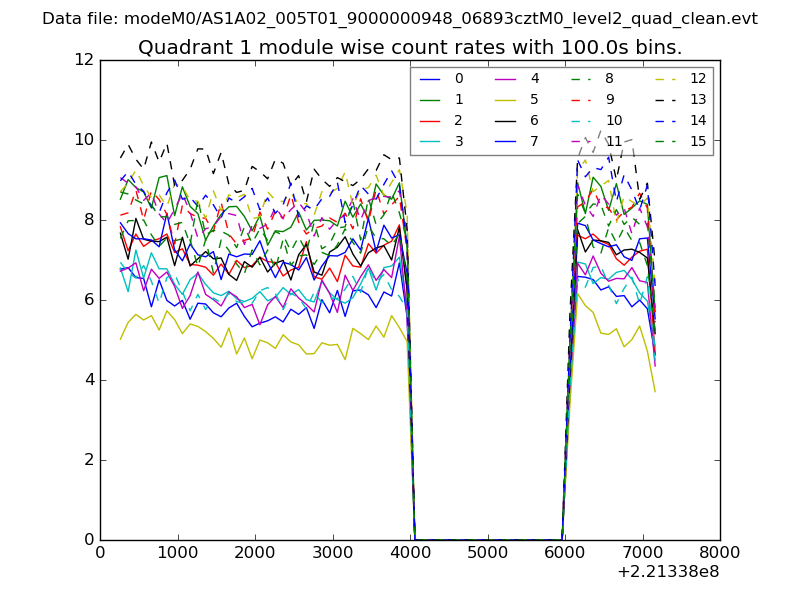
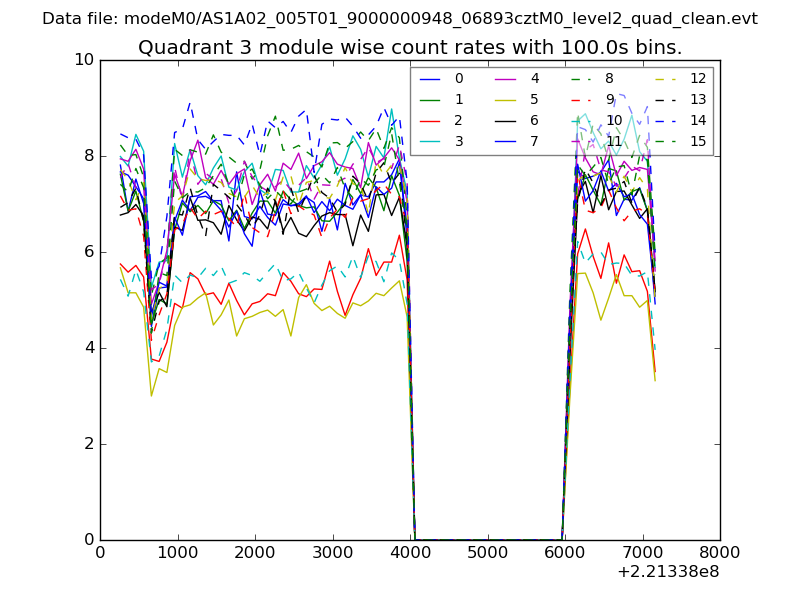
| Module-wise count rates for Quadrant A Data is divided into 100 sec bins |
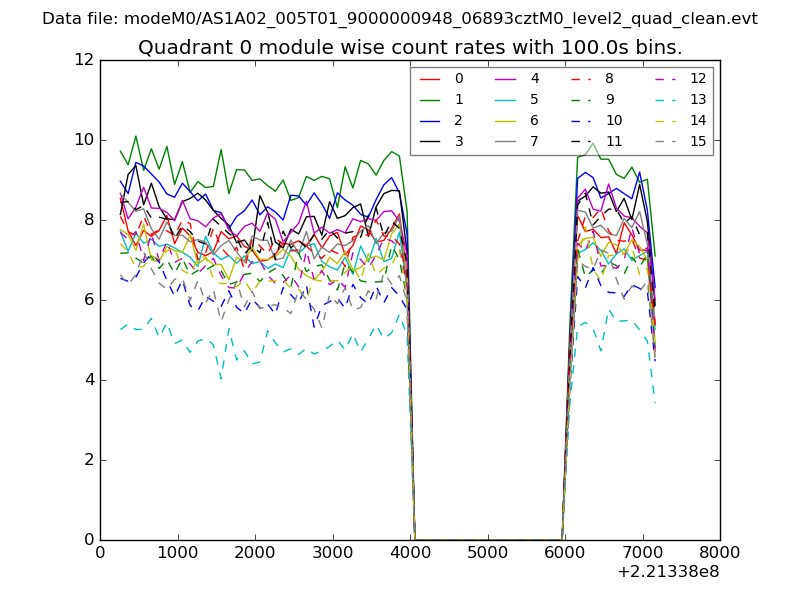 |
 |
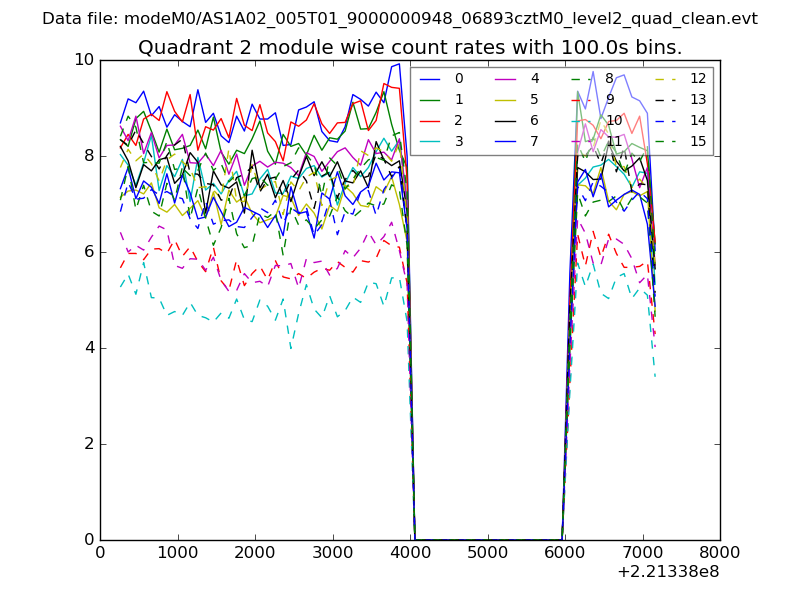
| Module-wise count rates for Quadrant B Data is divided into 100 sec bins |
 |
 |
| Module-wise count rates for Quadrant C Data is divided into 100 sec bins |
 |
 |
| Module-wise count rates for Quadrant D Data is divided into 100 sec bins |
 |
 |
| Parameter | Plot |
|---|---|
| CZT HV Monitor | 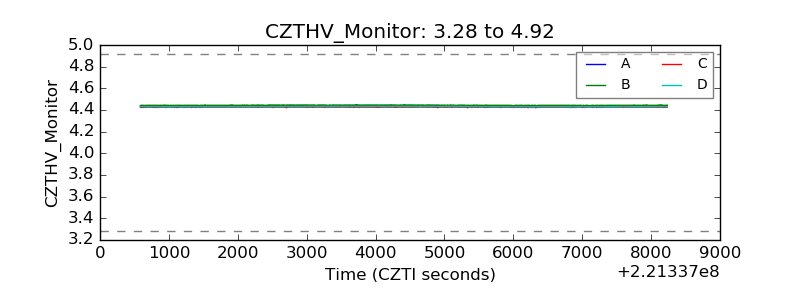 |
| D_VDD | 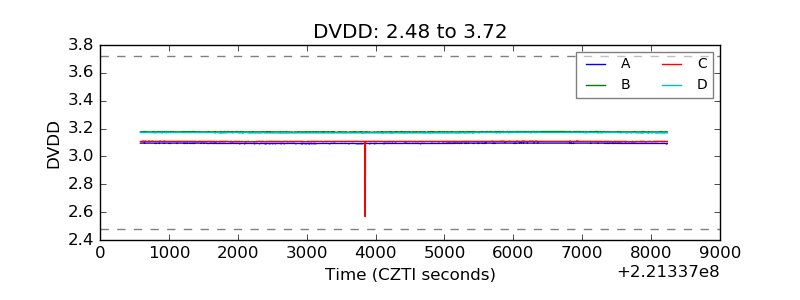 |
| Temperature 1 | 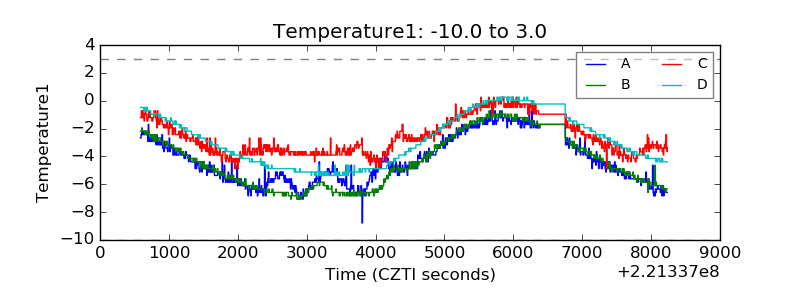 |
| Veto HV Monitor | 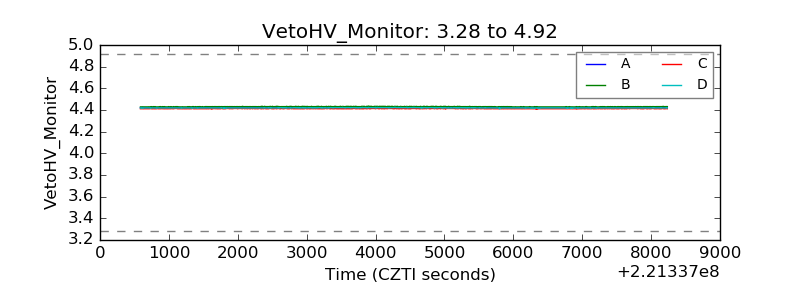 |
| Veto LLD | 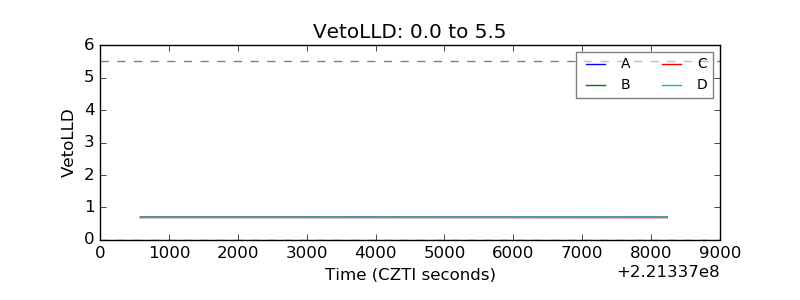 |
| Alpha Counter | 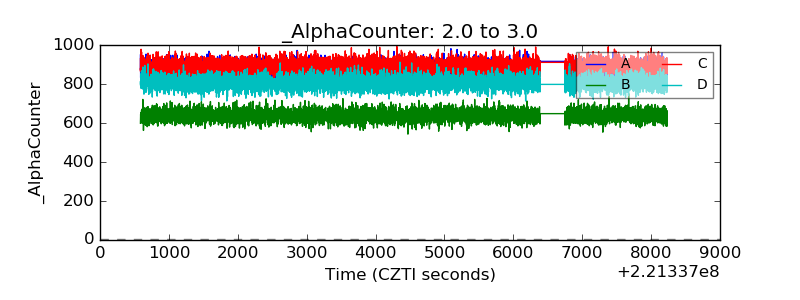 |
| _CPM_Rate | 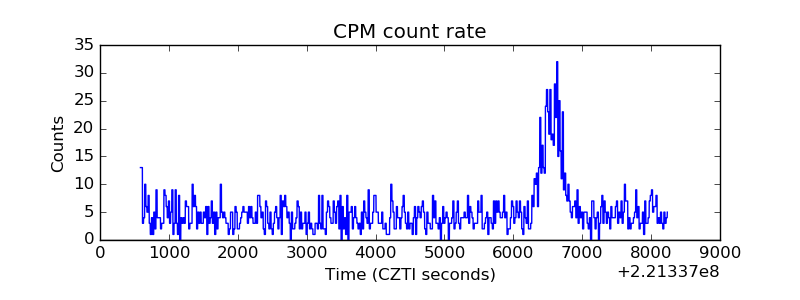 |
| CZT Counter | 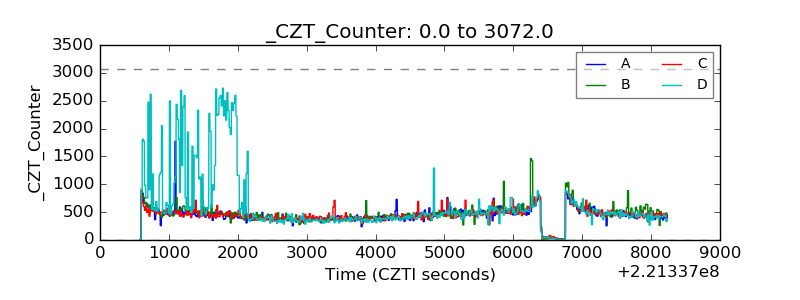 |
| +2.5 Volts monitor | 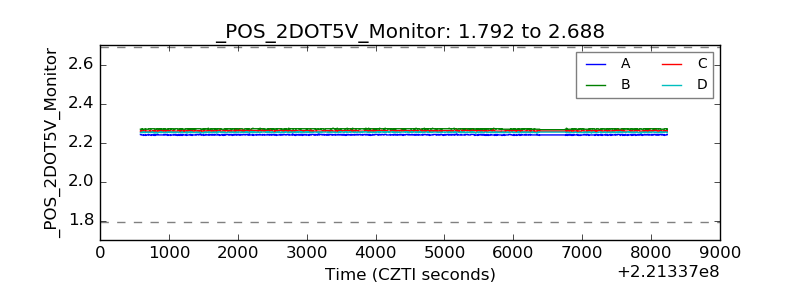 |
| +5 Volts monitor | 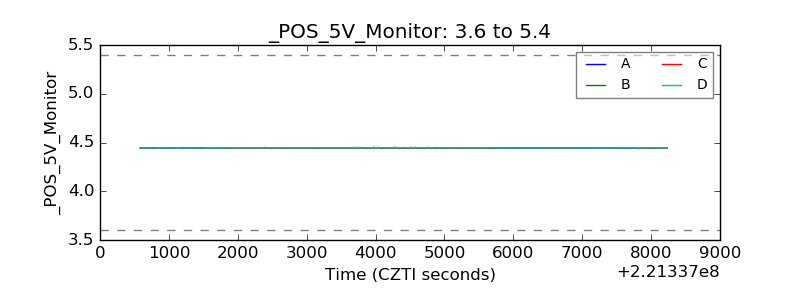 |
| _ROLL_ROT | 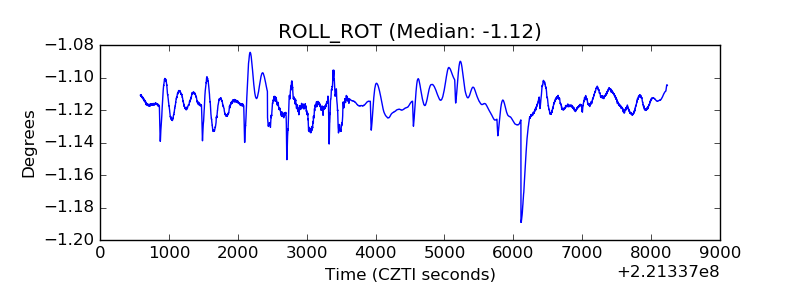 |
| _Roll_DEC | 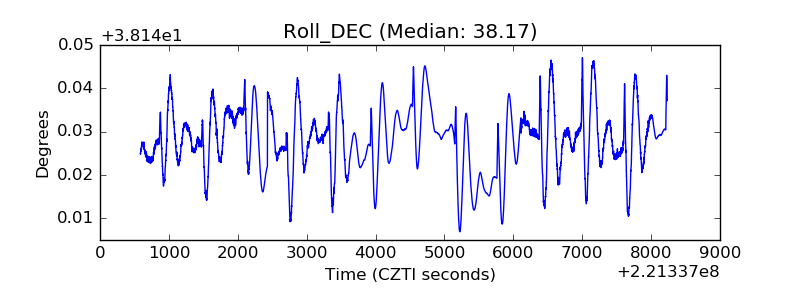 |
| _Roll_RA | 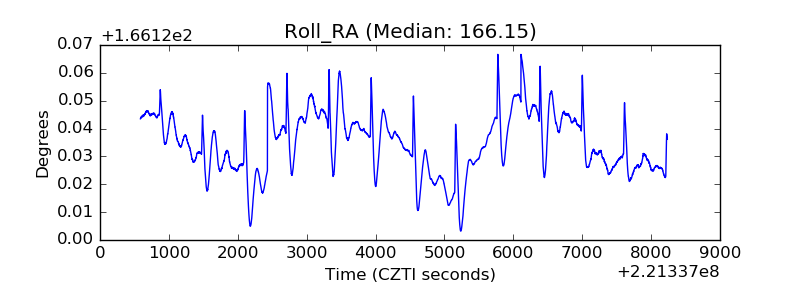 |
| Veto Counter | 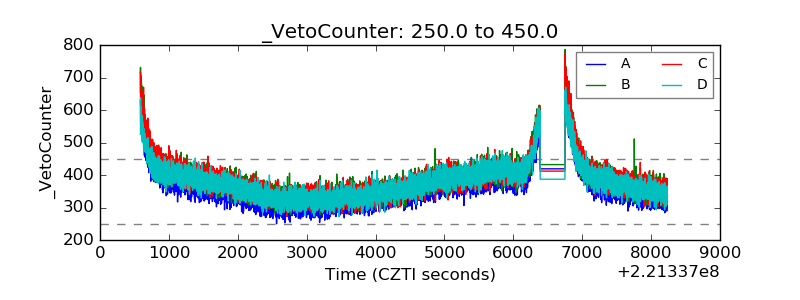 |