| Param | Original file | Final file |
|---|---|---|
| Filename | modeM0/AS1A02_005T01_9000000948_06897cztM0_level2.evt | modeM0/AS1A02_005T01_9000000948_06897cztM0_level2_quad_clean.evt |
| Size (bytes) | 892,517,760 | 164,554,560 |
| Size | 851.2 MB | 156.9 MB |
| Events in quadrant A | 7,746,058 | 1,024,771 |
| Events in quadrant B | 6,059,810 | 1,040,726 |
| Events in quadrant C | 5,885,995 | 1,033,141 |
| Events in quadrant D | 6,463,930 | 992,911 |
| Mode SS | |||
|---|---|---|---|
| Quadrant | BADHDUFLAG | Total packets | Discarded packets |
| A | 0 | 262 | 0 |
| B | 0 | 262 | 0 |
| C | 0 | 262 | 0 |
| D | 0 | 262 | 0 |
| Mode M0 | |||
|---|---|---|---|
| Quadrant | BADHDUFLAG | Total packets | Discarded packets |
| A | 0 | 32330 | 4 |
| B | 0 | 27110 | 3 |
| C | 0 | 26832 | 3 |
| D | 0 | 28502 | 3 |
| Mode M9 | |||
|---|---|---|---|
| Quadrant | BADHDUFLAG | Total packets | Discarded packets |
| A | 0 | 14 | 0 |
| B | 0 | 14 | 0 |
| C | 0 | 14 | 0 |
| D | 0 | 14 | 0 |
| Quadrant | Total seconds | Saturated seconds | Saturation percentage |
|---|---|---|---|
| A | 12916 | 646 | 5.001548% |
| B | 12916 | 170 | 1.316197% |
| C | 12916 | 87 | 0.673583% |
| D | 12916 | 129 | 0.998761% |
Noise dominated data is calculated using 1-second bins in cleaned event files. If a bin has >2000 counts, and if more than 50% of those come from <1% of pixels, then it is considered to be noise-dominated and hence unusable.
| Quadrant | # 1 sec bins | Bins with >0 counts | Bins with >2000 counts | High rate bins dominated by noise | Noise dominated (total time) | Noise dominated (detector-on time) | Marked lightcurve |
|---|---|---|---|---|---|---|---|
| A | 14226 | 12919 | 412 | 412 | 2.90% | 3.19% | 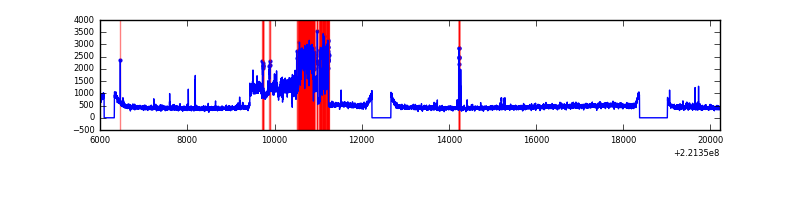 |
| B | 14226 | 12919 | 2 | 2 | 0.01% | 0.02% | 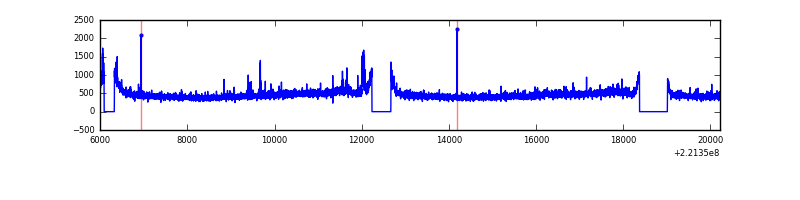 |
| C | 14226 | 12919 | 8 | 8 | 0.06% | 0.06% | 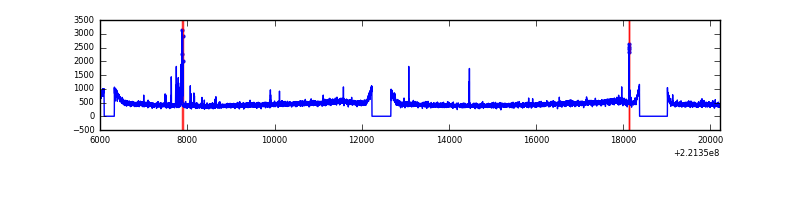 |
| D | 14226 | 12919 | 36 | 36 | 0.25% | 0.28% | 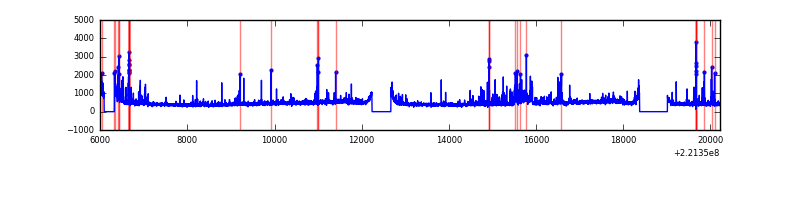 |
Top three noisy pixels from each quadrant. If the there are fewer than three noisy pixels in the level2.evt file, extra rows are filled as -1
| Pixel properties | Quadrant properties | ||||||
|---|---|---|---|---|---|---|---|
| Quadrant | DetID | PixID | Counts | Sigma | Mean | Median | Sigma |
| A | 14 | 111 | 2018036 | 6779.12 | 1460 | 1425 | 297.5 |
| A | 13 | 248 | 51342 | 167.8 | 1460 | 1425 | 297.5 |
| A | 8 | 15 | 36739 | 118.71 | 1460 | 1425 | 297.5 |
| B | 0 | 219 | 99122 | 339.99 | 1504 | 1471 | 287.2 |
| B | 4 | 81 | 46815 | 157.87 | 1504 | 1471 | 287.2 |
| B | 12 | 111 | 29776 | 98.55 | 1504 | 1471 | 287.2 |
| C | 9 | 247 | 152090 | 446.23 | 1452 | 1458 | 337.6 |
| C | 10 | 22 | 17222 | 46.7 | 1452 | 1458 | 337.6 |
| C | 8 | 128 | 15377 | 41.23 | 1452 | 1458 | 337.6 |
| D | 2 | 216 | 424251 | 1188.24 | 1448 | 1401 | 355.9 |
| D | 5 | 81 | 234064 | 653.8 | 1448 | 1401 | 355.9 |
| D | 8 | 195 | 162088 | 451.54 | 1448 | 1401 | 355.9 |
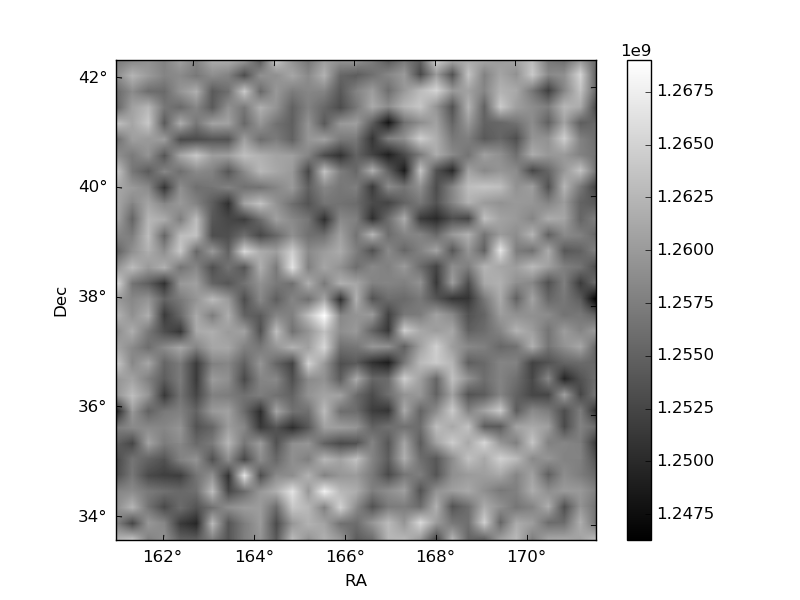
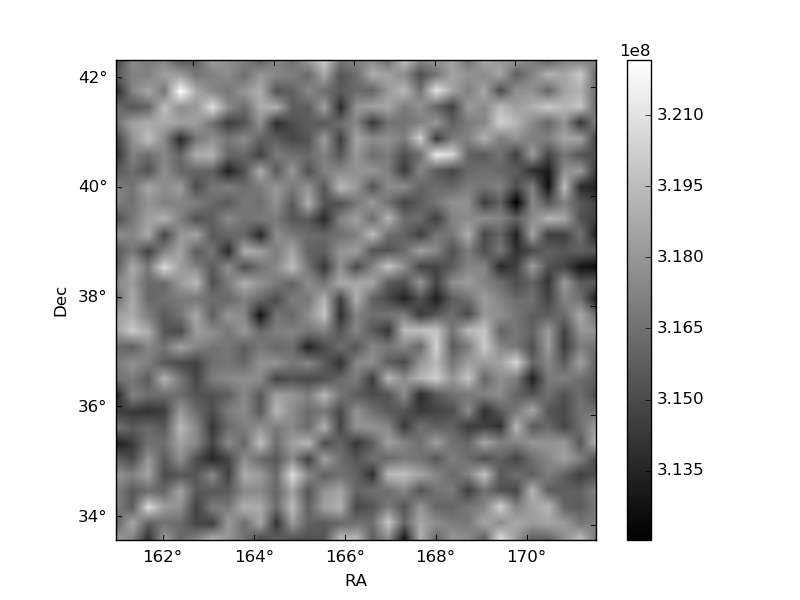
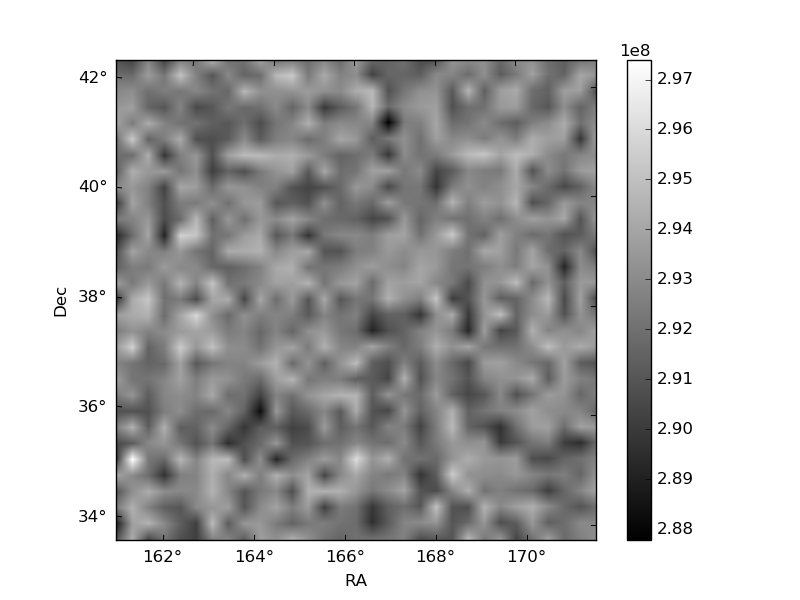
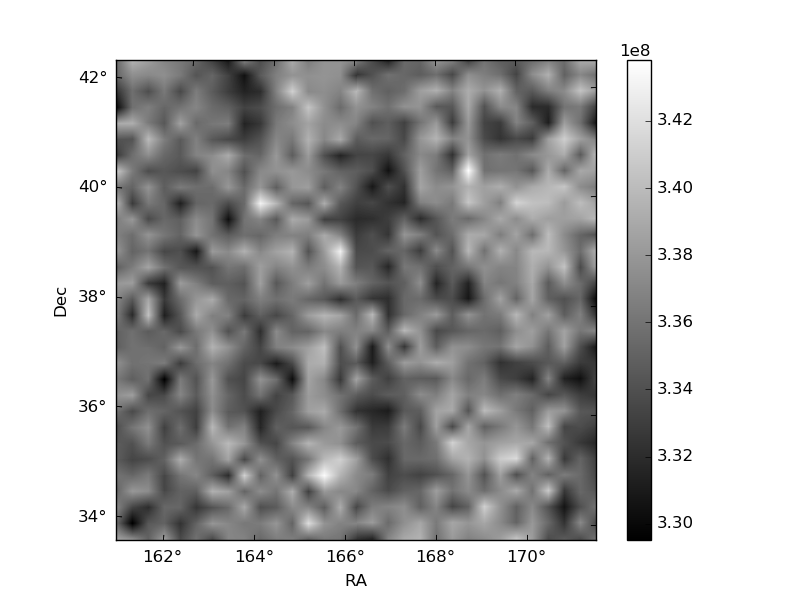
Histogram calculated using DETX and DETY for each event in the final _common_clean file
| Quadrant A | 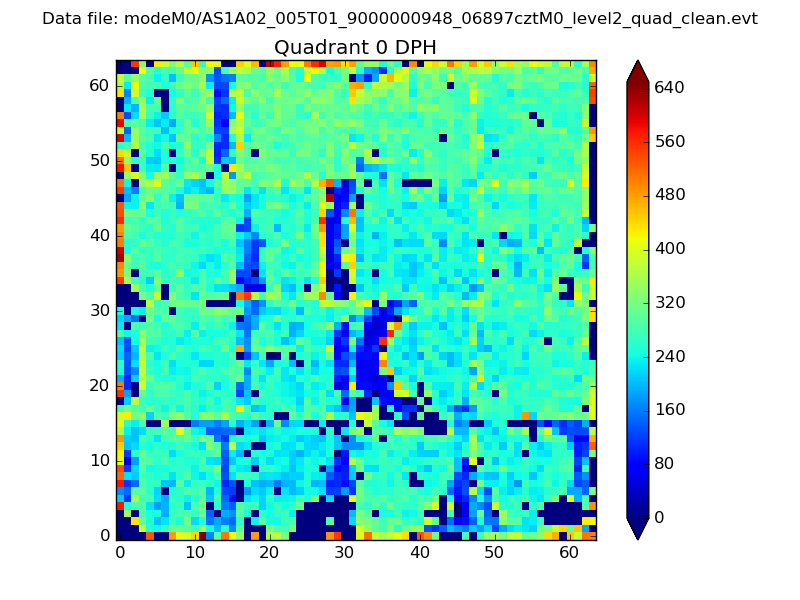 |
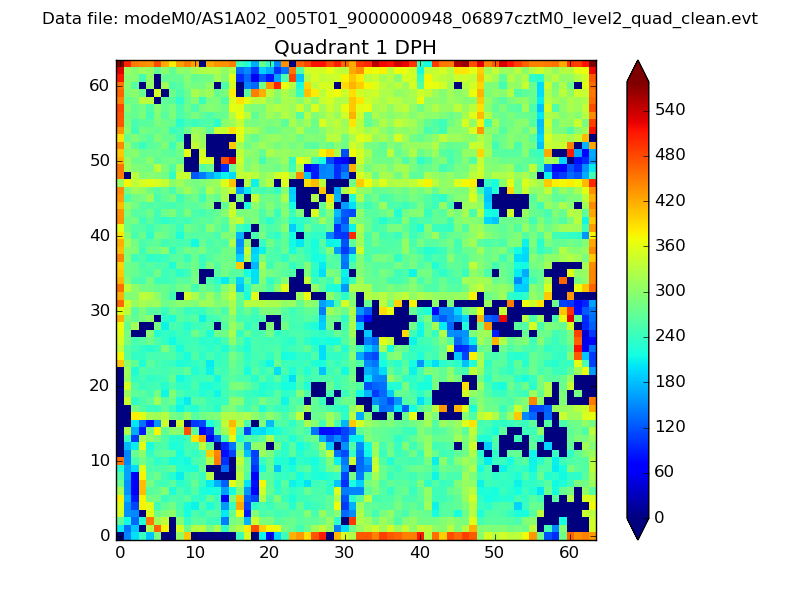 |
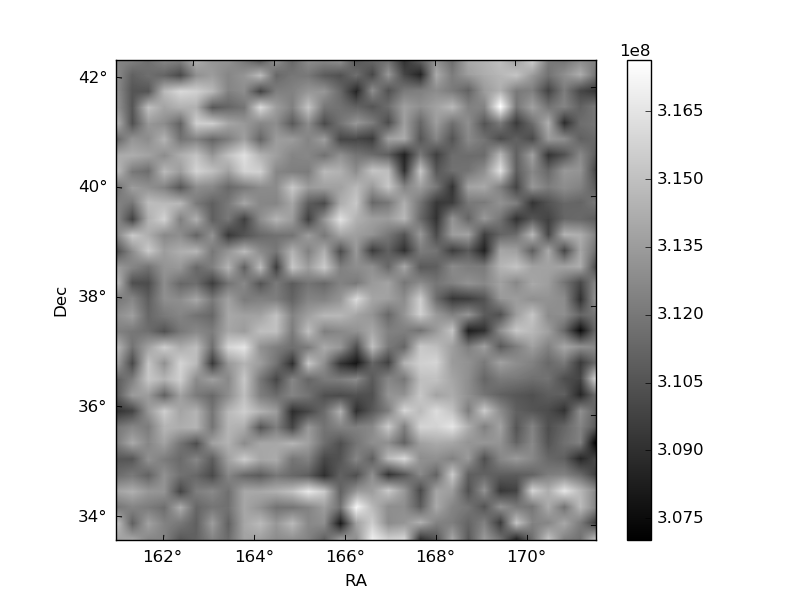
Quadrant B |
|---|---|---|---|
| Quadrant D | 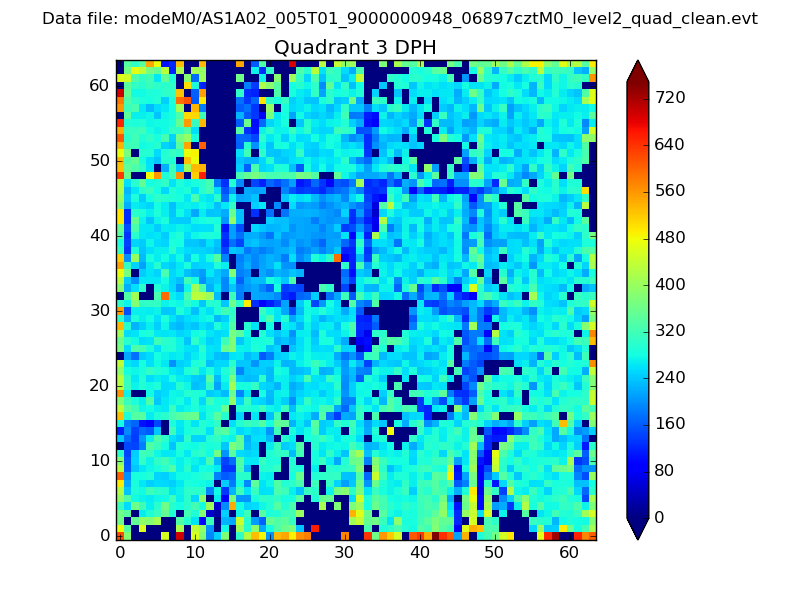 |
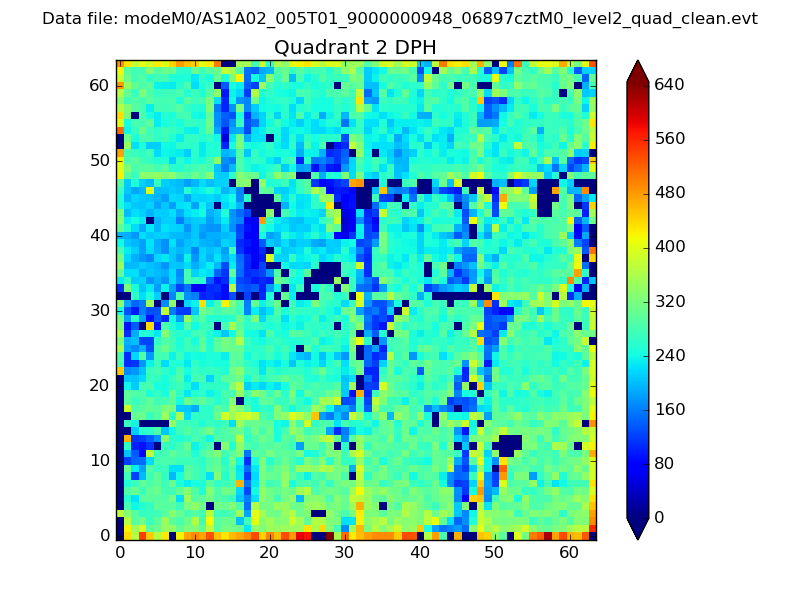 |
Quadrant C |
| Plot type | Count rate plots | Images |
|---|---|---|
| Comparison with Poisson distribution Blue bars denote a histogram of data divided into 1 sec bins. Red curve is a Poisson curve with rate = median count rate of data. |
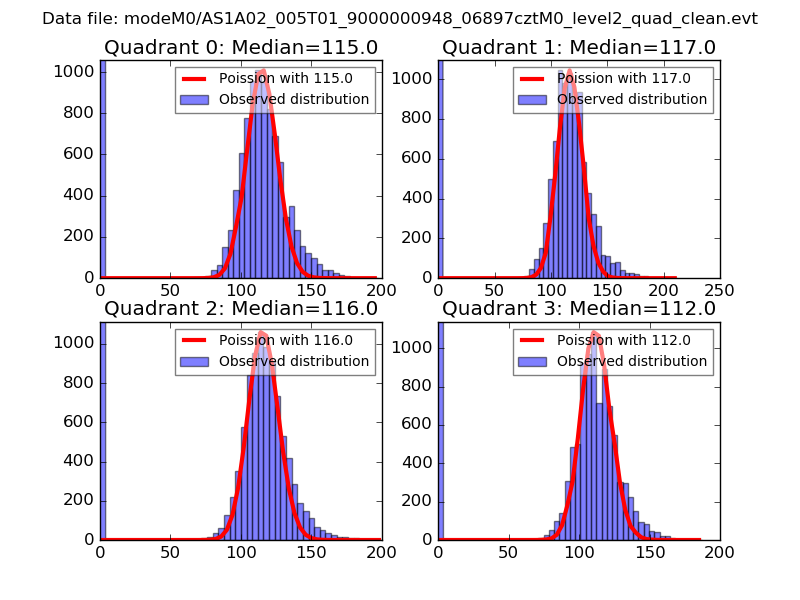 |
 |
| Quadrant-wise count rates Data is divided into 100 sec bins |
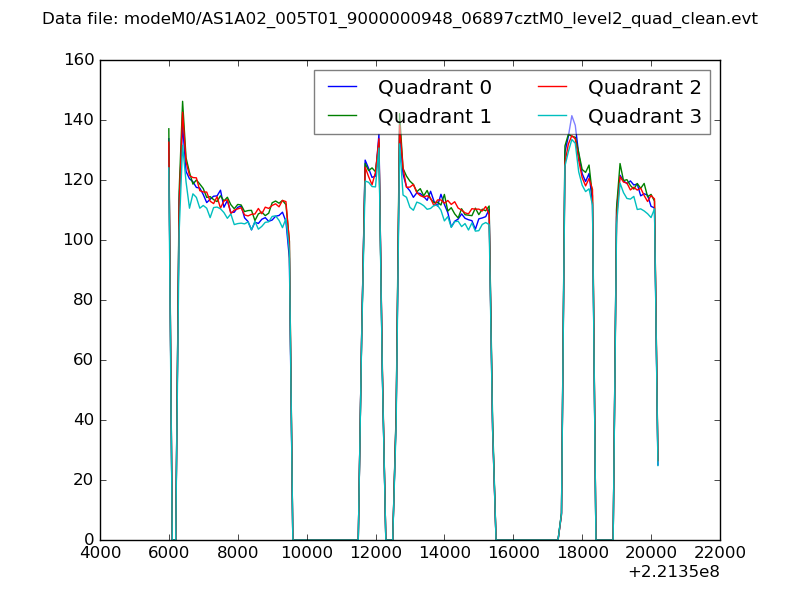 |
|
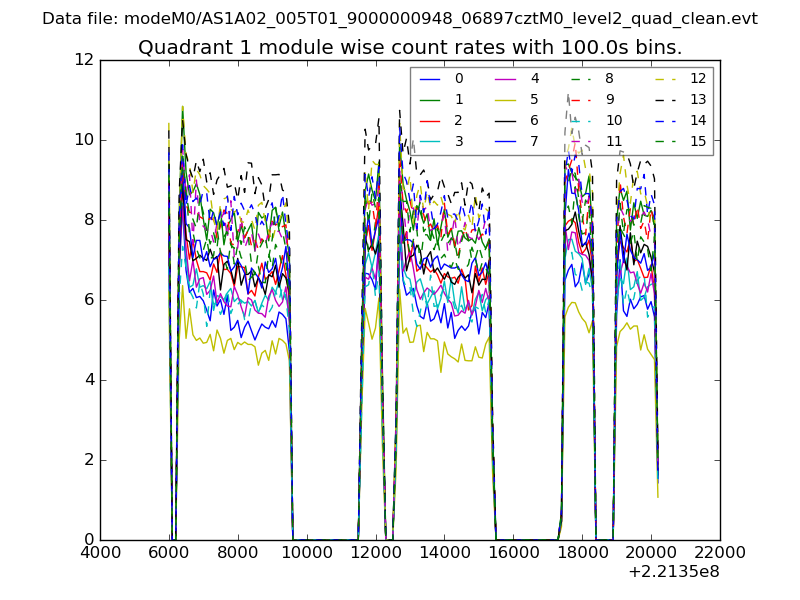
| Module-wise count rates for Quadrant A Data is divided into 100 sec bins |
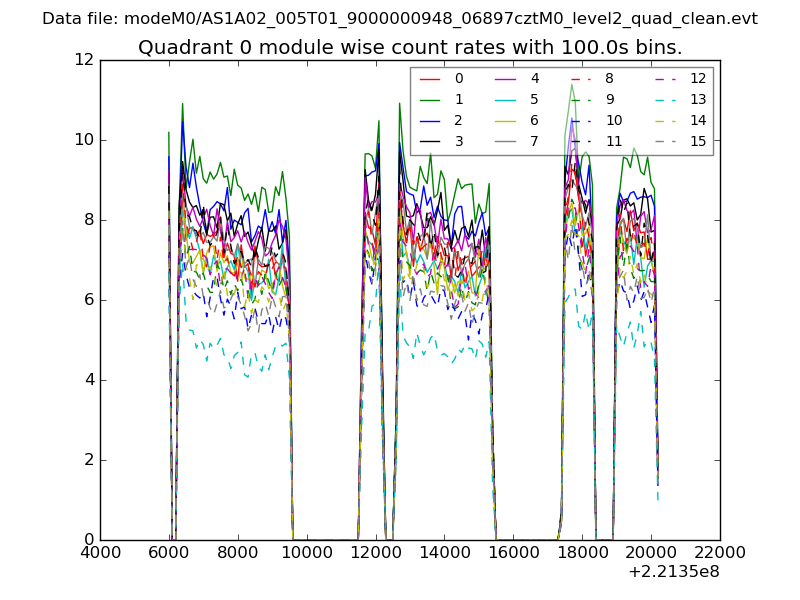 |
 |
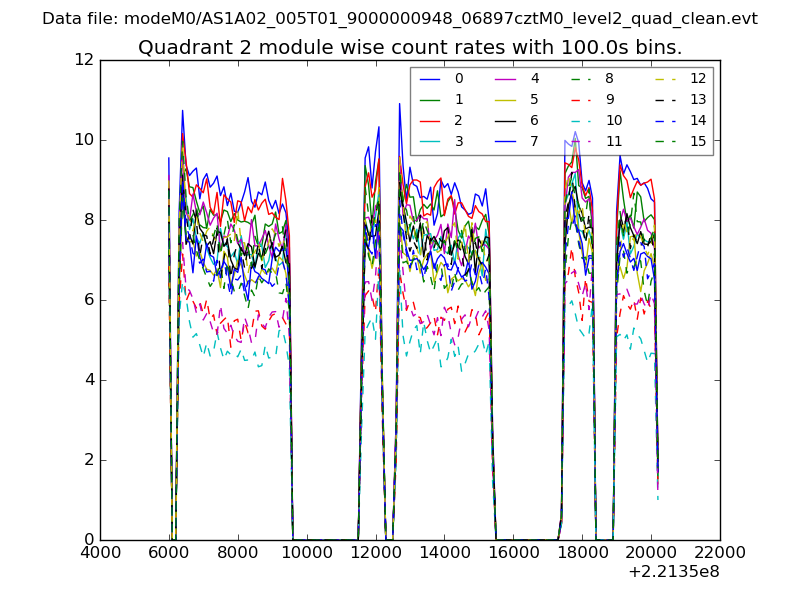
| Module-wise count rates for Quadrant B Data is divided into 100 sec bins |
 |
 |
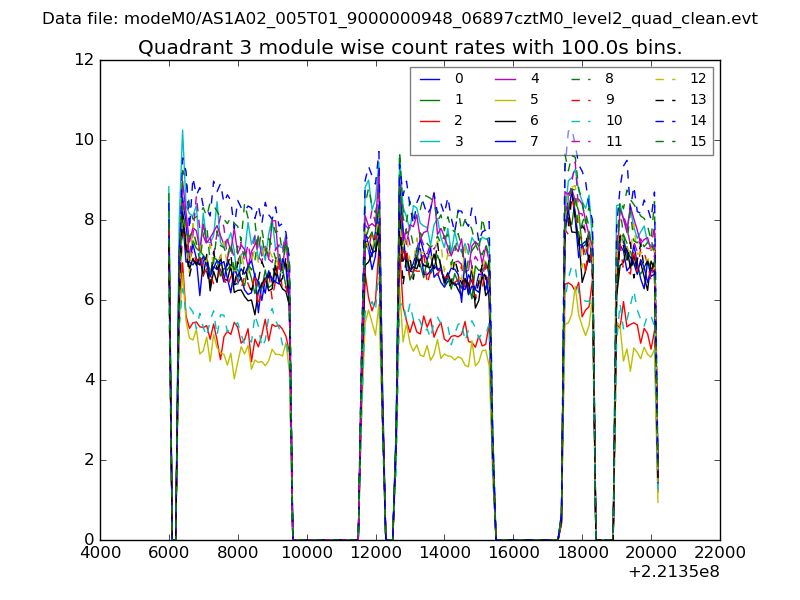
| Module-wise count rates for Quadrant C Data is divided into 100 sec bins |
 |
 |
| Module-wise count rates for Quadrant D Data is divided into 100 sec bins |
 |
 |
| Parameter | Plot |
|---|---|
| CZT HV Monitor | 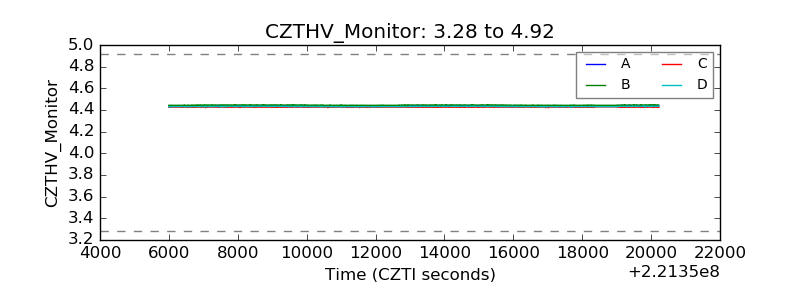 |
| D_VDD | 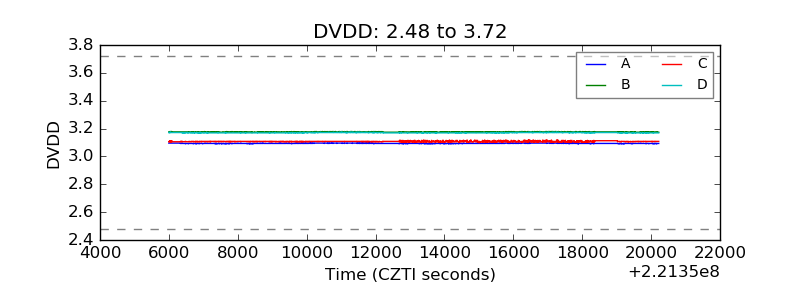 |
| Temperature 1 | 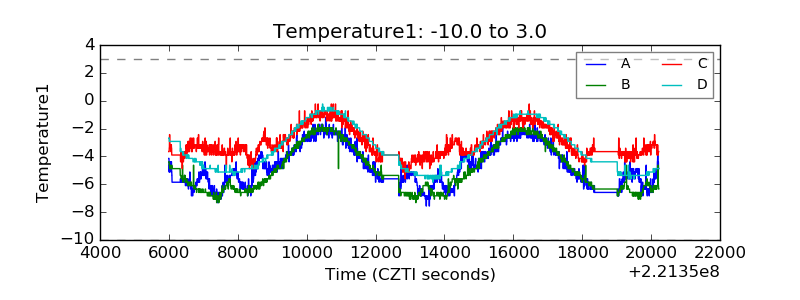 |
| Veto HV Monitor | 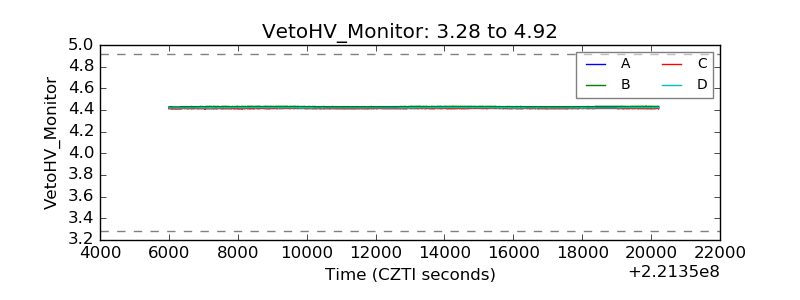 |
| Veto LLD | 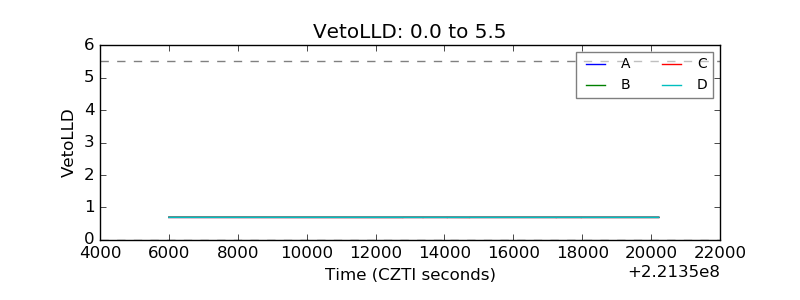 |
| Alpha Counter | 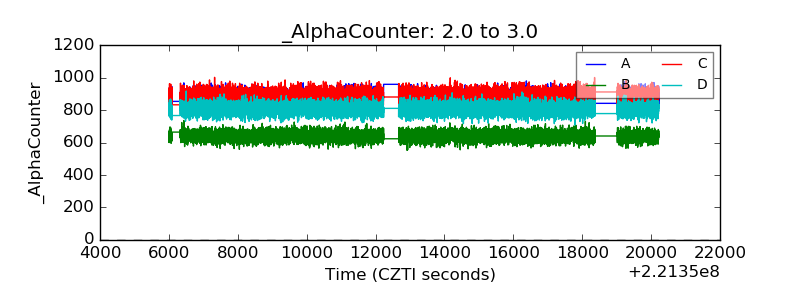 |
| _CPM_Rate | 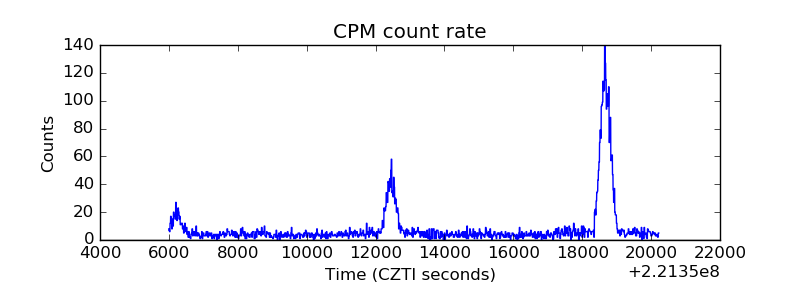 |
| CZT Counter | 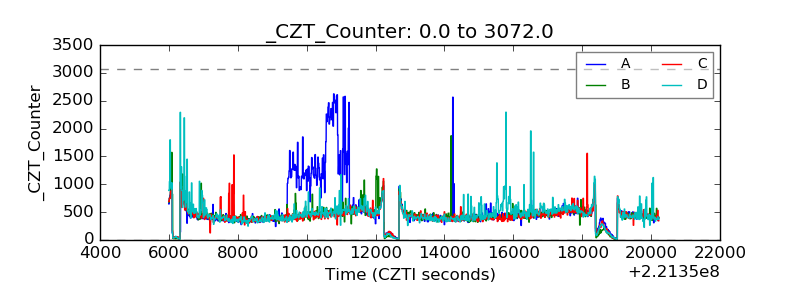 |
| +2.5 Volts monitor | 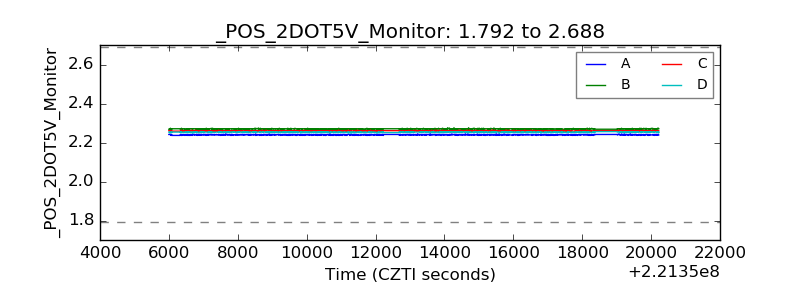 |
| +5 Volts monitor | 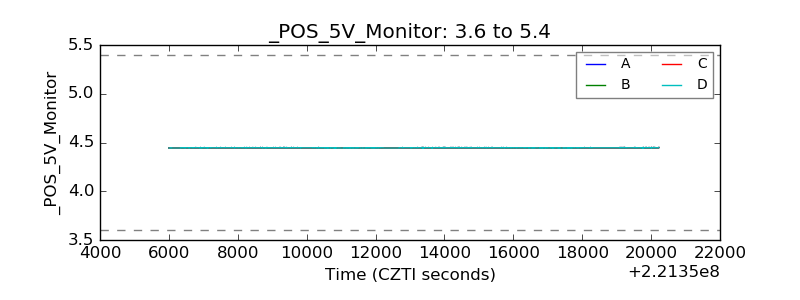 |
| _ROLL_ROT | 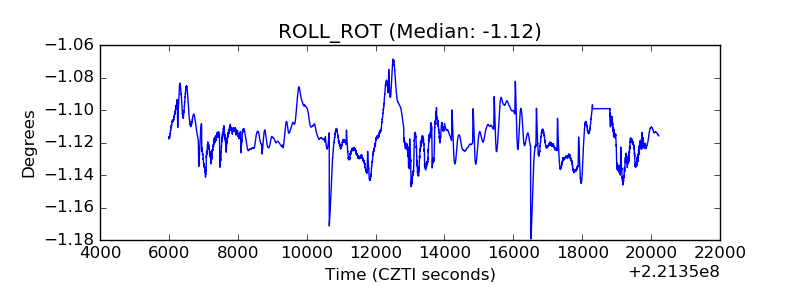 |
| _Roll_DEC | 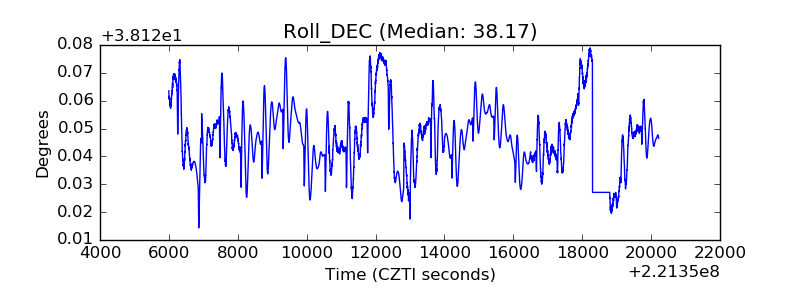 |
| _Roll_RA | 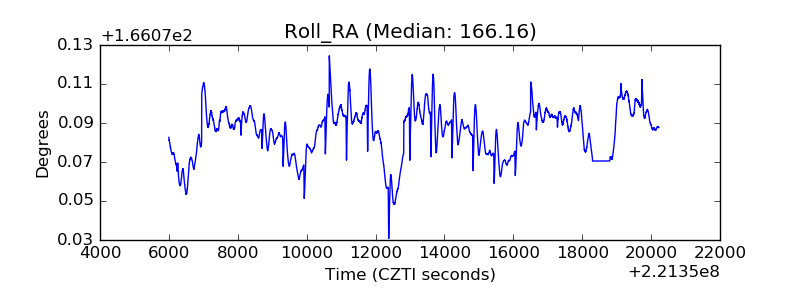 |
| Veto Counter | 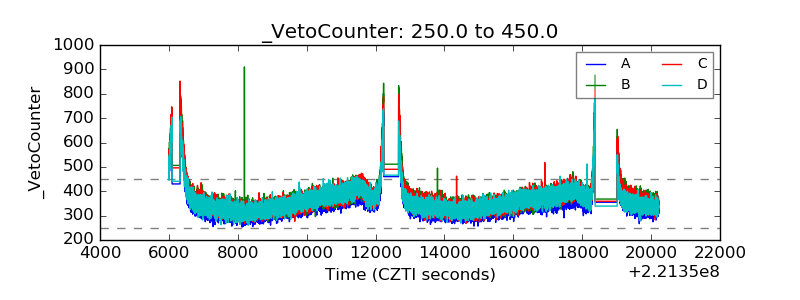 |