| Param | Original file | Final file |
|---|---|---|
| Filename | modeM0/AS1A02_005T01_9000000948_06898cztM0_level2.evt | modeM0/AS1A02_005T01_9000000948_06898cztM0_level2_quad_clean.evt |
| Size (bytes) | 458,069,760 | 93,409,920 |
| Size | 436.8 MB | 89.1 MB |
| Events in quadrant A | 3,537,654 | 586,539 |
| Events in quadrant B | 3,179,058 | 596,947 |
| Events in quadrant C | 3,093,469 | 589,630 |
| Events in quadrant D | 3,585,730 | 567,092 |
| Mode SS | |||
|---|---|---|---|
| Quadrant | BADHDUFLAG | Total packets | Discarded packets |
| A | 0 | 140 | 0 |
| B | 0 | 140 | 0 |
| C | 0 | 140 | 0 |
| D | 0 | 140 | 0 |
| Mode M0 | |||
|---|---|---|---|
| Quadrant | BADHDUFLAG | Total packets | Discarded packets |
| A | 0 | 15370 | 3 |
| B | 0 | 14244 | 2 |
| C | 0 | 14244 | 2 |
| D | 0 | 15611 | 2 |
| Mode M9 | |||
|---|---|---|---|
| Quadrant | BADHDUFLAG | Total packets | Discarded packets |
| A | 0 | 9 | 0 |
| B | 0 | 9 | 0 |
| C | 0 | 9 | 0 |
| D | 0 | 10 | 0 |
| Quadrant | Total seconds | Saturated seconds | Saturation percentage |
|---|---|---|---|
| A | 7023 | 41 | 0.583796% |
| B | 7023 | 12 | 0.170867% |
| C | 7023 | 18 | 0.256301% |
| D | 7023 | 74 | 1.053681% |
Noise dominated data is calculated using 1-second bins in cleaned event files. If a bin has >2000 counts, and if more than 50% of those come from <1% of pixels, then it is considered to be noise-dominated and hence unusable.
| Quadrant | # 1 sec bins | Bins with >0 counts | Bins with >2000 counts | High rate bins dominated by noise | Noise dominated (total time) | Noise dominated (detector-on time) | Marked lightcurve |
|---|---|---|---|---|---|---|---|
| A | 7873 | 7024 | 8 | 8 | 0.10% | 0.11% | 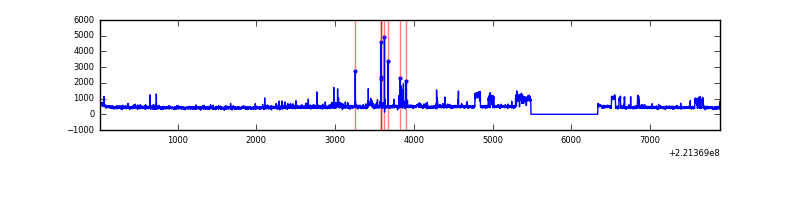 |
| B | 7873 | 7024 | 1 | 1 | 0.01% | 0.01% | 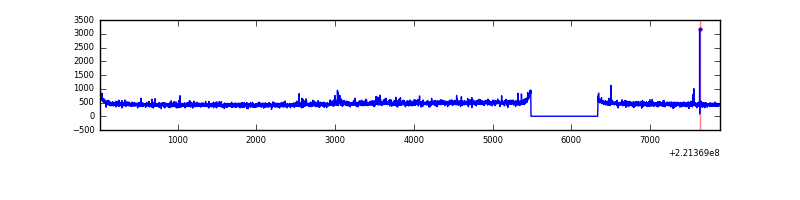 |
| C | 7873 | 7024 | 0 | 0 | 0.00% | 0.00% | 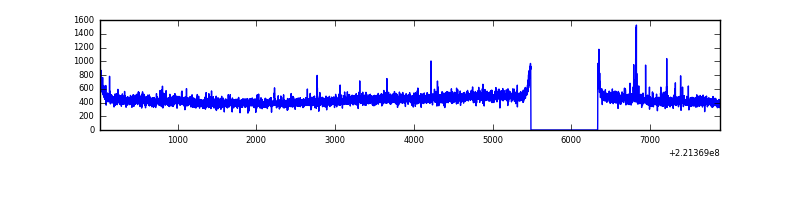 |
| D | 7873 | 7024 | 50 | 50 | 0.64% | 0.71% | 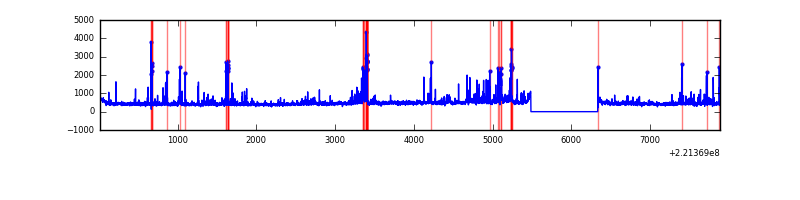 |
Top three noisy pixels from each quadrant. If the there are fewer than three noisy pixels in the level2.evt file, extra rows are filled as -1
| Pixel properties | Quadrant properties | ||||||
|---|---|---|---|---|---|---|---|
| Quadrant | DetID | PixID | Counts | Sigma | Mean | Median | Sigma |
| A | 0 | 23 | 318061 | 1945.17 | 795 | 777 | 163.1 |
| A | 13 | 248 | 107594 | 654.86 | 795 | 777 | 163.1 |
| A | 0 | 226 | 29475 | 175.94 | 795 | 777 | 163.1 |
| B | 4 | 81 | 26476 | 166.32 | 802 | 780 | 154.5 |
| B | 15 | 204 | 23647 | 148.01 | 802 | 780 | 154.5 |
| B | 12 | 111 | 15782 | 97.1 | 802 | 780 | 154.5 |
| C | 9 | 247 | 62702 | 346.26 | 767 | 770 | 178.9 |
| C | 9 | 54 | 23258 | 125.73 | 767 | 770 | 178.9 |
| C | 13 | 61 | 5805 | 28.15 | 767 | 770 | 178.9 |
| D | 2 | 216 | 386861 | 2056.14 | 765 | 742 | 187.8 |
| D | 8 | 195 | 100727 | 532.44 | 765 | 742 | 187.8 |
| D | 2 | 14 | 71567 | 377.15 | 765 | 742 | 187.8 |
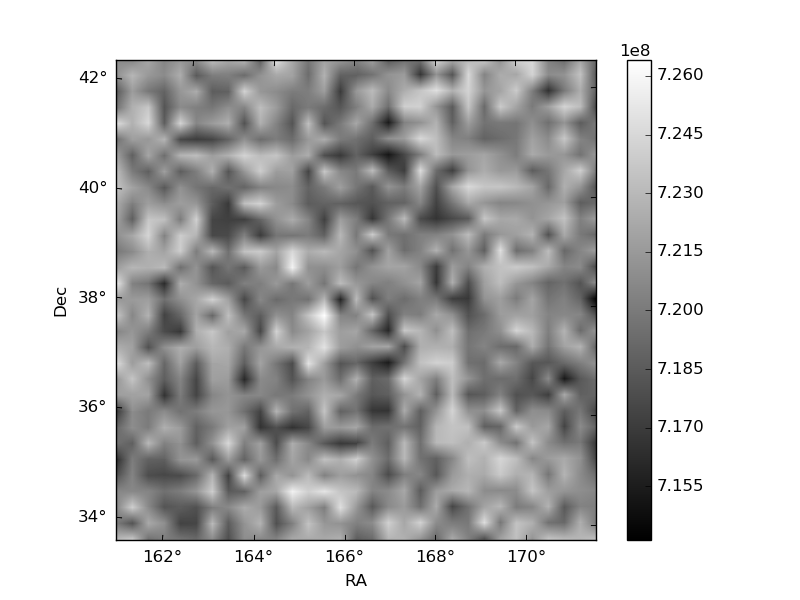
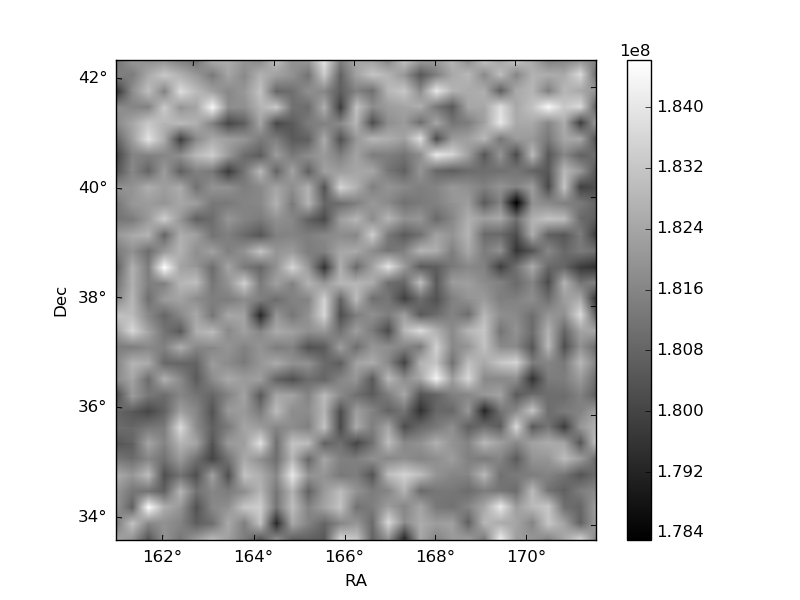
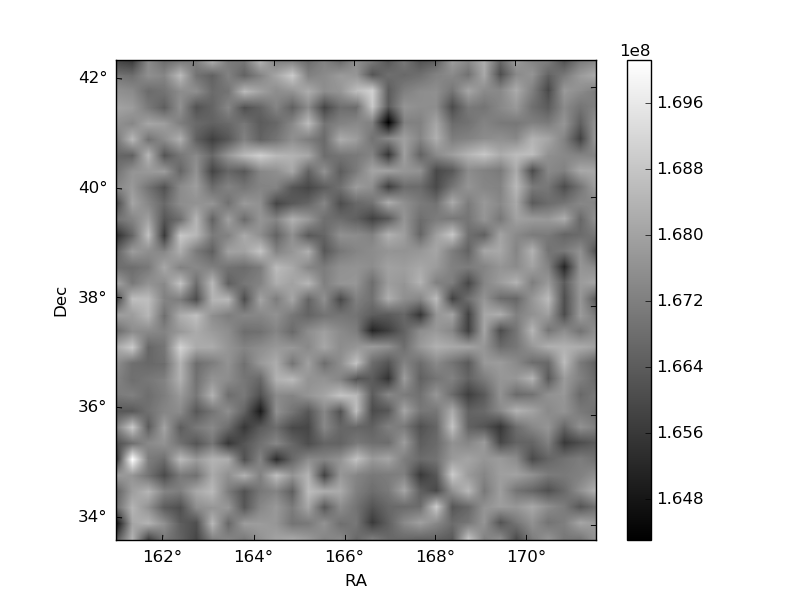
Histogram calculated using DETX and DETY for each event in the final _common_clean file
| Quadrant A | 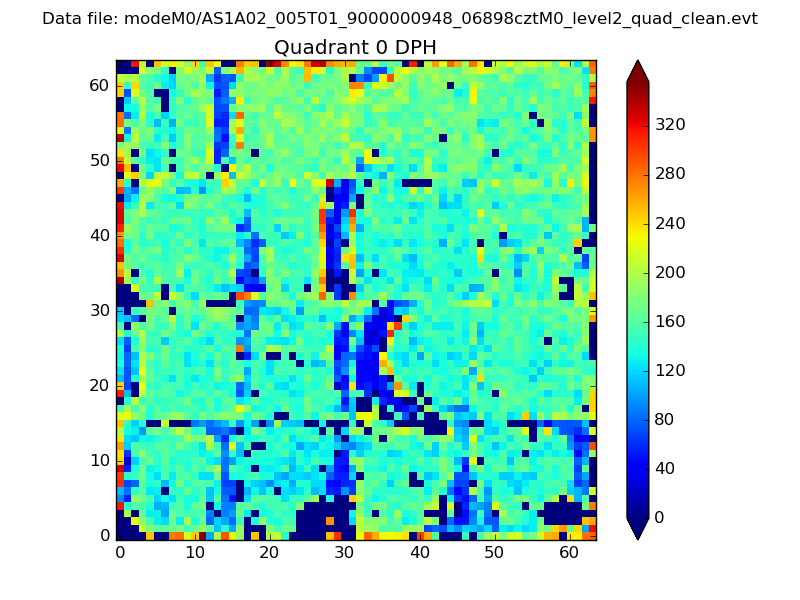 |
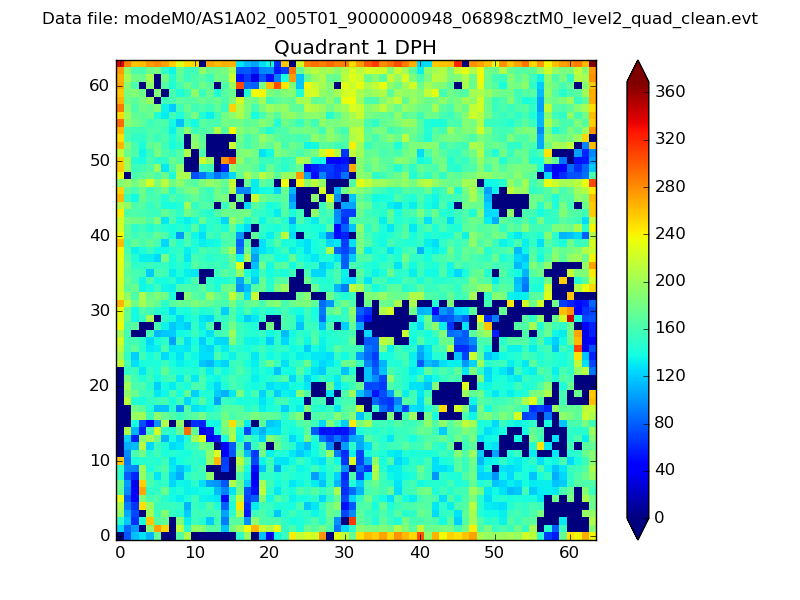 |
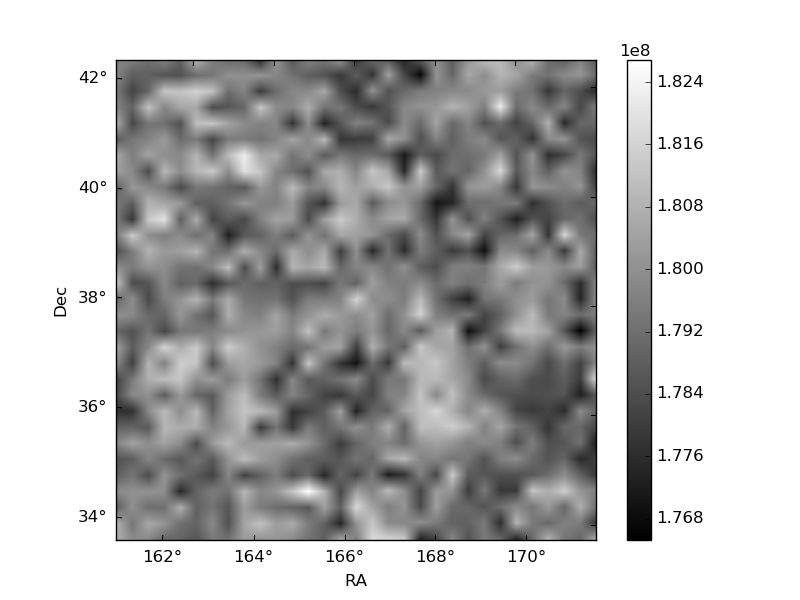
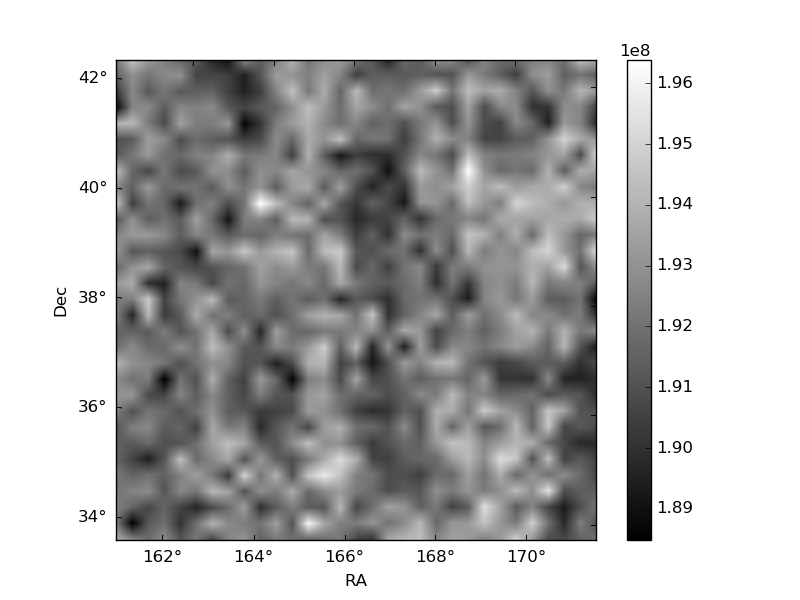
Quadrant B |
|---|---|---|---|
| Quadrant D | 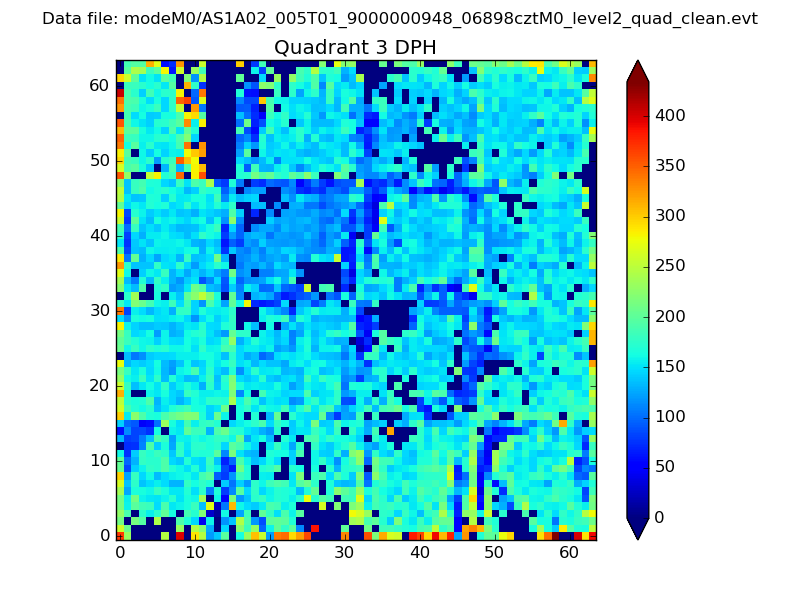 |
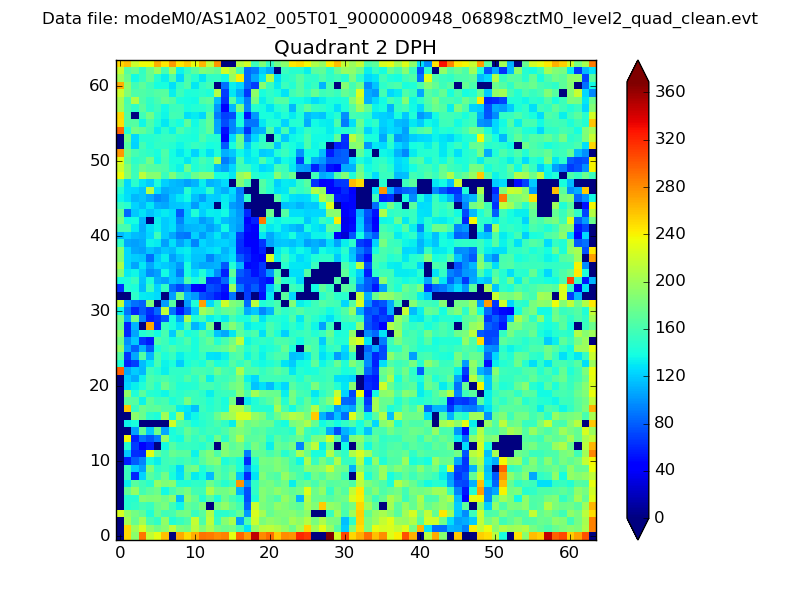 |
Quadrant C |
| Plot type | Count rate plots | Images |
|---|---|---|
| Comparison with Poisson distribution Blue bars denote a histogram of data divided into 1 sec bins. Red curve is a Poisson curve with rate = median count rate of data. |
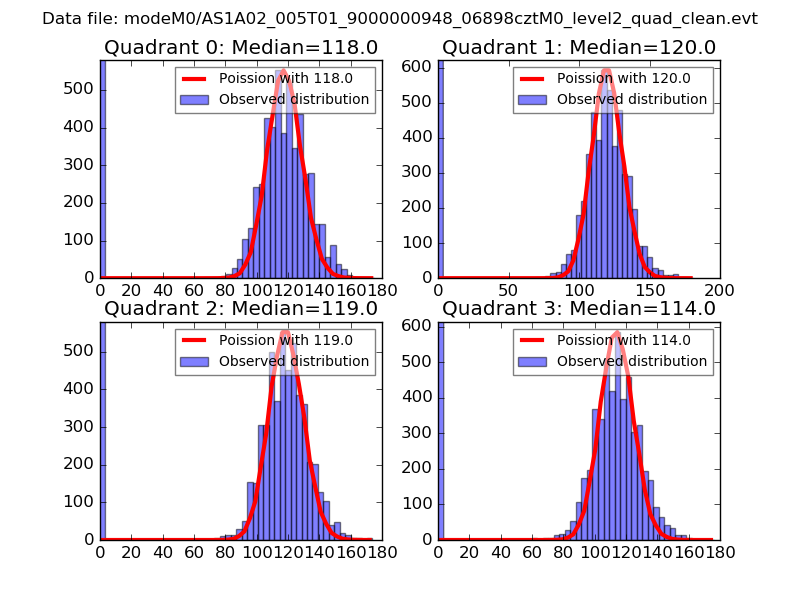 |
 |
| Quadrant-wise count rates Data is divided into 100 sec bins |
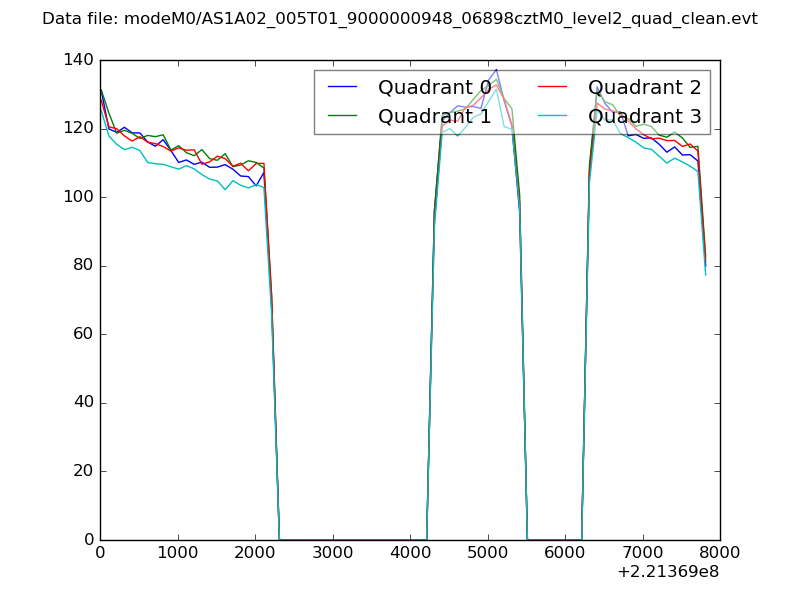 |
|
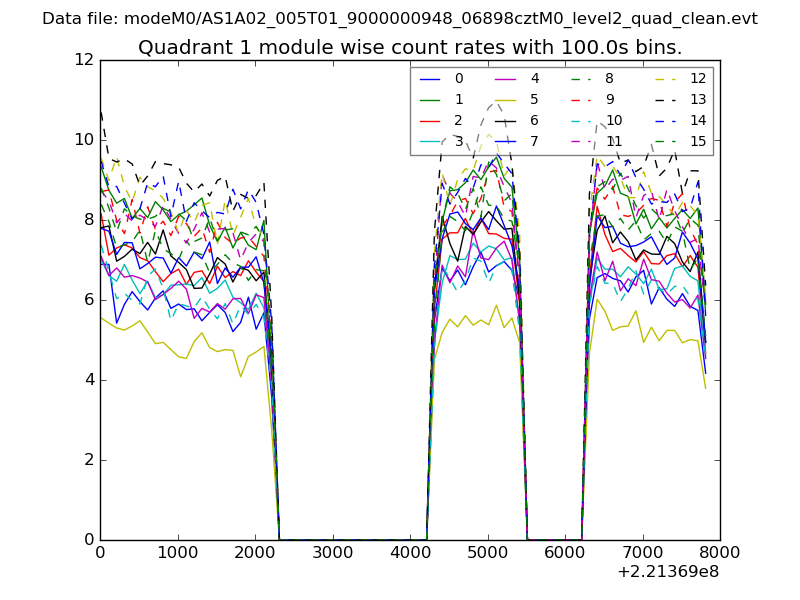
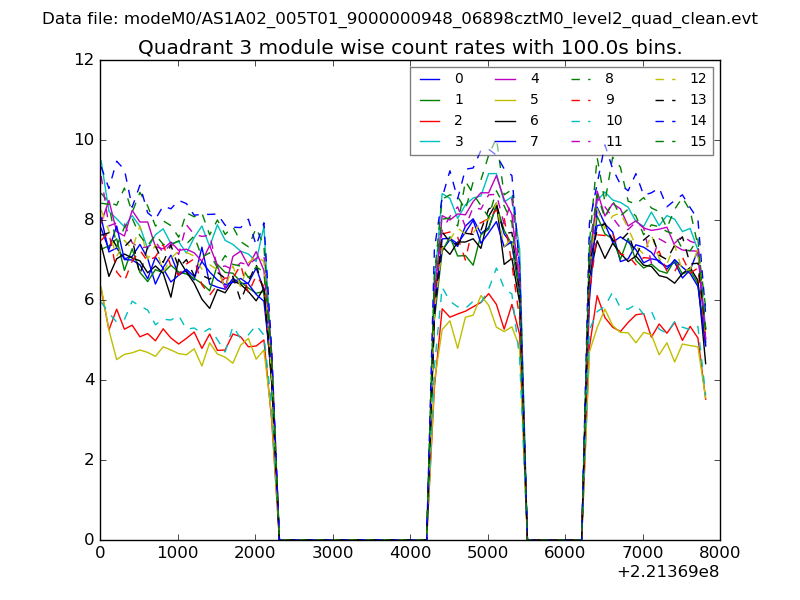
| Module-wise count rates for Quadrant A Data is divided into 100 sec bins |
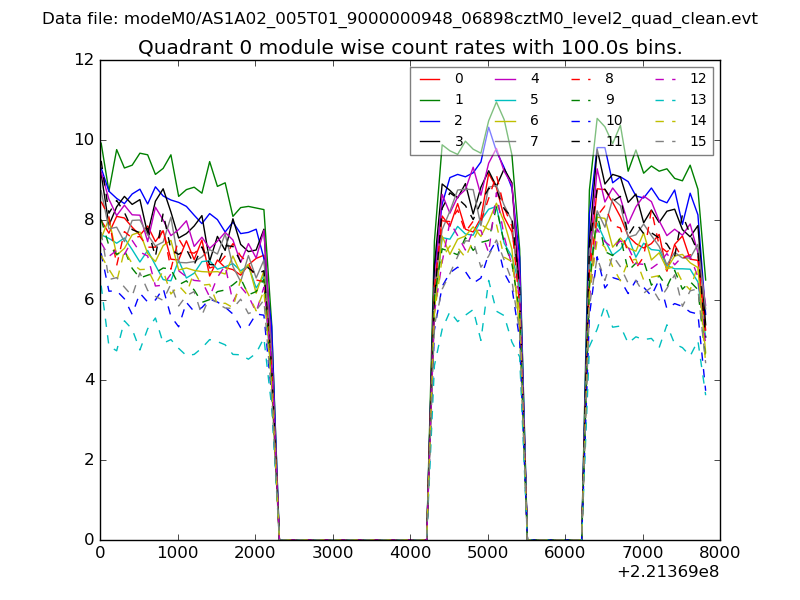 |
 |
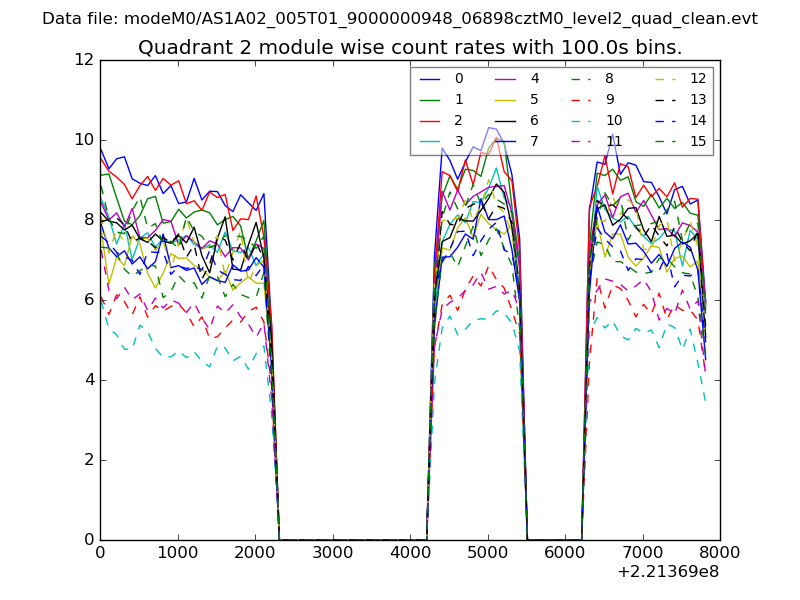
| Module-wise count rates for Quadrant B Data is divided into 100 sec bins |
 |
 |
| Module-wise count rates for Quadrant C Data is divided into 100 sec bins |
 |
 |
| Module-wise count rates for Quadrant D Data is divided into 100 sec bins |
 |
 |
| Parameter | Plot |
|---|---|
| CZT HV Monitor | 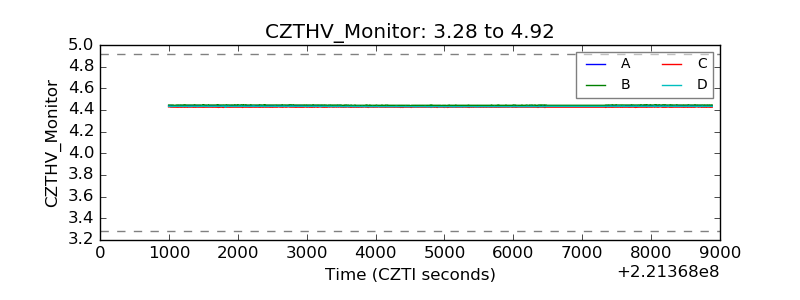 |
| D_VDD | 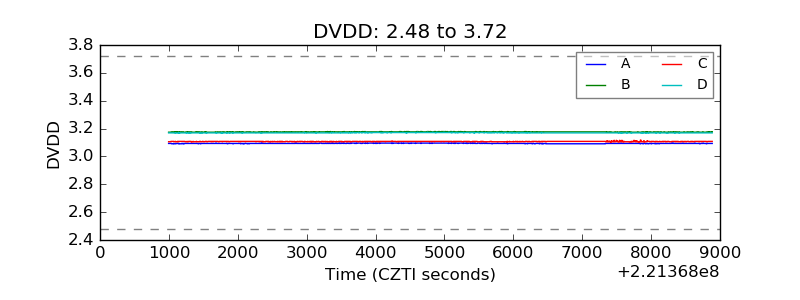 |
| Temperature 1 | 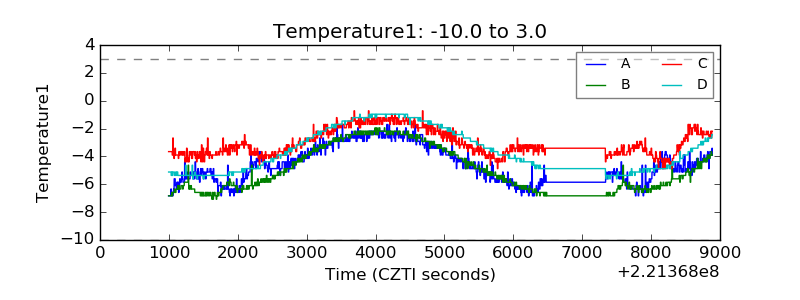 |
| Veto HV Monitor | 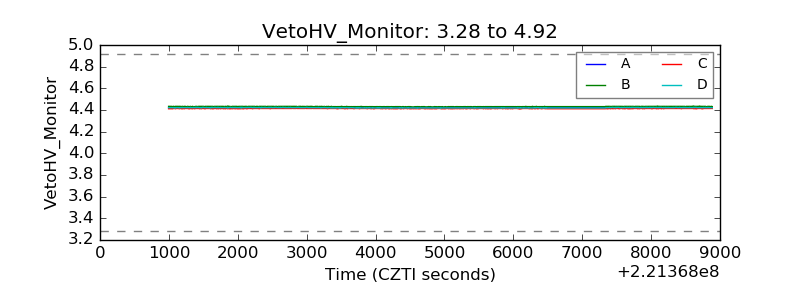 |
| Veto LLD | 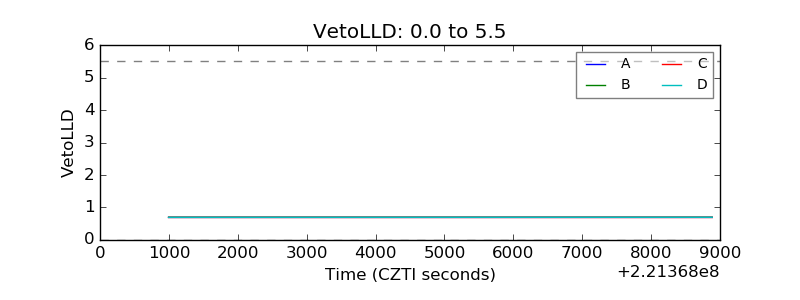 |
| Alpha Counter | 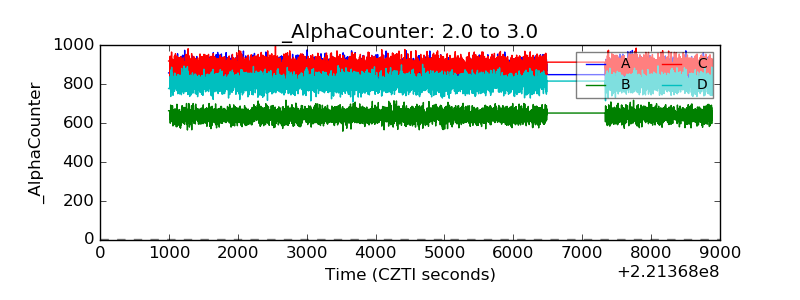 |
| _CPM_Rate | 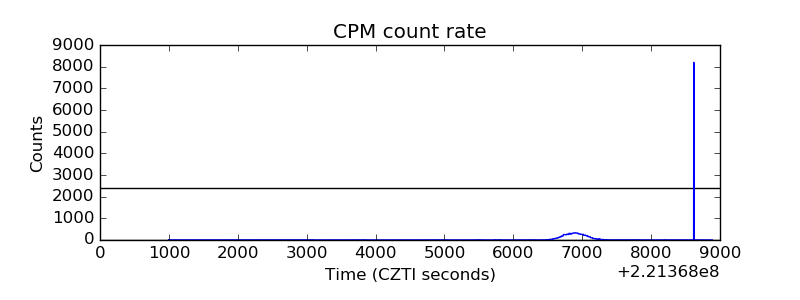 |
| CZT Counter | 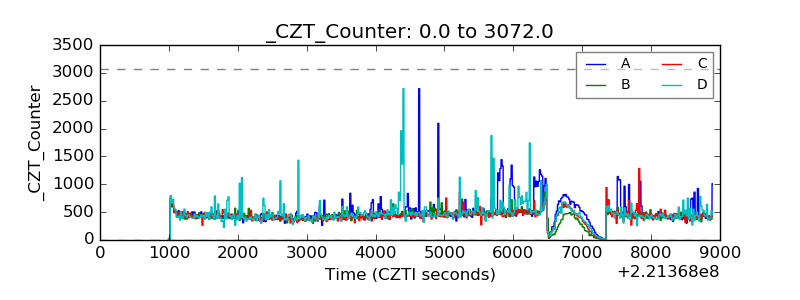 |
| +2.5 Volts monitor | 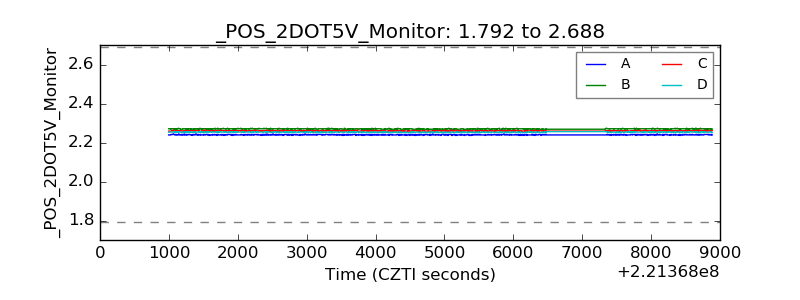 |
| +5 Volts monitor | 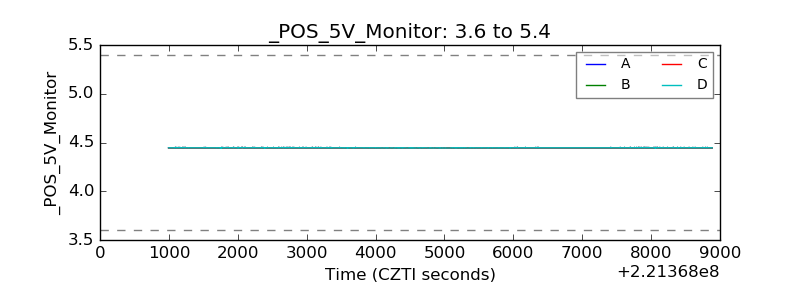 |
| _ROLL_ROT | 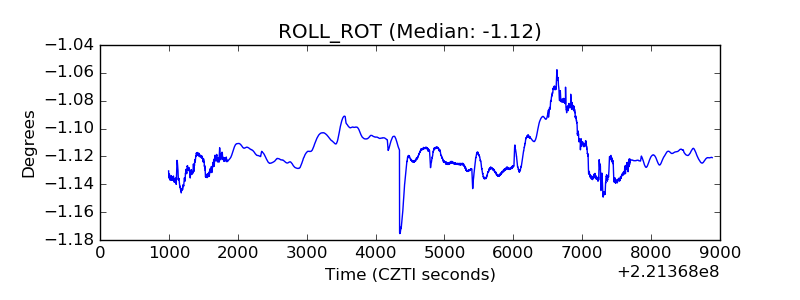 |
| _Roll_DEC | 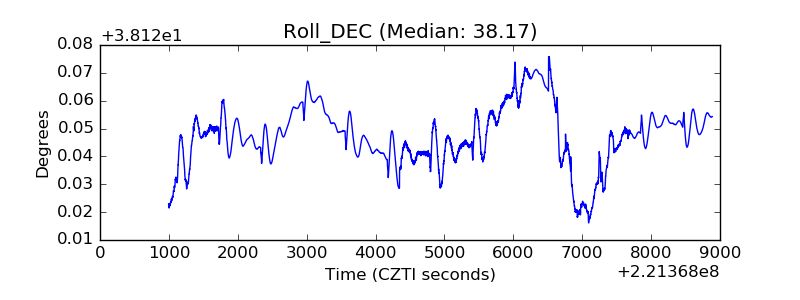 |
| _Roll_RA | 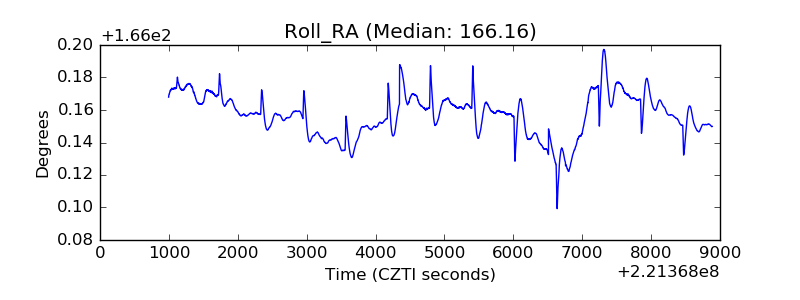 |
| Veto Counter | 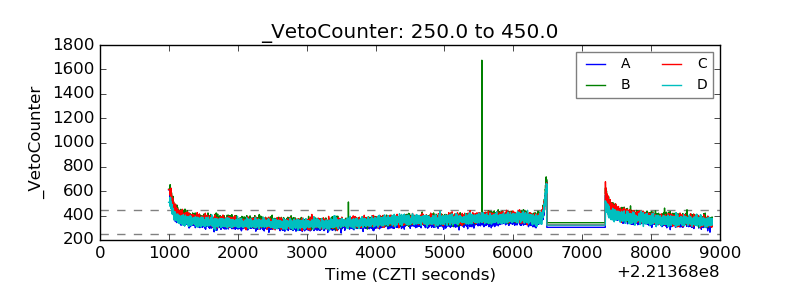 |