| Param | Original file | Final file |
|---|---|---|
| Filename | modeM0/AS1A02_005T01_9000000948_06902cztM0_level2.evt | modeM0/AS1A02_005T01_9000000948_06902cztM0_level2_quad_clean.evt |
| Size (bytes) | 465,963,840 | 79,214,400 |
| Size | 444.4 MB | 75.5 MB |
| Events in quadrant A | 3,314,058 | 487,603 |
| Events in quadrant B | 3,487,580 | 492,739 |
| Events in quadrant C | 3,292,956 | 484,651 |
| Events in quadrant D | 3,563,659 | 468,165 |
| Mode SS | |||
|---|---|---|---|
| Quadrant | BADHDUFLAG | Total packets | Discarded packets |
| A | 0 | 136 | 0 |
| B | 0 | 136 | 0 |
| C | 0 | 136 | 0 |
| D | 0 | 136 | 0 |
| Mode M0 | |||
|---|---|---|---|
| Quadrant | BADHDUFLAG | Total packets | Discarded packets |
| A | 0 | 14023 | 3 |
| B | 0 | 14593 | 2 |
| C | 0 | 13966 | 2 |
| D | 0 | 14950 | 2 |
| Mode M9 | |||
|---|---|---|---|
| Quadrant | BADHDUFLAG | Total packets | Discarded packets |
| A | 0 | 12 | 0 |
| B | 0 | 12 | 0 |
| C | 0 | 12 | 0 |
| D | 0 | 13 | 0 |
| Quadrant | Total seconds | Saturated seconds | Saturation percentage |
|---|---|---|---|
| A | 6675 | 79 | 1.183521% |
| B | 6675 | 70 | 1.048689% |
| C | 6675 | 61 | 0.913858% |
| D | 6675 | 106 | 1.588015% |
Noise dominated data is calculated using 1-second bins in cleaned event files. If a bin has >2000 counts, and if more than 50% of those come from <1% of pixels, then it is considered to be noise-dominated and hence unusable.
| Quadrant | # 1 sec bins | Bins with >0 counts | Bins with >2000 counts | High rate bins dominated by noise | Noise dominated (total time) | Noise dominated (detector-on time) | Marked lightcurve |
|---|---|---|---|---|---|---|---|
| A | 7890 | 6676 | 0 | 0 | 0.00% | 0.00% | 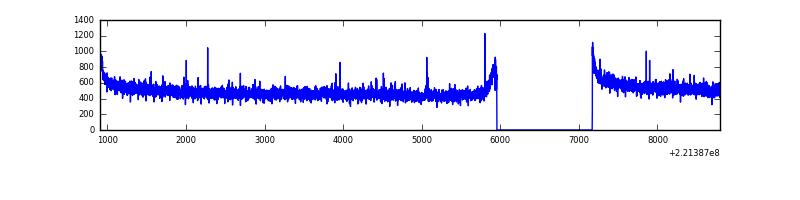 |
| B | 7890 | 6676 | 0 | 0 | 0.00% | 0.00% | 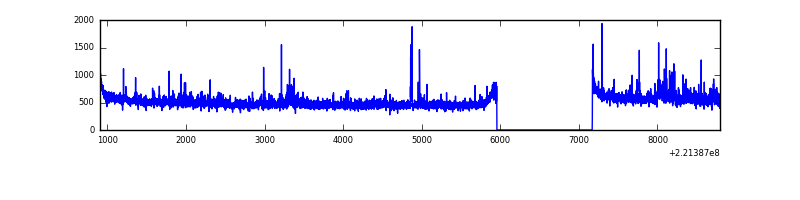 |
| C | 7890 | 6676 | 4 | 4 | 0.05% | 0.06% | 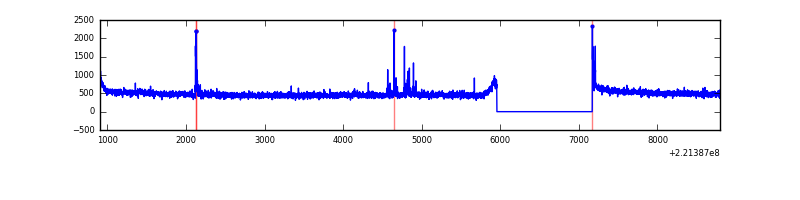 |
| D | 7890 | 6676 | 31 | 31 | 0.39% | 0.46% | 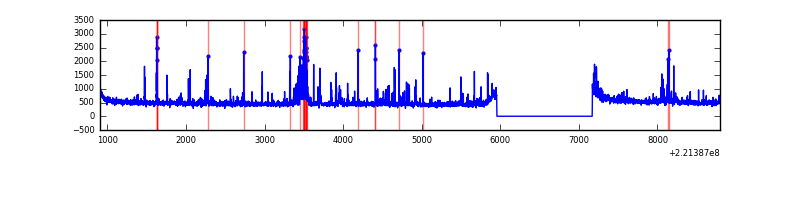 |
Top three noisy pixels from each quadrant. If the there are fewer than three noisy pixels in the level2.evt file, extra rows are filled as -1
| Pixel properties | Quadrant properties | ||||||
|---|---|---|---|---|---|---|---|
| Quadrant | DetID | PixID | Counts | Sigma | Mean | Median | Sigma |
| A | 8 | 15 | 30208 | 173.19 | 847 | 830 | 169.6 |
| A | 13 | 14 | 10051 | 54.36 | 847 | 830 | 169.6 |
| A | 0 | 23 | 8884 | 47.48 | 847 | 830 | 169.6 |
| B | 4 | 173 | 48606 | 301.42 | 842 | 823 | 158.5 |
| B | 0 | 214 | 43430 | 268.77 | 842 | 823 | 158.5 |
| B | 0 | 219 | 41233 | 254.91 | 842 | 823 | 158.5 |
| C | 9 | 54 | 69318 | 368.97 | 812 | 818 | 185.6 |
| C | 9 | 247 | 48318 | 255.86 | 812 | 818 | 185.6 |
| C | 13 | 61 | 6528 | 30.75 | 812 | 818 | 185.6 |
| D | 2 | 216 | 316502 | 1584.52 | 819 | 794 | 199.2 |
| D | 5 | 97 | 30085 | 147.01 | 819 | 794 | 199.2 |
| D | 7 | 55 | 28628 | 139.7 | 819 | 794 | 199.2 |
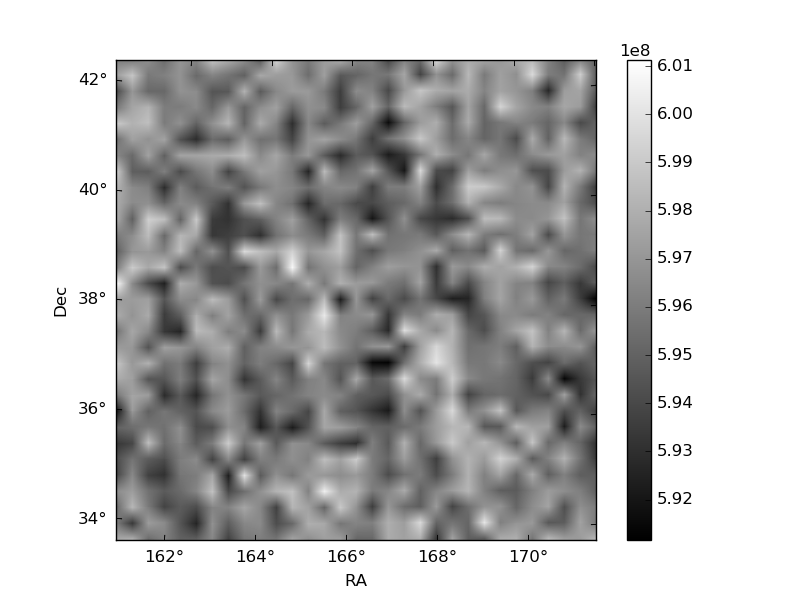
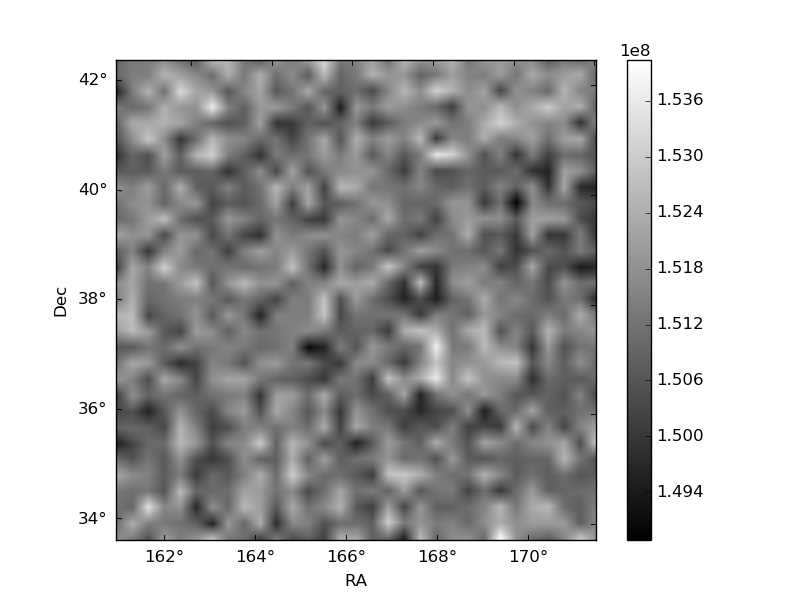
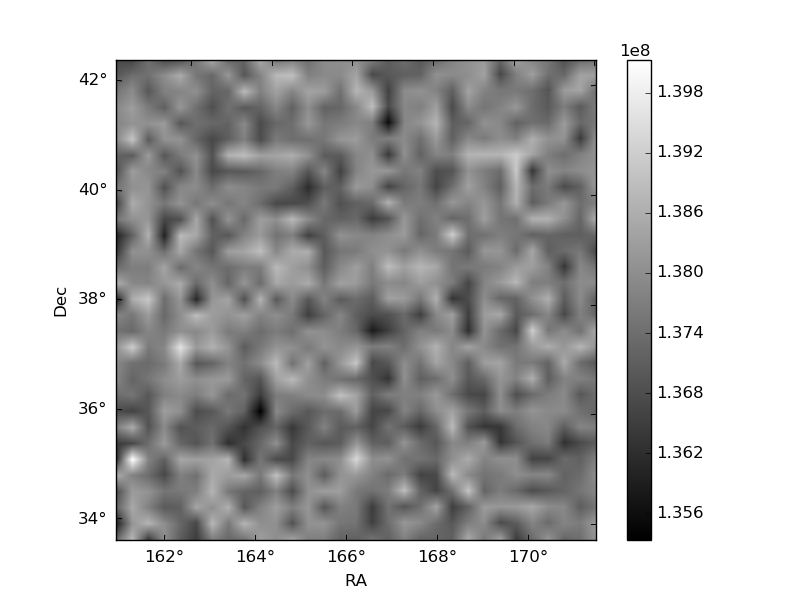
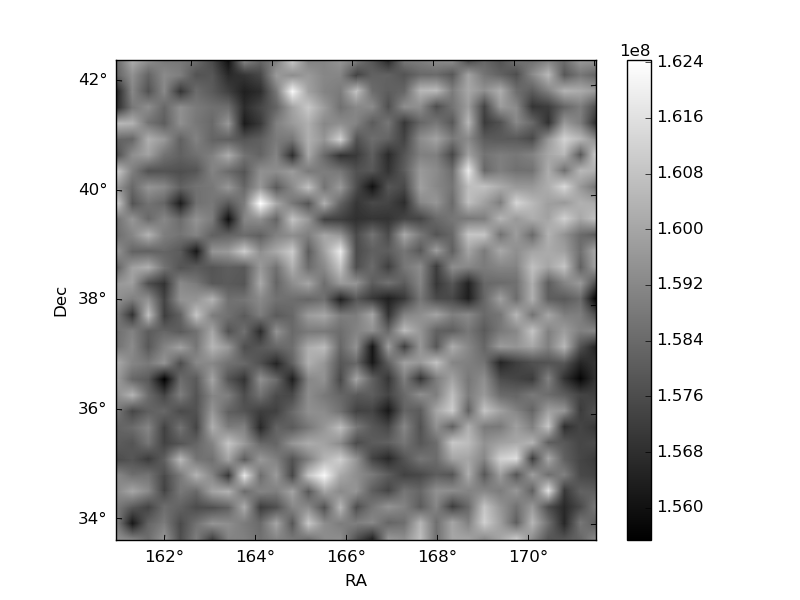
Histogram calculated using DETX and DETY for each event in the final _common_clean file
| Quadrant A | 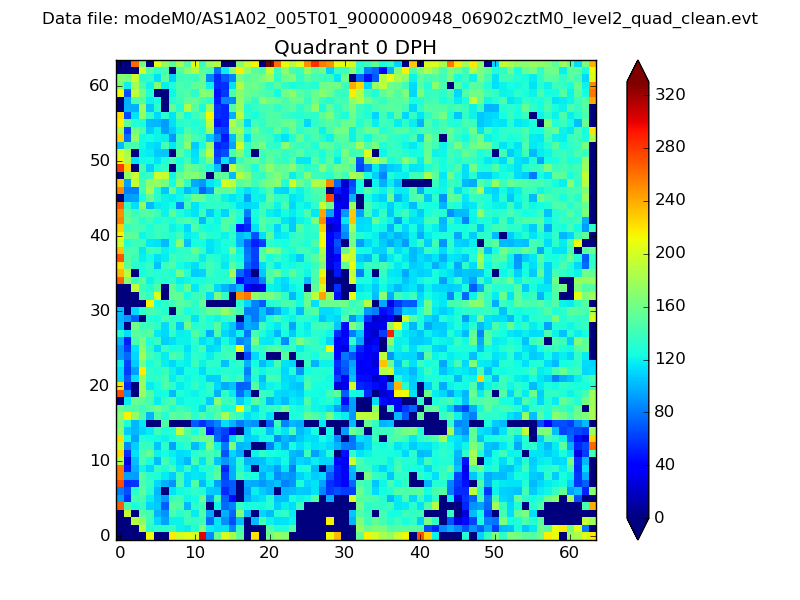 |
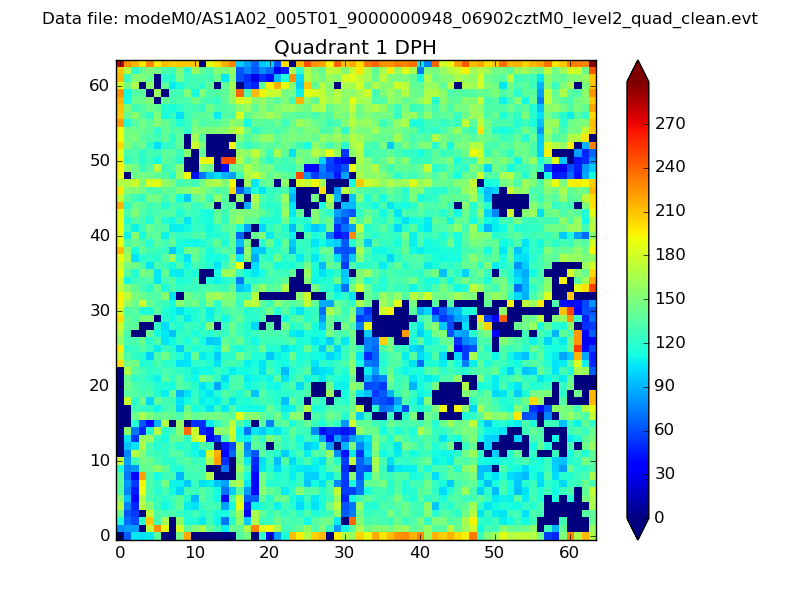 |
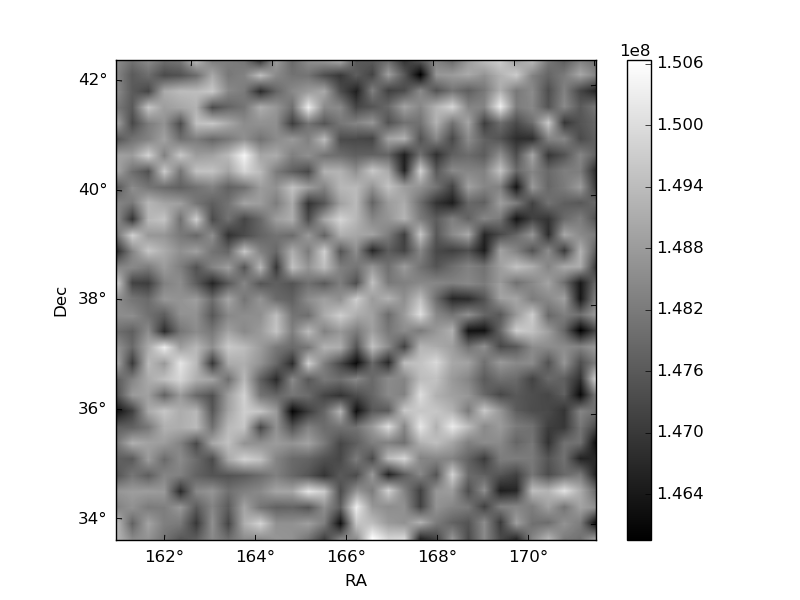
Quadrant B |
|---|---|---|---|
| Quadrant D | 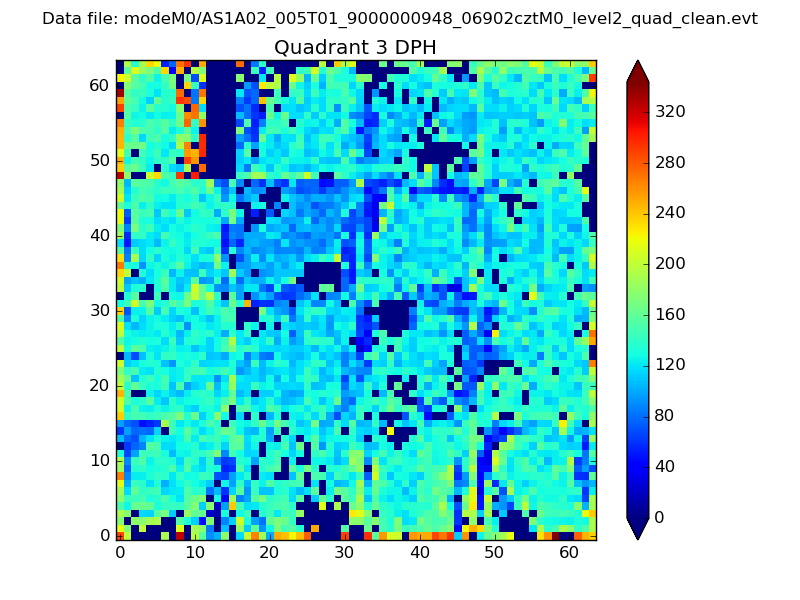 |
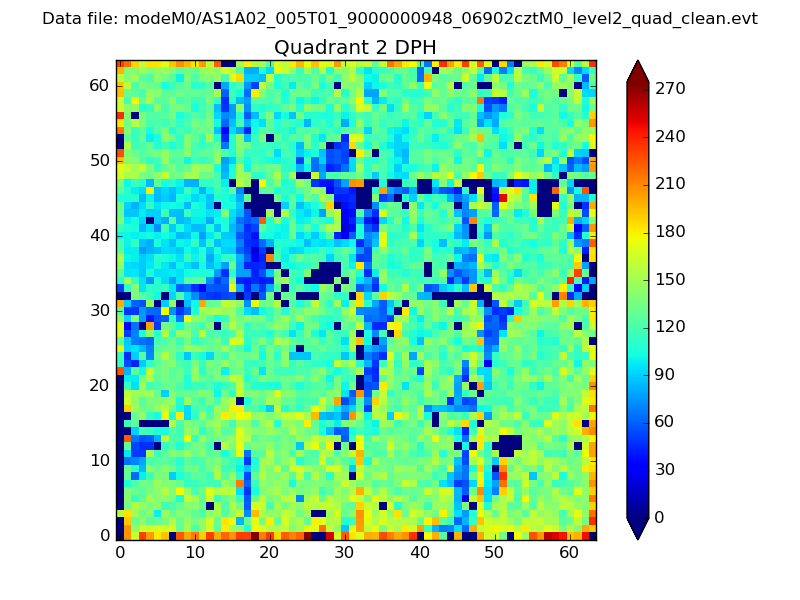 |
Quadrant C |
| Plot type | Count rate plots | Images |
|---|---|---|
| Comparison with Poisson distribution Blue bars denote a histogram of data divided into 1 sec bins. Red curve is a Poisson curve with rate = median count rate of data. |
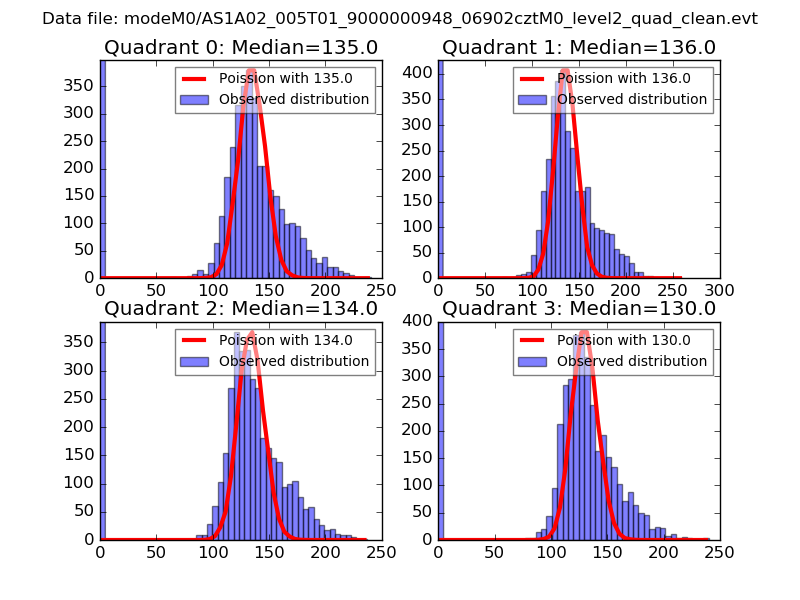 |
 |
| Quadrant-wise count rates Data is divided into 100 sec bins |
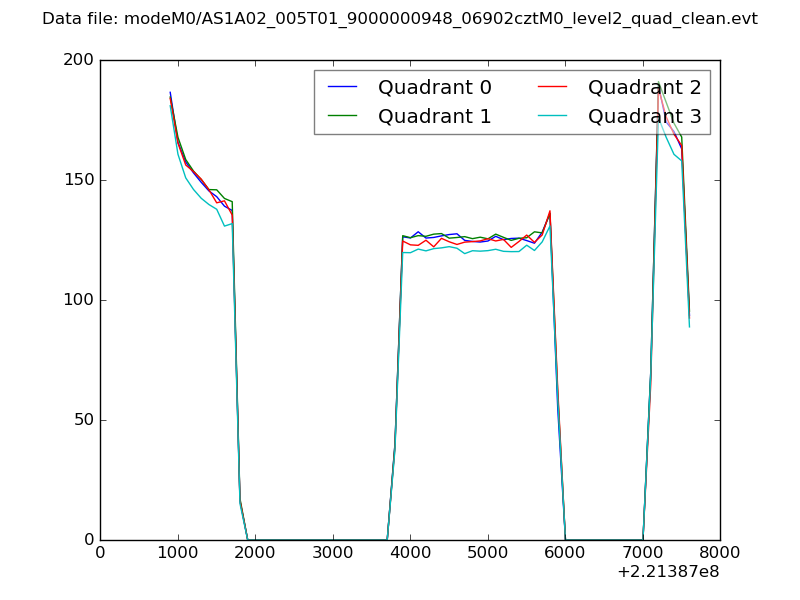 |
|
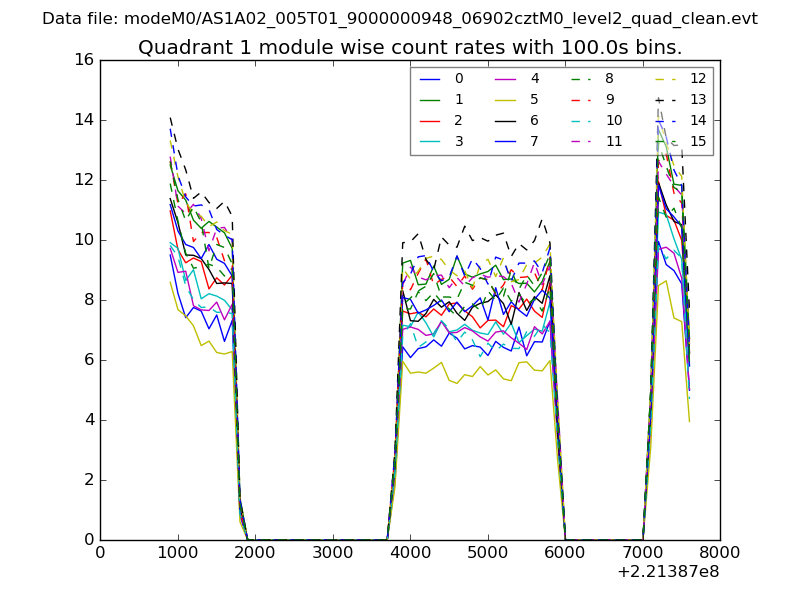
| Module-wise count rates for Quadrant A Data is divided into 100 sec bins |
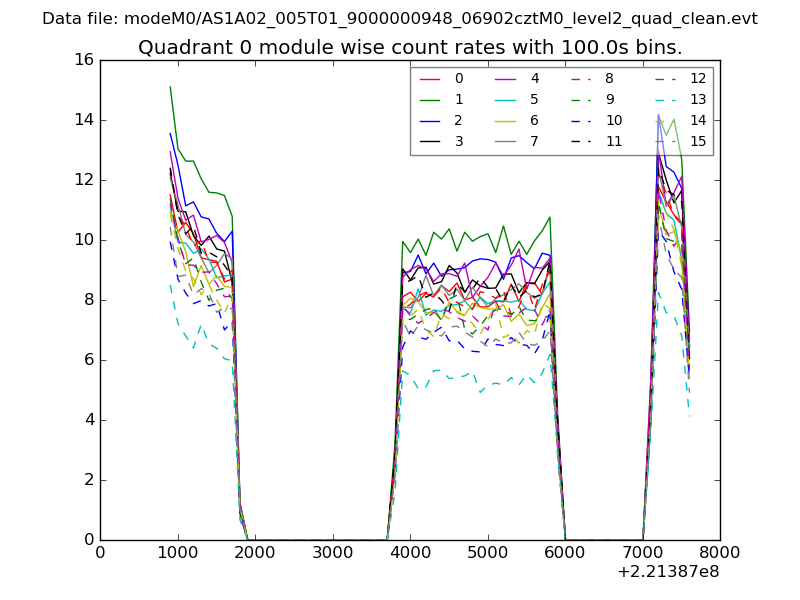 |
 |
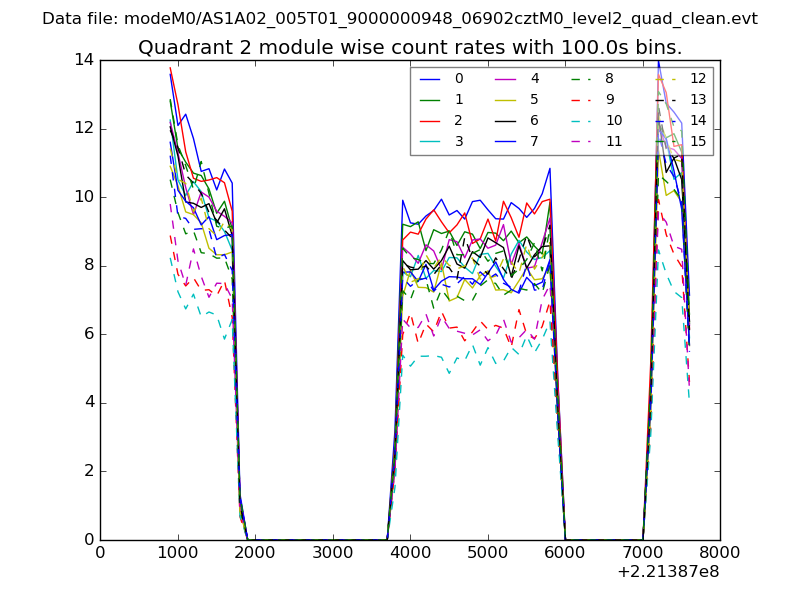
| Module-wise count rates for Quadrant B Data is divided into 100 sec bins |
 |
 |
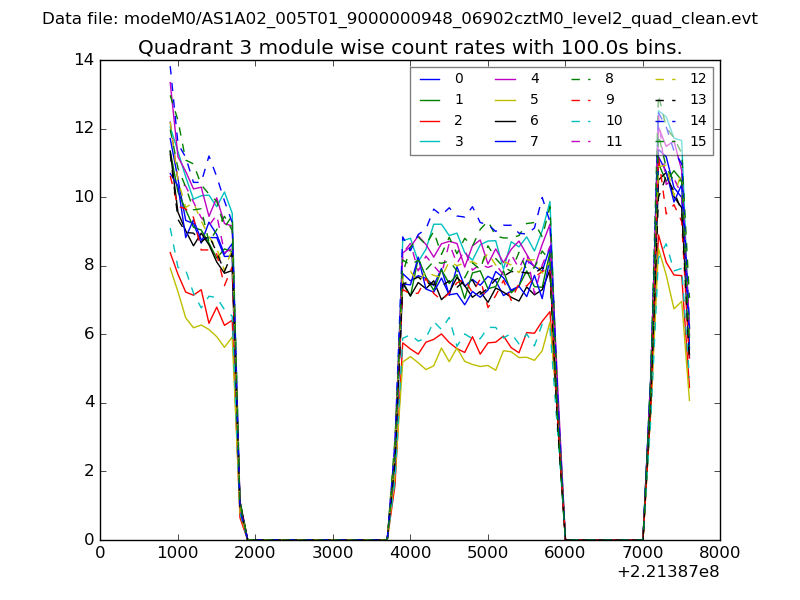
| Module-wise count rates for Quadrant C Data is divided into 100 sec bins |
 |
 |
| Module-wise count rates for Quadrant D Data is divided into 100 sec bins |
 |
 |
| Parameter | Plot |
|---|---|
| CZT HV Monitor | 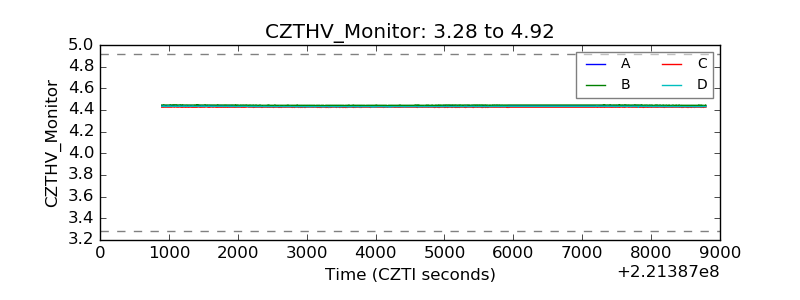 |
| D_VDD | 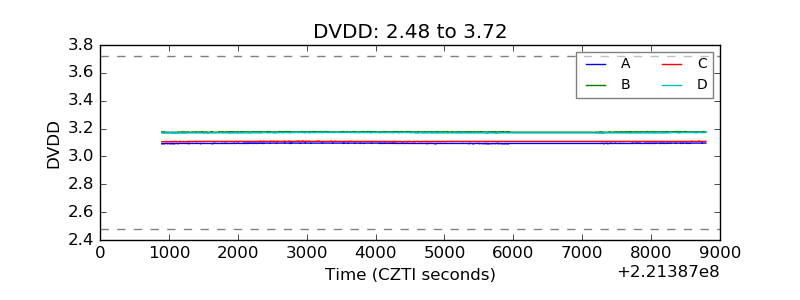 |
| Temperature 1 | 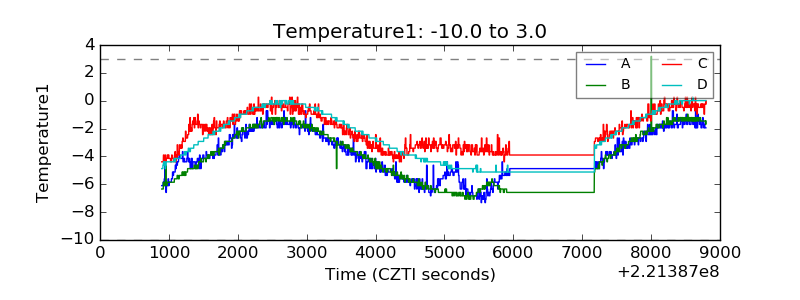 |
| Veto HV Monitor | 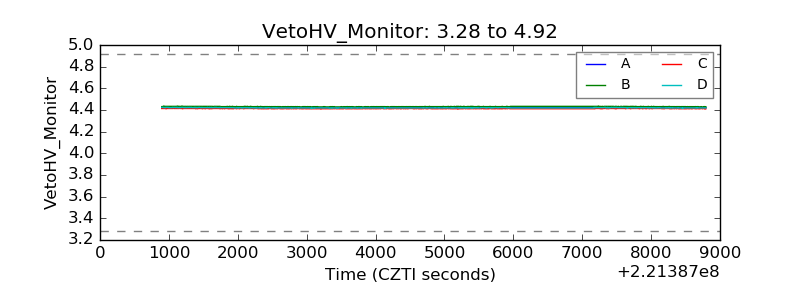 |
| Veto LLD | 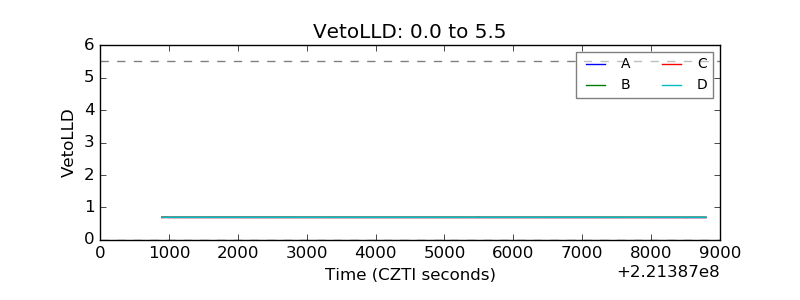 |
| Alpha Counter | 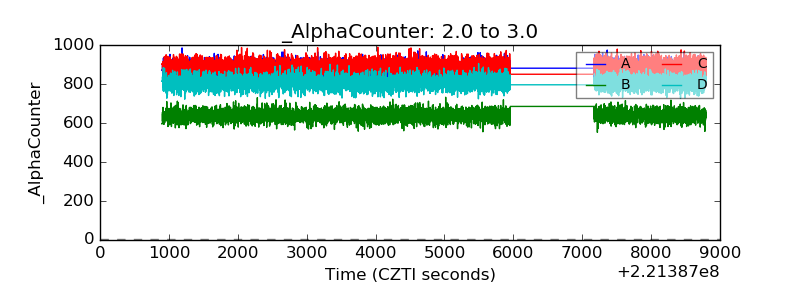 |
| _CPM_Rate | 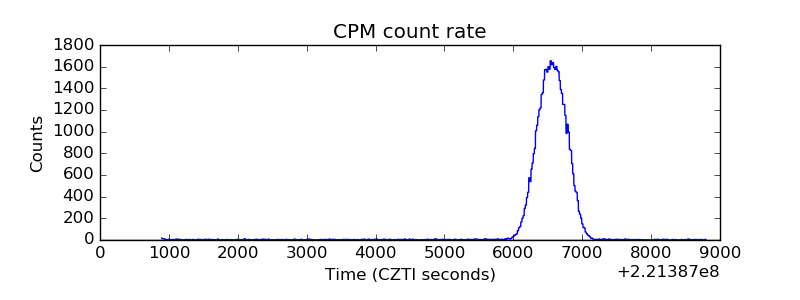 |
| CZT Counter | 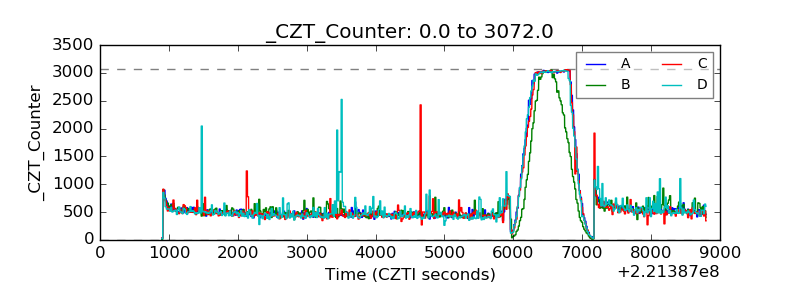 |
| +2.5 Volts monitor | 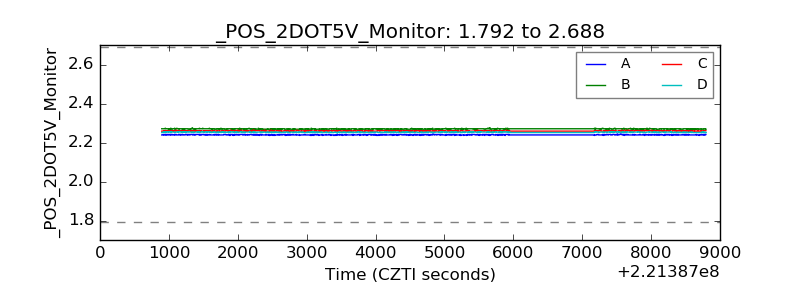 |
| +5 Volts monitor | 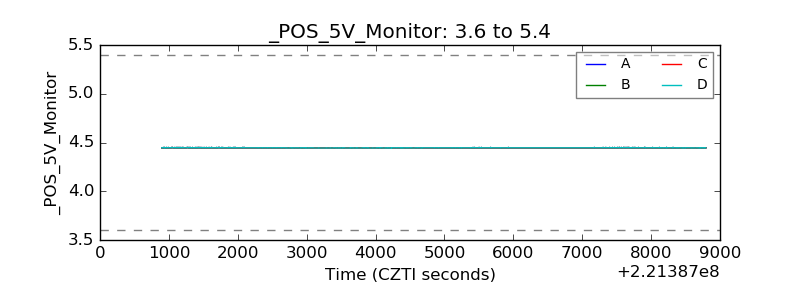 |
| _ROLL_ROT | 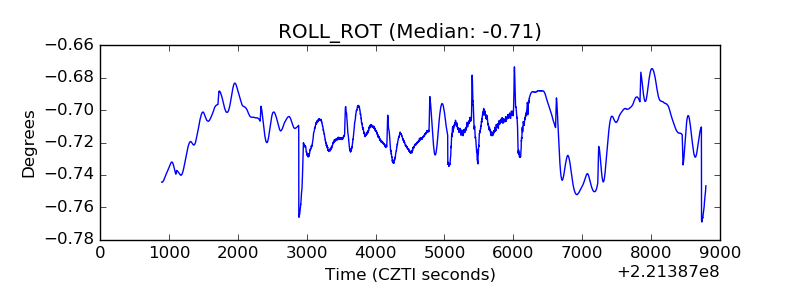 |
| _Roll_DEC | 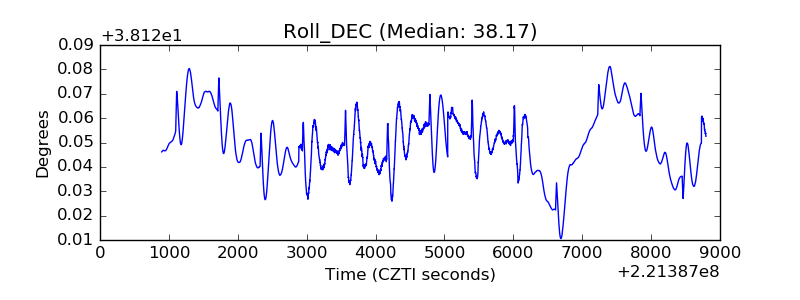 |
| _Roll_RA | 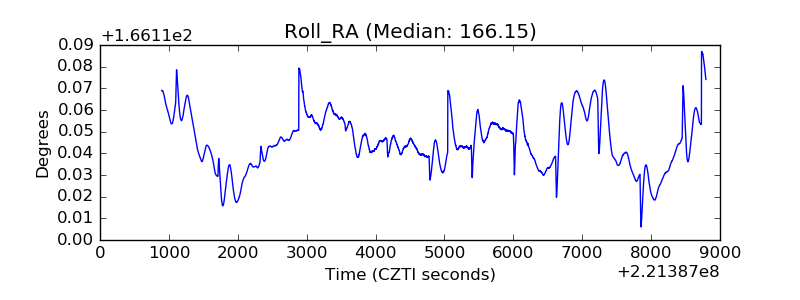 |
| Veto Counter | 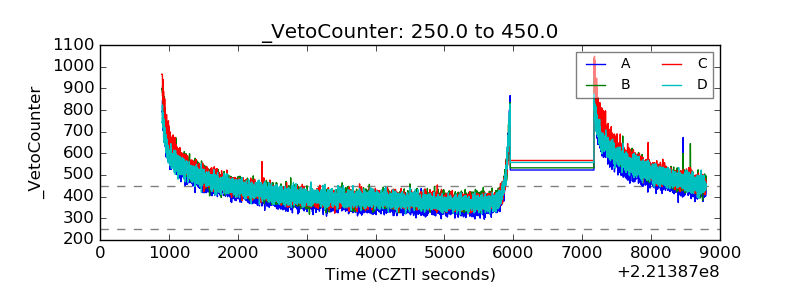 |