| Param | Original file | Final file |
|---|---|---|
| Filename | modeM0/AS1A02_005T01_9000000948_06904cztM0_level2.evt | modeM0/AS1A02_005T01_9000000948_06904cztM0_level2_quad_clean.evt |
| Size (bytes) | 468,878,400 | 63,244,800 |
| Size | 447.2 MB | 60.3 MB |
| Events in quadrant A | 3,278,514 | 370,415 |
| Events in quadrant B | 3,570,963 | 372,742 |
| Events in quadrant C | 3,256,959 | 370,848 |
| Events in quadrant D | 3,661,114 | 356,409 |
| Mode SS | |||
|---|---|---|---|
| Quadrant | BADHDUFLAG | Total packets | Discarded packets |
| A | 0 | 128 | 0 |
| B | 0 | 128 | 0 |
| C | 0 | 128 | 0 |
| D | 0 | 128 | 0 |
| Mode M0 | |||
|---|---|---|---|
| Quadrant | BADHDUFLAG | Total packets | Discarded packets |
| A | 0 | 13612 | 2 |
| B | 0 | 14665 | 1 |
| C | 0 | 13517 | 1 |
| D | 0 | 14886 | 1 |
| Mode M9 | |||
|---|---|---|---|
| Quadrant | BADHDUFLAG | Total packets | Discarded packets |
| A | 0 | 13 | 0 |
| B | 0 | 13 | 0 |
| C | 0 | 13 | 0 |
| D | 0 | 13 | 0 |
| Quadrant | Total seconds | Saturated seconds | Saturation percentage |
|---|---|---|---|
| A | 6372 | 96 | 1.506591% |
| B | 6372 | 110 | 1.726303% |
| C | 6372 | 78 | 1.224105% |
| D | 6372 | 123 | 1.930320% |
Noise dominated data is calculated using 1-second bins in cleaned event files. If a bin has >2000 counts, and if more than 50% of those come from <1% of pixels, then it is considered to be noise-dominated and hence unusable.
| Quadrant | # 1 sec bins | Bins with >0 counts | Bins with >2000 counts | High rate bins dominated by noise | Noise dominated (total time) | Noise dominated (detector-on time) | Marked lightcurve |
|---|---|---|---|---|---|---|---|
| A | 7682 | 6373 | 0 | 0 | 0.00% | 0.00% | 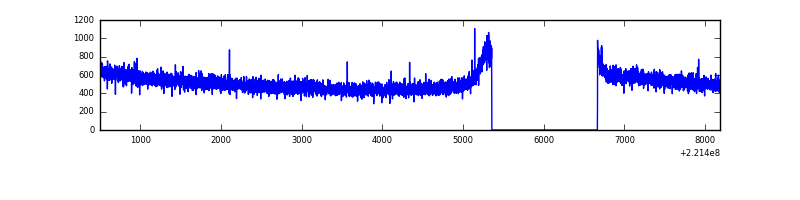 |
| B | 7682 | 6373 | 13 | 13 | 0.17% | 0.20% | 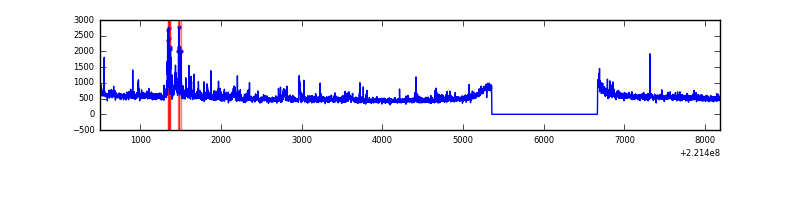 |
| C | 7682 | 6373 | 0 | 0 | 0.00% | 0.00% | 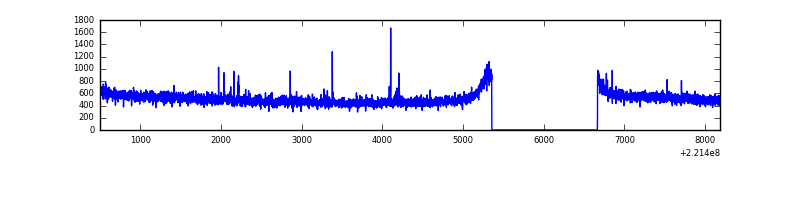 |
| D | 7682 | 6373 | 43 | 43 | 0.56% | 0.67% | 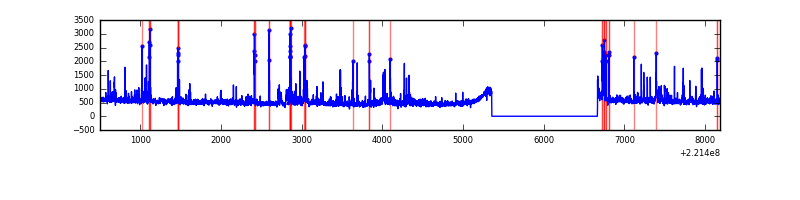 |
Top three noisy pixels from each quadrant. If the there are fewer than three noisy pixels in the level2.evt file, extra rows are filled as -1
| Pixel properties | Quadrant properties | ||||||
|---|---|---|---|---|---|---|---|
| Quadrant | DetID | PixID | Counts | Sigma | Mean | Median | Sigma |
| A | 8 | 15 | 40515 | 236.9 | 832 | 815 | 167.6 |
| A | 13 | 14 | 35838 | 208.99 | 832 | 815 | 167.6 |
| A | 0 | 226 | 8243 | 44.32 | 832 | 815 | 167.6 |
| B | 4 | 48 | 140390 | 900.05 | 829 | 812 | 155.1 |
| B | 0 | 219 | 67118 | 427.57 | 829 | 812 | 155.1 |
| B | 0 | 214 | 56850 | 361.35 | 829 | 812 | 155.1 |
| C | 9 | 247 | 60536 | 323.45 | 810 | 816 | 184.6 |
| C | 9 | 54 | 22953 | 119.9 | 810 | 816 | 184.6 |
| C | 13 | 61 | 6490 | 30.73 | 810 | 816 | 184.6 |
| D | 2 | 216 | 246309 | 1251.86 | 813 | 788 | 196.1 |
| D | 2 | 152 | 131019 | 664.02 | 813 | 788 | 196.1 |
| D | 8 | 195 | 59904 | 301.42 | 813 | 788 | 196.1 |
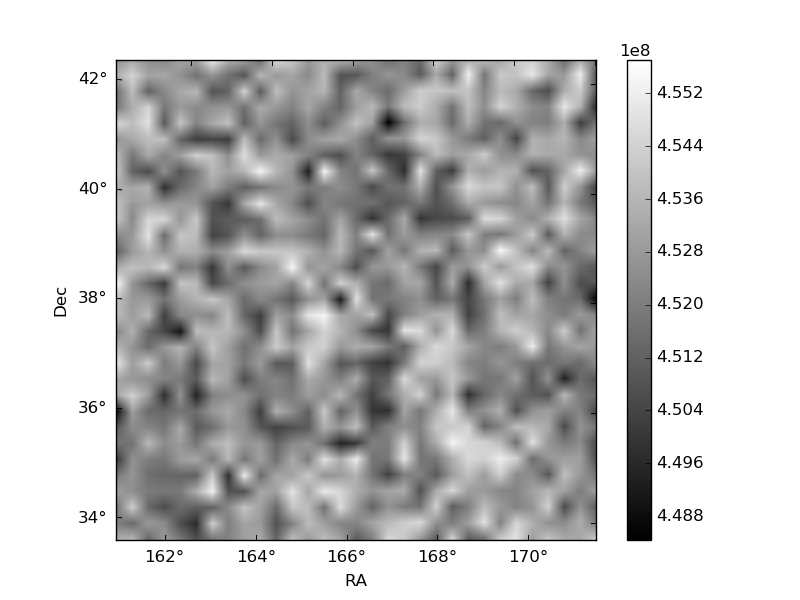
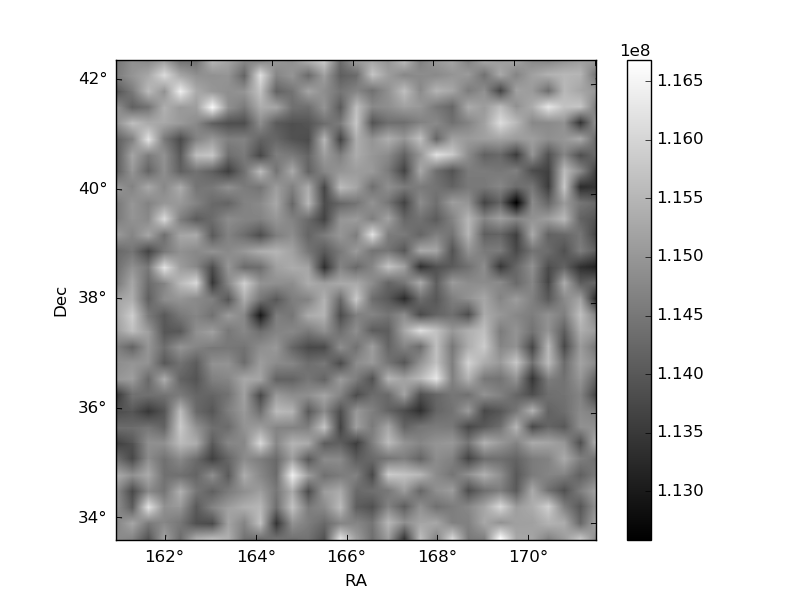
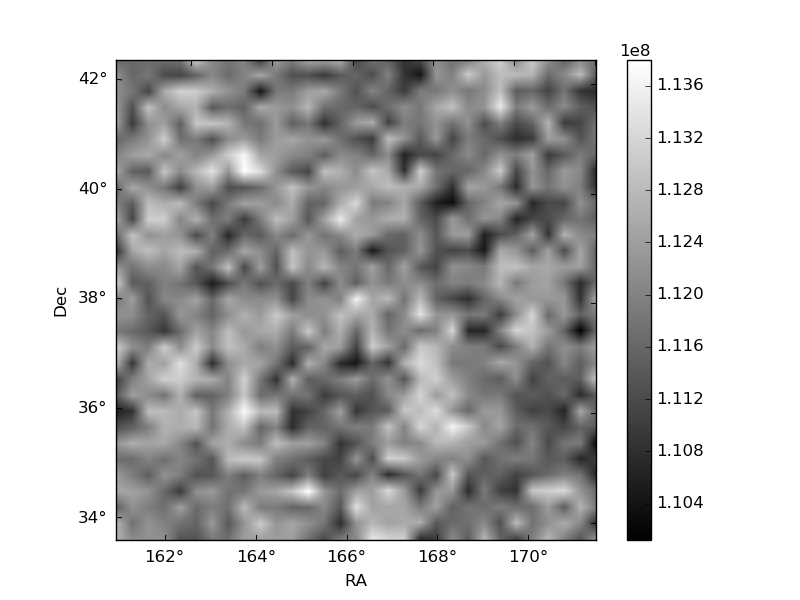
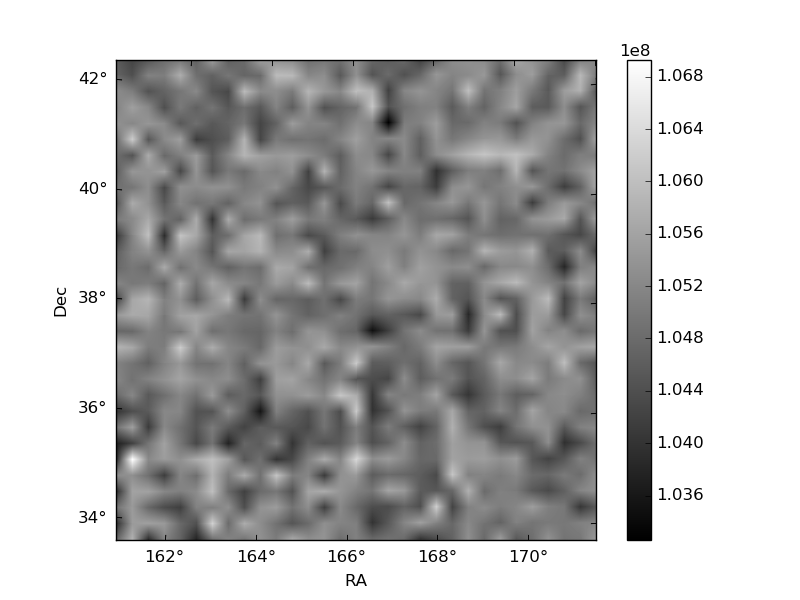
Histogram calculated using DETX and DETY for each event in the final _common_clean file
| Quadrant A | 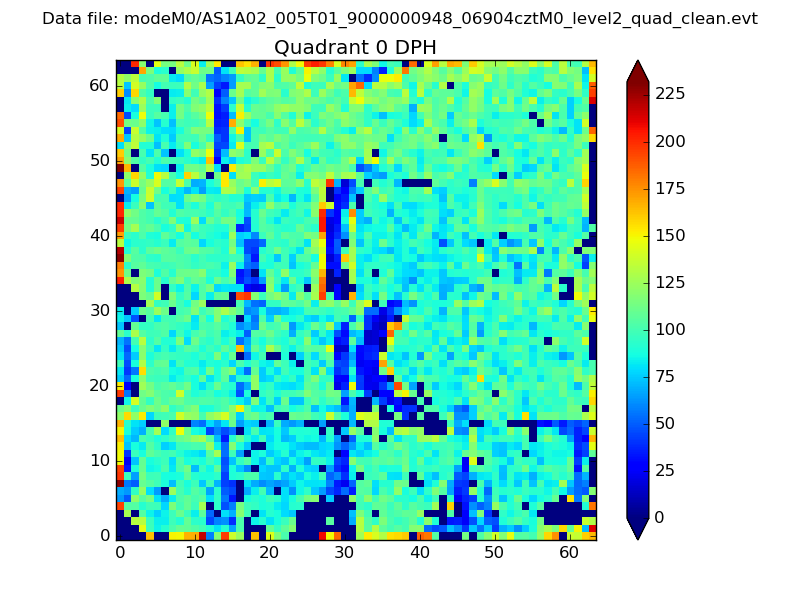 |
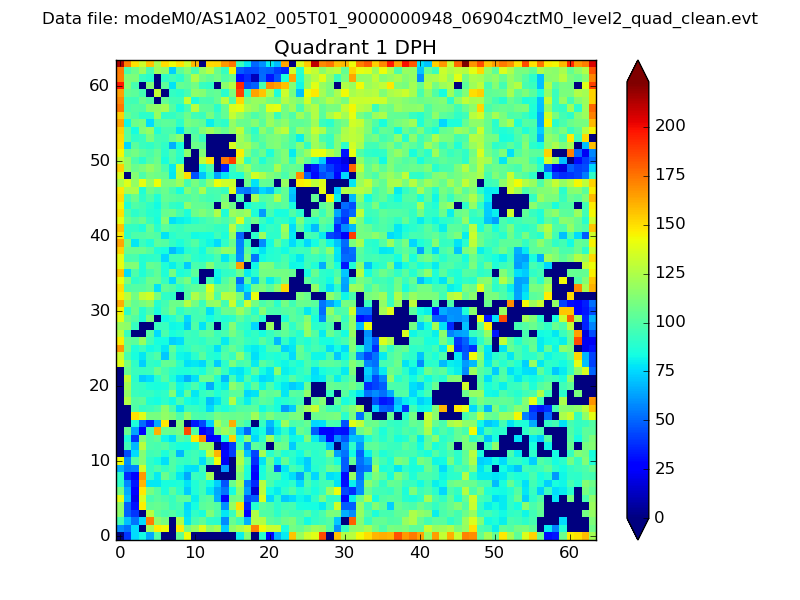 |
Quadrant B |
|---|---|---|---|
| Quadrant D | 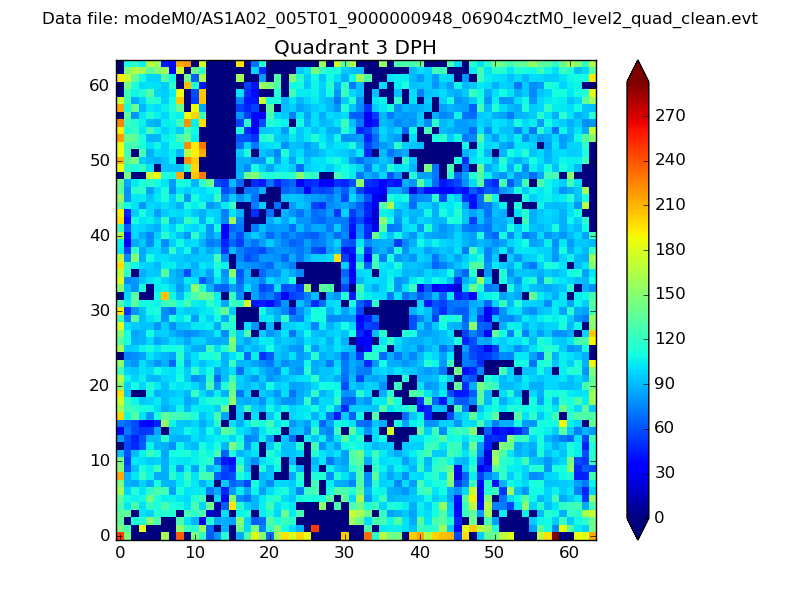 |
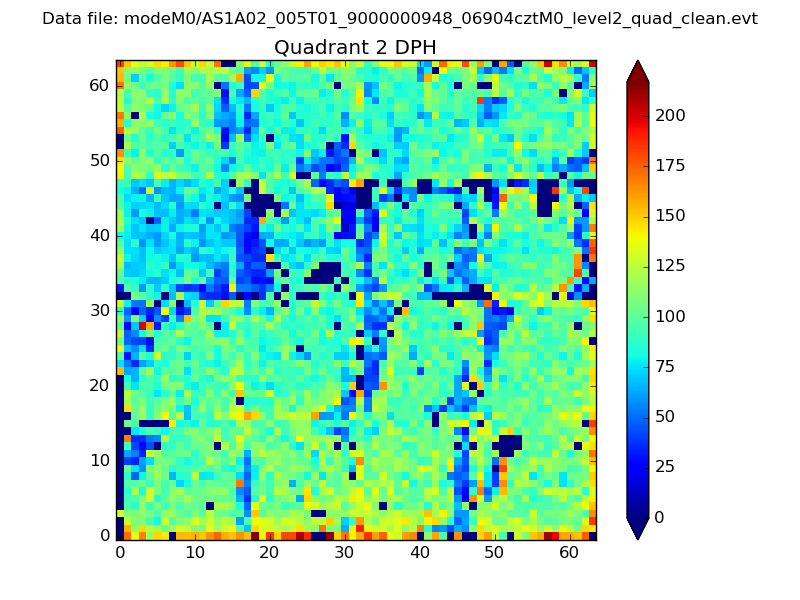 |
Quadrant C |
| Plot type | Count rate plots | Images |
|---|---|---|
| Comparison with Poisson distribution Blue bars denote a histogram of data divided into 1 sec bins. Red curve is a Poisson curve with rate = median count rate of data. |
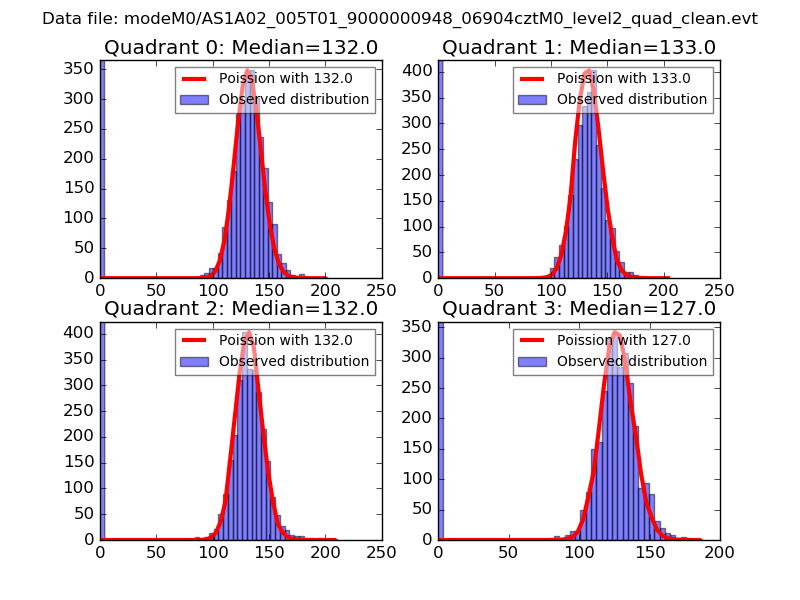 |
 |
| Quadrant-wise count rates Data is divided into 100 sec bins |
 |
|
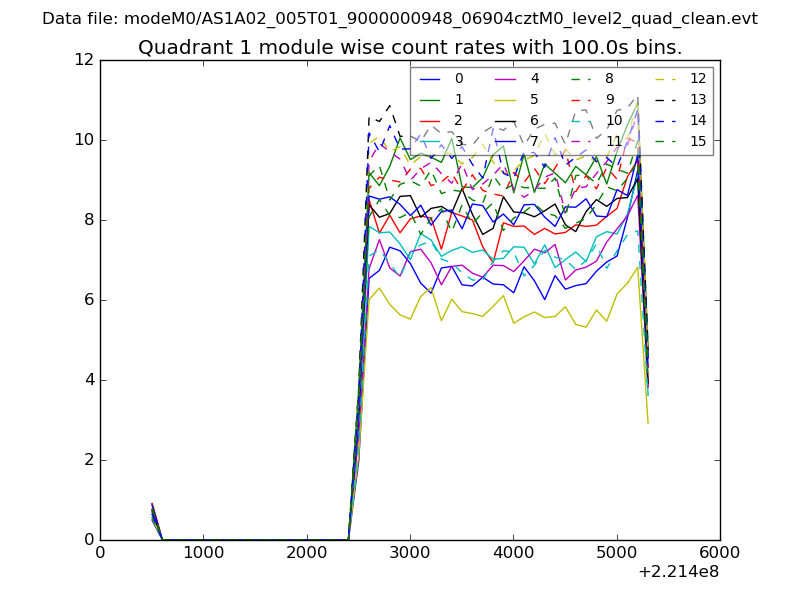
| Module-wise count rates for Quadrant A Data is divided into 100 sec bins |
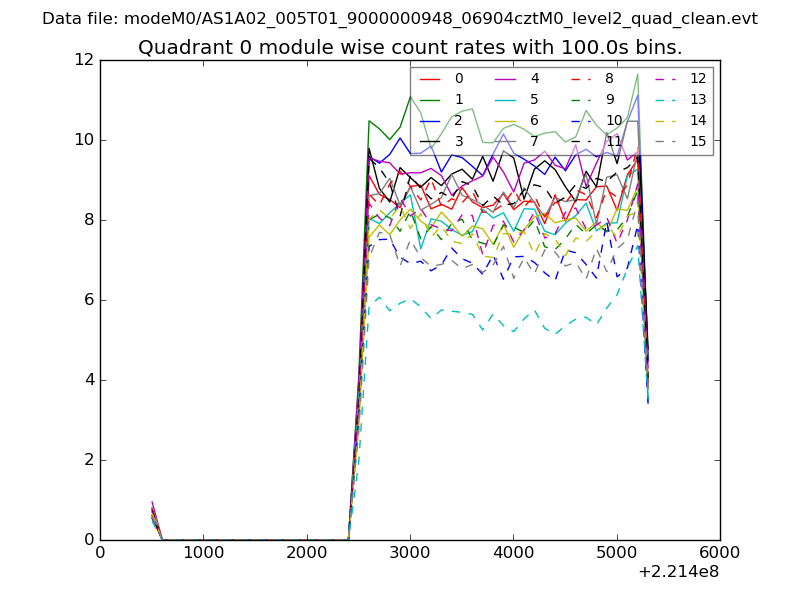 |
 |
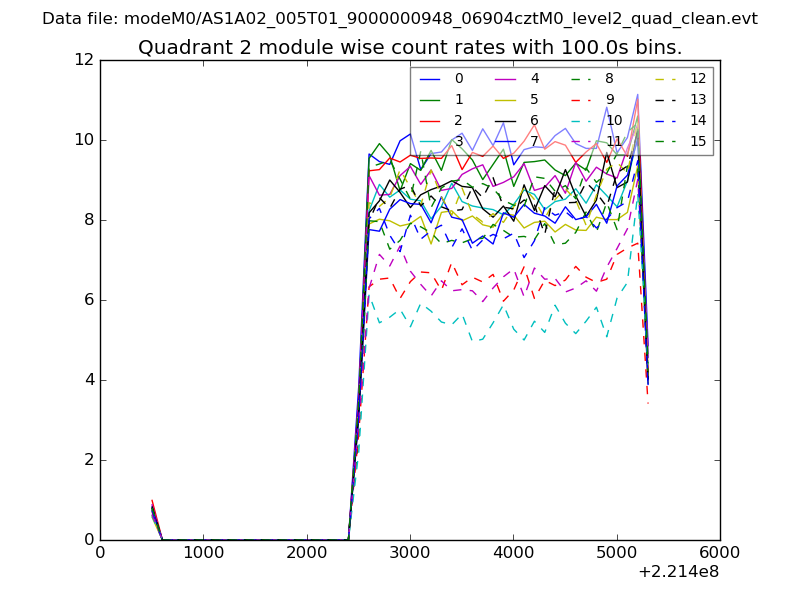
| Module-wise count rates for Quadrant B Data is divided into 100 sec bins |
 |
 |
| Module-wise count rates for Quadrant C Data is divided into 100 sec bins |
 |
 |
| Module-wise count rates for Quadrant D Data is divided into 100 sec bins |
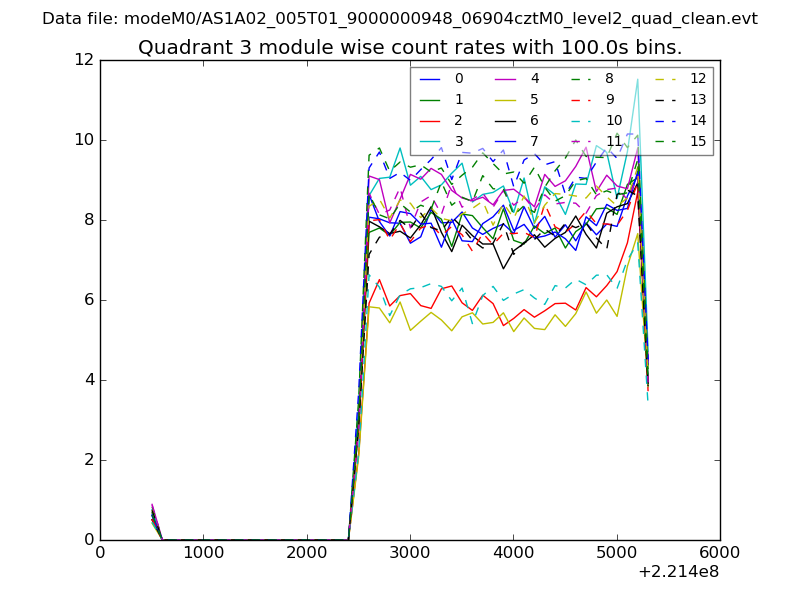 |
 |
| Parameter | Plot |
|---|---|
| CZT HV Monitor | 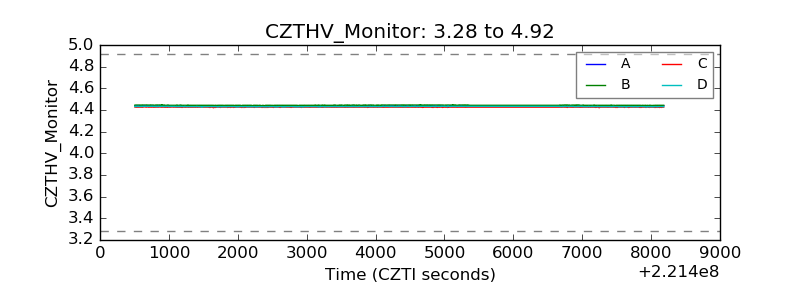 |
| D_VDD | 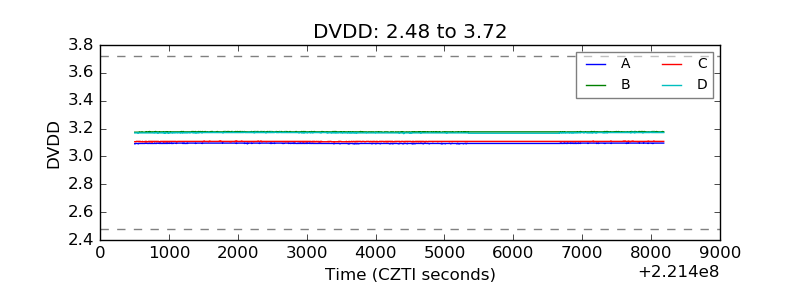 |
| Temperature 1 | 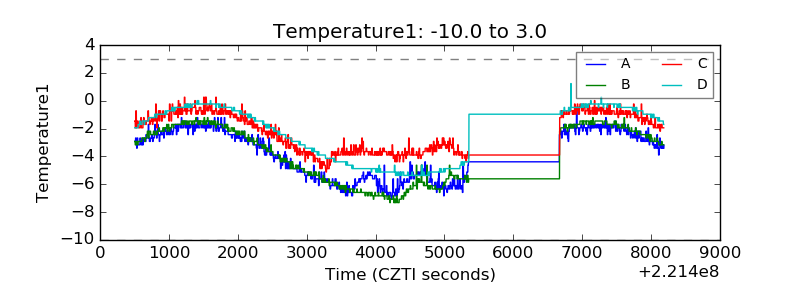 |
| Veto HV Monitor | 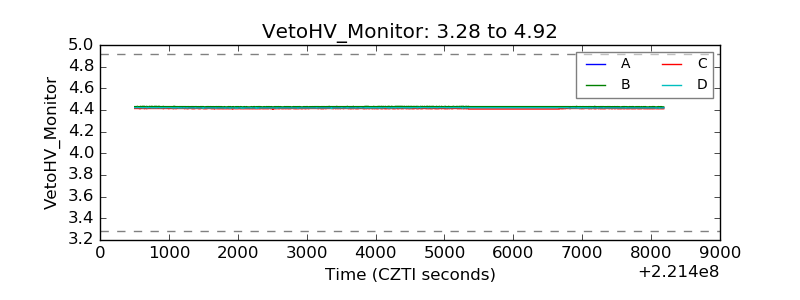 |
| Veto LLD | 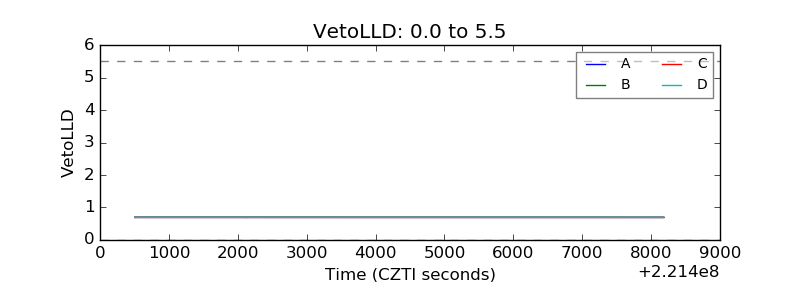 |
| Alpha Counter | 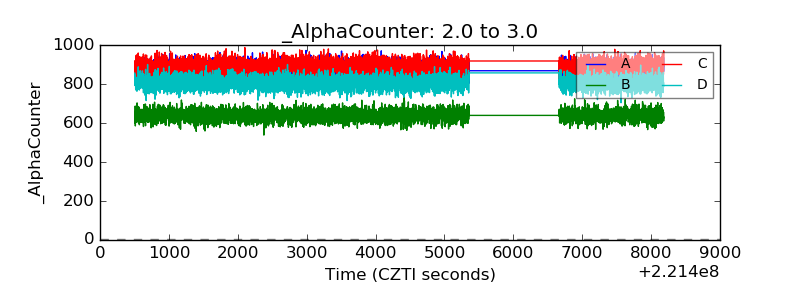 |
| _CPM_Rate | 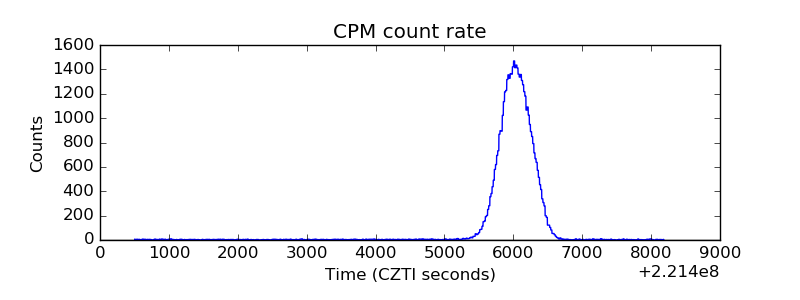 |
| CZT Counter | 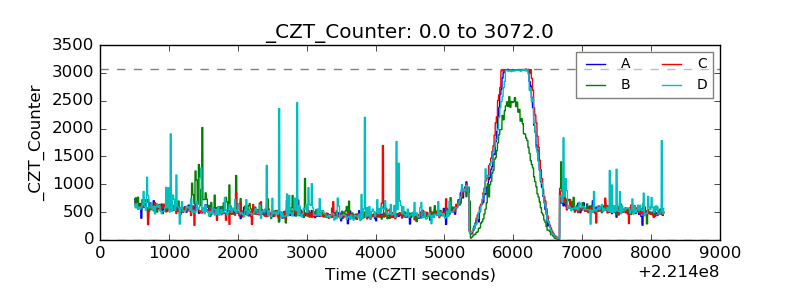 |
| +2.5 Volts monitor |  |
| +5 Volts monitor |  |
| _ROLL_ROT | 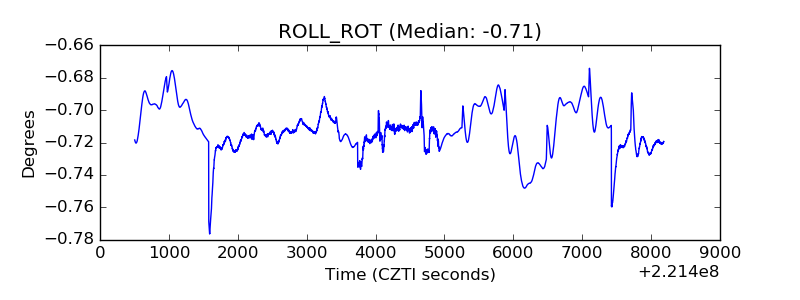 |
| _Roll_DEC | 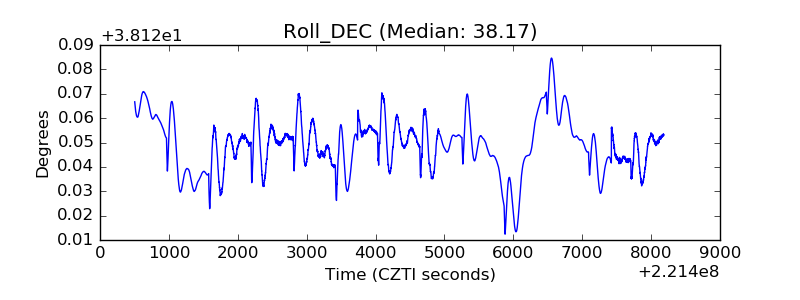 |
| _Roll_RA | 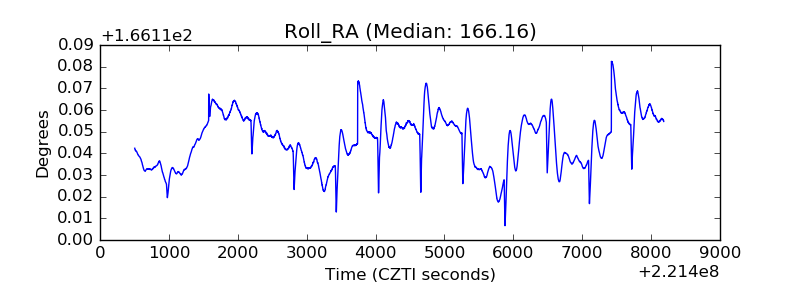 |
| Veto Counter | 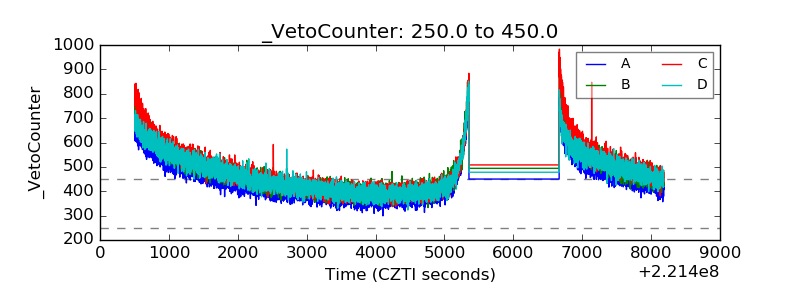 |