| Param | Original file | Final file |
|---|---|---|
| Filename | modeM0/AS1A02_005T01_9000000948_06905cztM0_level2.evt | modeM0/AS1A02_005T01_9000000948_06905cztM0_level2_quad_clean.evt |
| Size (bytes) | 457,986,240 | 70,257,600 |
| Size | 436.8 MB | 67.0 MB |
| Events in quadrant A | 3,201,164 | 420,855 |
| Events in quadrant B | 3,348,514 | 427,361 |
| Events in quadrant C | 3,152,294 | 425,689 |
| Events in quadrant D | 3,736,805 | 410,520 |
| Mode SS | |||
|---|---|---|---|
| Quadrant | BADHDUFLAG | Total packets | Discarded packets |
| A | 0 | 128 | 0 |
| B | 0 | 128 | 0 |
| C | 0 | 128 | 0 |
| D | 0 | 128 | 0 |
| Mode M0 | |||
|---|---|---|---|
| Quadrant | BADHDUFLAG | Total packets | Discarded packets |
| A | 0 | 13513 | 3 |
| B | 0 | 14078 | 2 |
| C | 0 | 13390 | 2 |
| D | 0 | 15245 | 2 |
| Mode M9 | |||
|---|---|---|---|
| Quadrant | BADHDUFLAG | Total packets | Discarded packets |
| A | 0 | 21 | 0 |
| B | 0 | 21 | 0 |
| C | 0 | 21 | 0 |
| D | 0 | 22 | 0 |
| Quadrant | Total seconds | Saturated seconds | Saturation percentage |
|---|---|---|---|
| A | 6350 | 89 | 1.401575% |
| B | 6350 | 119 | 1.874016% |
| C | 6350 | 87 | 1.370079% |
| D | 6350 | 179 | 2.818898% |
Noise dominated data is calculated using 1-second bins in cleaned event files. If a bin has >2000 counts, and if more than 50% of those come from <1% of pixels, then it is considered to be noise-dominated and hence unusable.
| Quadrant | # 1 sec bins | Bins with >0 counts | Bins with >2000 counts | High rate bins dominated by noise | Noise dominated (total time) | Noise dominated (detector-on time) | Marked lightcurve |
|---|---|---|---|---|---|---|---|
| A | 7600 | 6351 | 0 | 0 | 0.00% | 0.00% | 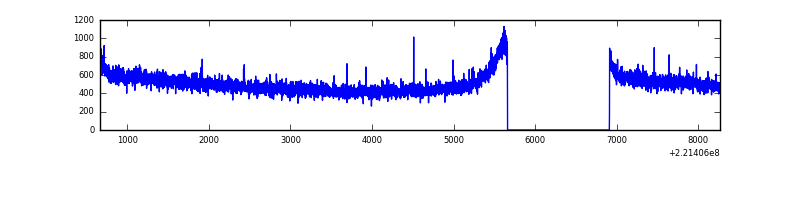 |
| B | 7600 | 6351 | 6 | 6 | 0.08% | 0.09% | 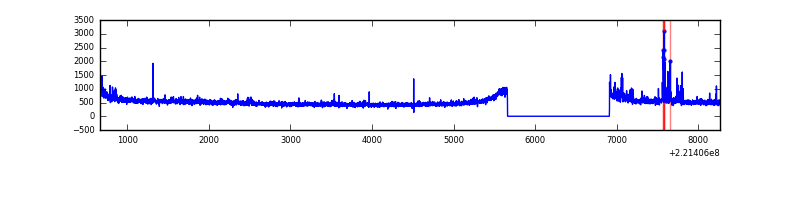 |
| C | 7600 | 6351 | 0 | 0 | 0.00% | 0.00% | 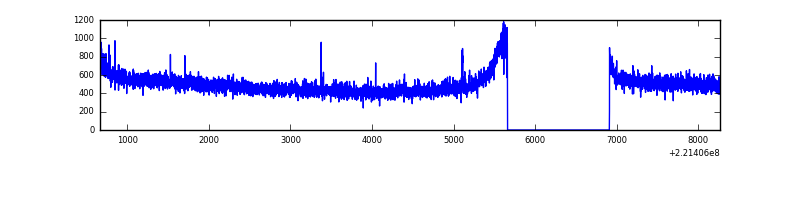 |
| D | 7600 | 6351 | 66 | 66 | 0.87% | 1.04% | 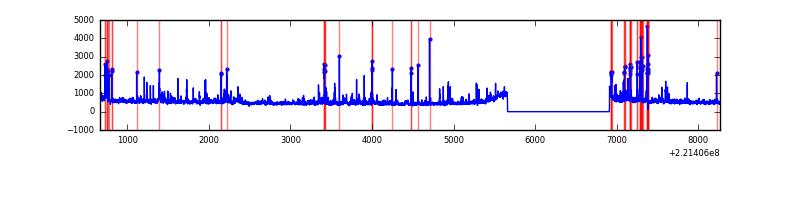 |
Top three noisy pixels from each quadrant. If the there are fewer than three noisy pixels in the level2.evt file, extra rows are filled as -1
| Pixel properties | Quadrant properties | ||||||
|---|---|---|---|---|---|---|---|
| Quadrant | DetID | PixID | Counts | Sigma | Mean | Median | Sigma |
| A | 8 | 15 | 36863 | 219.55 | 811 | 794 | 164.3 |
| A | 13 | 14 | 26312 | 155.33 | 811 | 794 | 164.3 |
| A | 0 | 23 | 15244 | 87.96 | 811 | 794 | 164.3 |
| B | 4 | 81 | 60433 | 389.88 | 811 | 795 | 153.0 |
| B | 0 | 219 | 38317 | 245.3 | 811 | 795 | 153.0 |
| B | 4 | 48 | 28313 | 179.9 | 811 | 795 | 153.0 |
| C | 9 | 247 | 45425 | 243.89 | 793 | 798 | 183.0 |
| C | 13 | 61 | 6303 | 30.09 | 793 | 798 | 183.0 |
| C | 9 | 54 | 5929 | 28.04 | 793 | 798 | 183.0 |
| D | 2 | 216 | 331349 | 1744.6 | 790 | 767 | 189.5 |
| D | 2 | 152 | 168971 | 887.67 | 790 | 767 | 189.5 |
| D | 12 | 221 | 66513 | 346.97 | 790 | 767 | 189.5 |
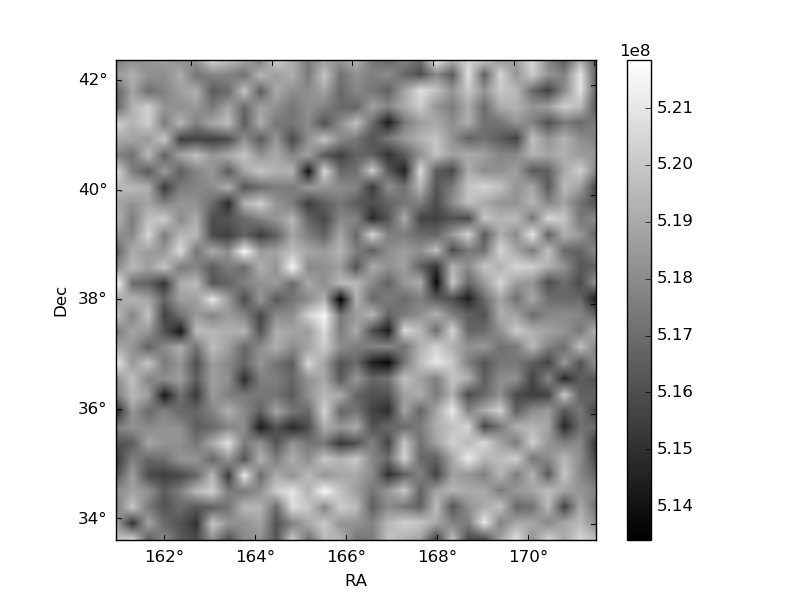
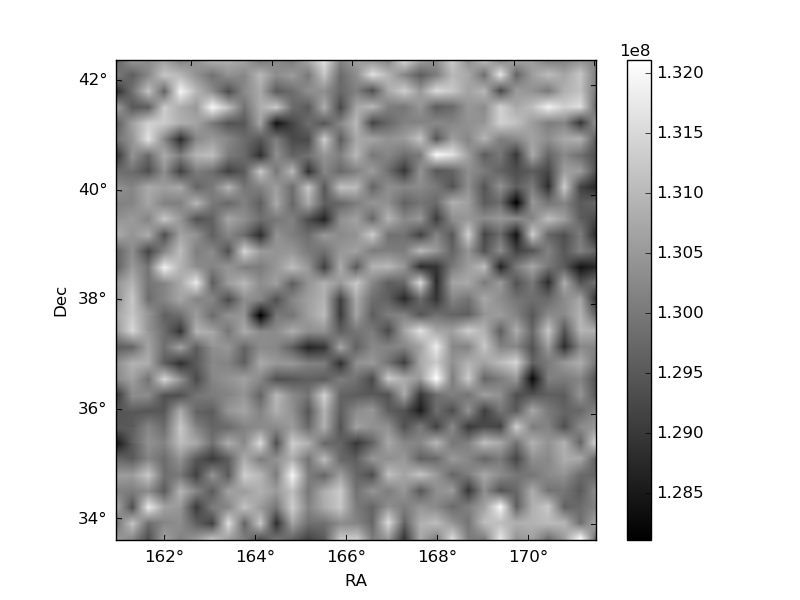
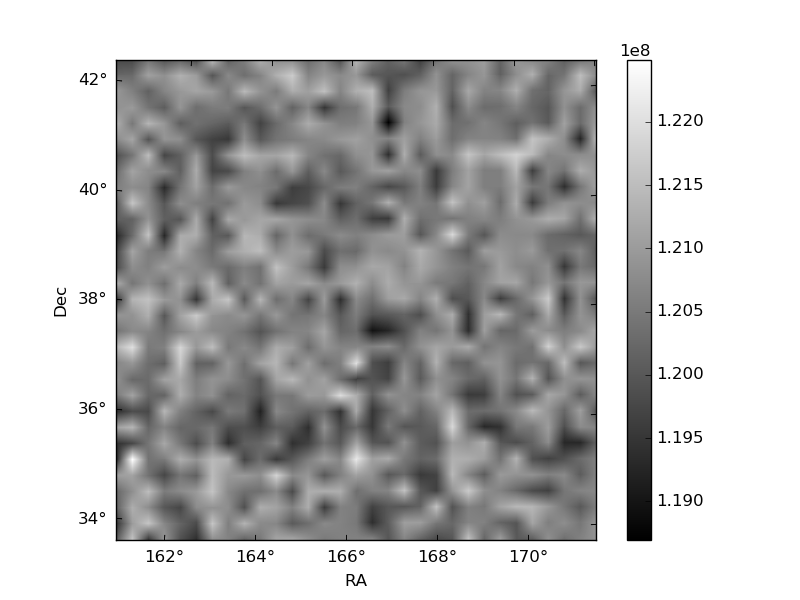
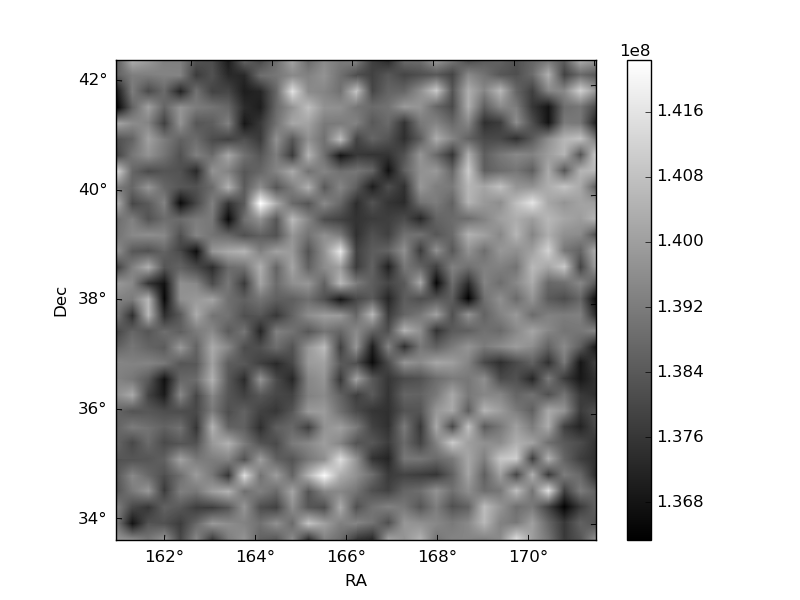
Histogram calculated using DETX and DETY for each event in the final _common_clean file
| Quadrant A | 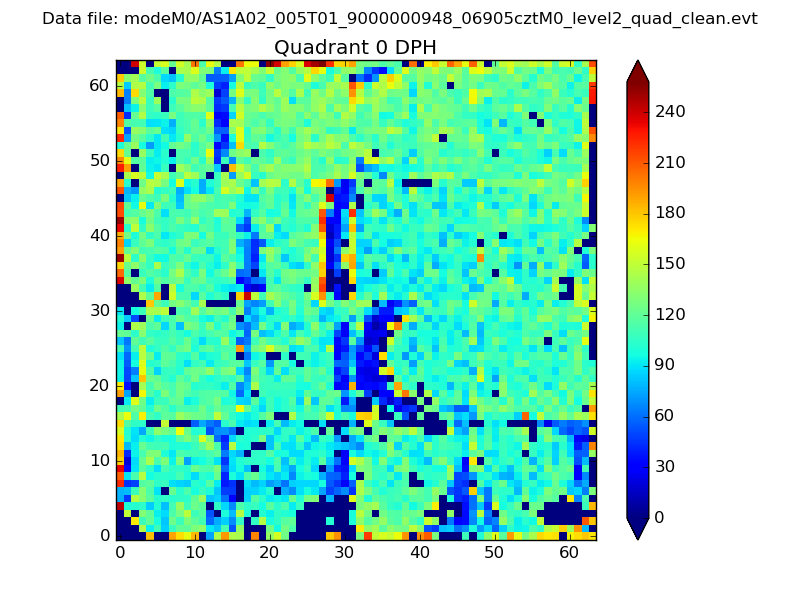 |
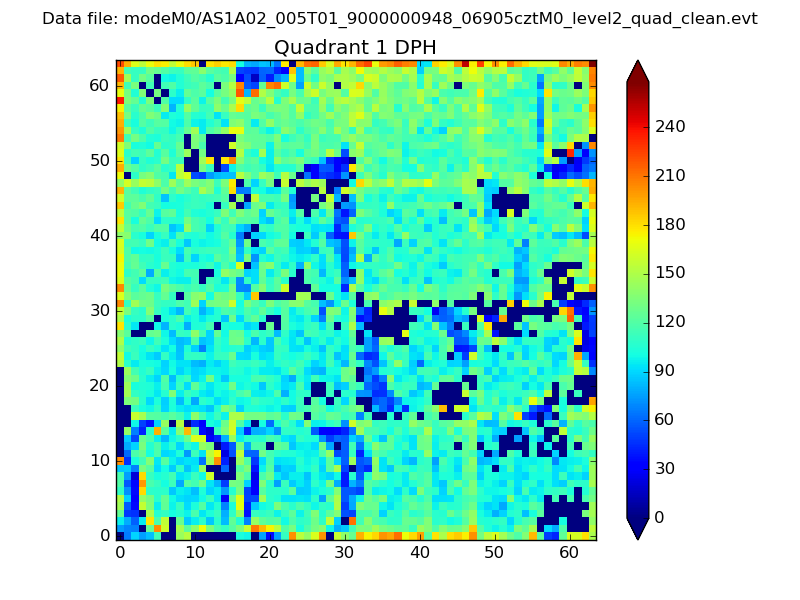 |
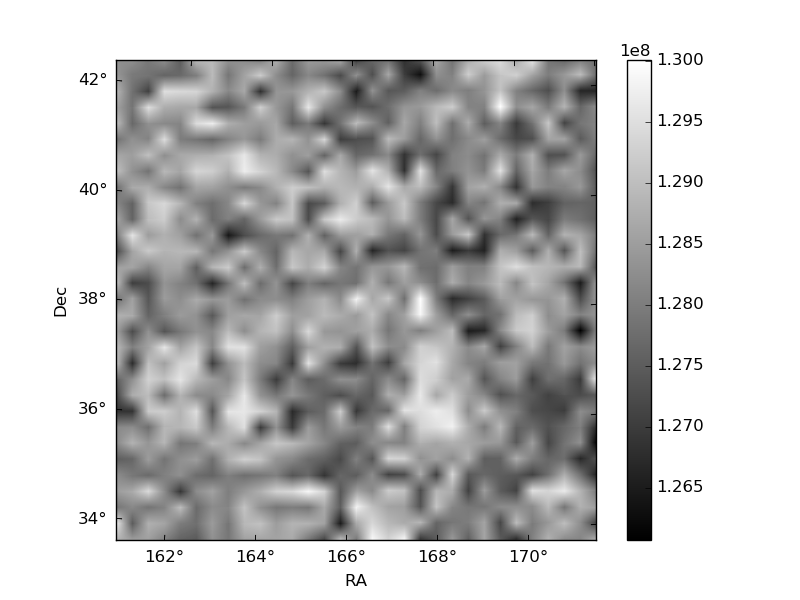
Quadrant B |
|---|---|---|---|
| Quadrant D | 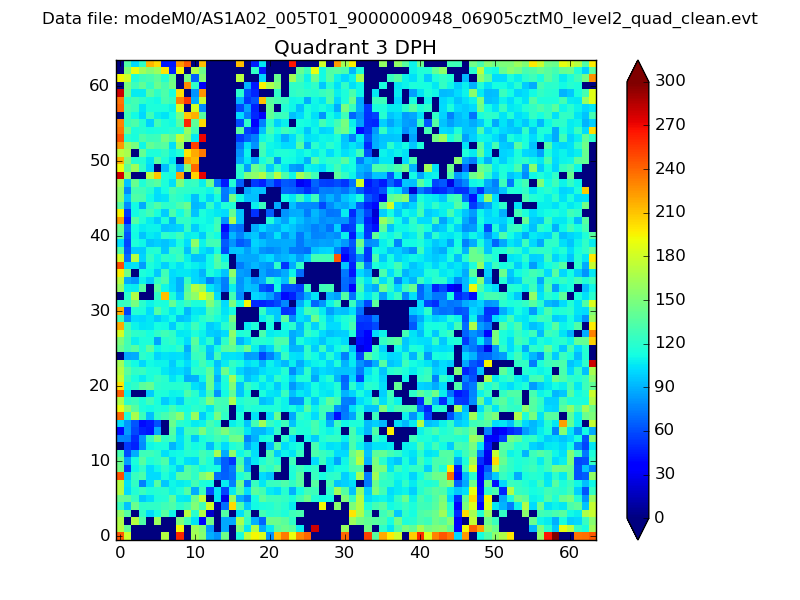 |
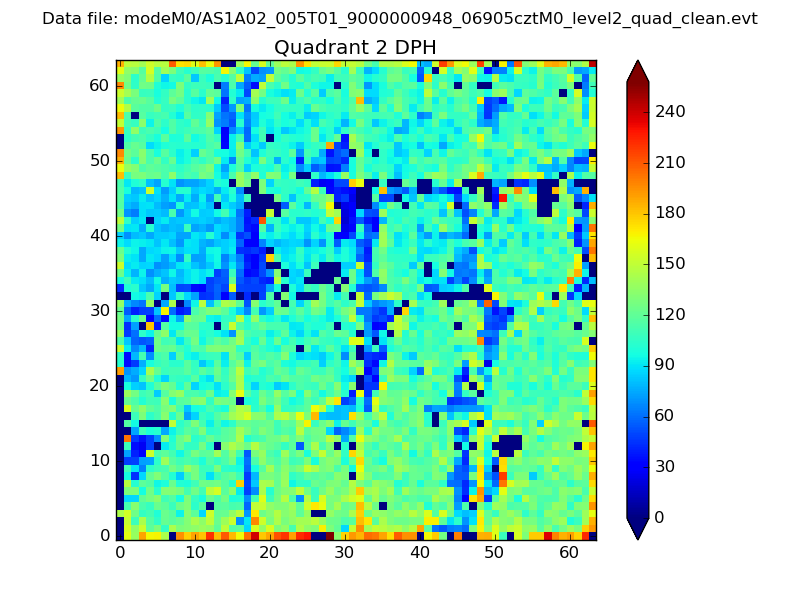 |
Quadrant C |
| Plot type | Count rate plots | Images |
|---|---|---|
| Comparison with Poisson distribution Blue bars denote a histogram of data divided into 1 sec bins. Red curve is a Poisson curve with rate = median count rate of data. |
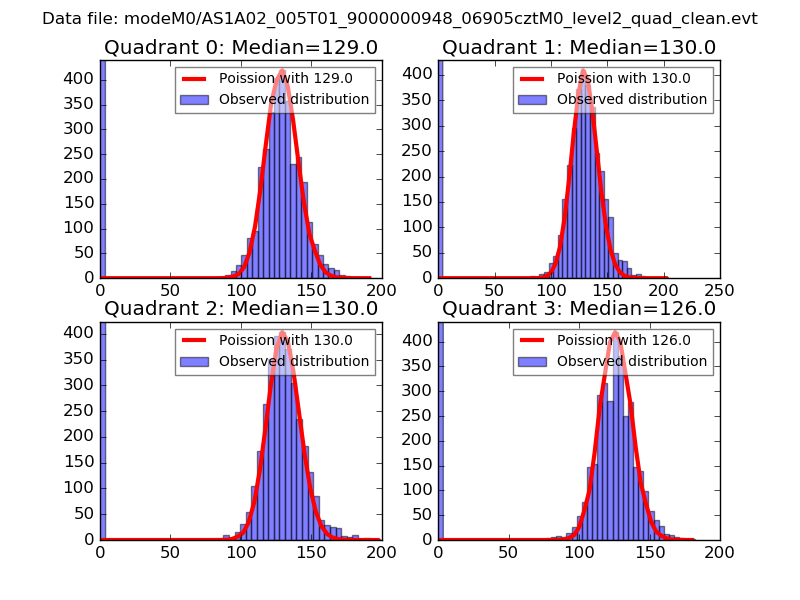 |
 |
| Quadrant-wise count rates Data is divided into 100 sec bins |
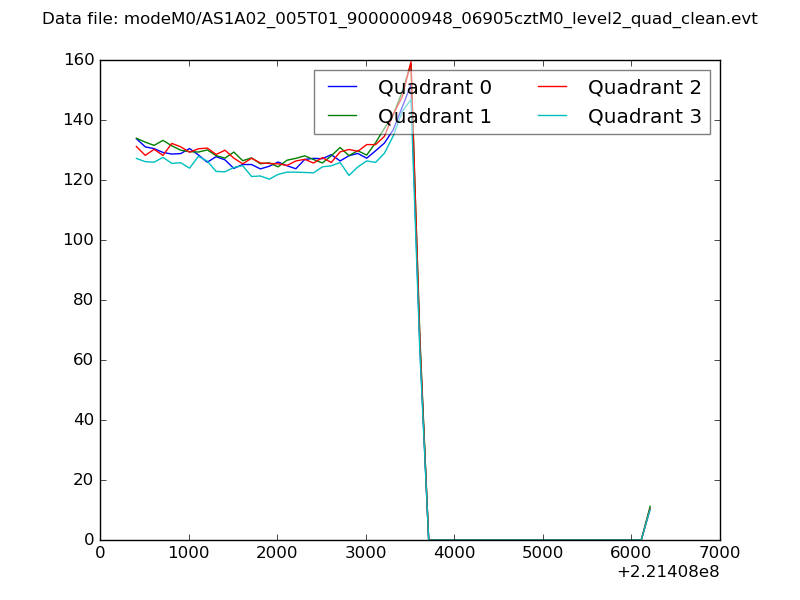 |
|
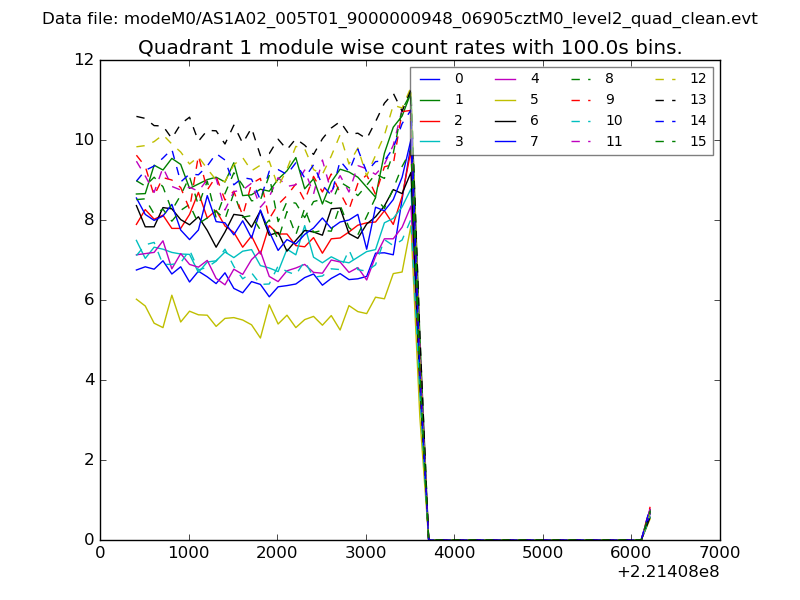
| Module-wise count rates for Quadrant A Data is divided into 100 sec bins |
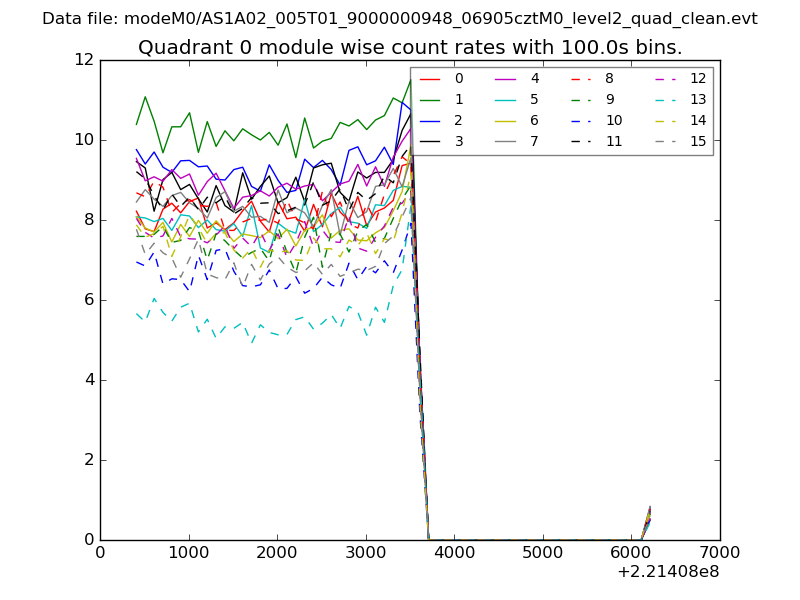 |
 |
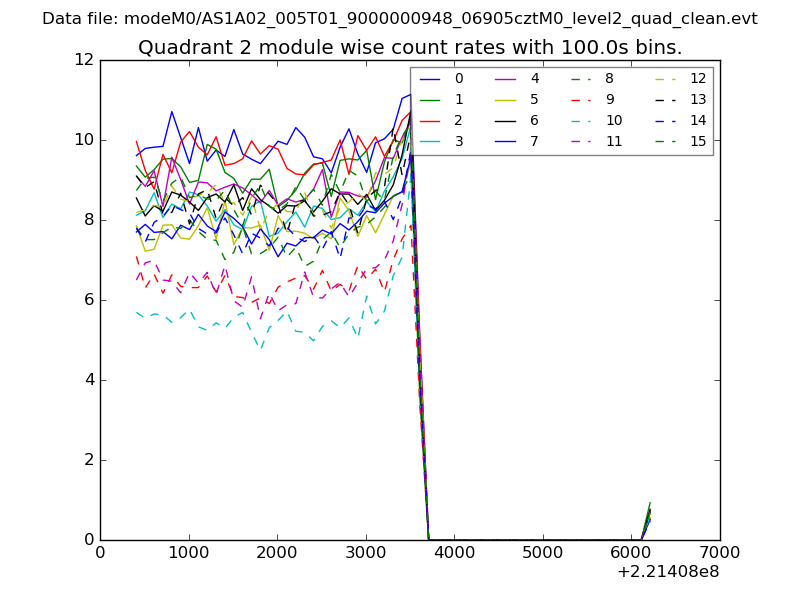
| Module-wise count rates for Quadrant B Data is divided into 100 sec bins |
 |
 |
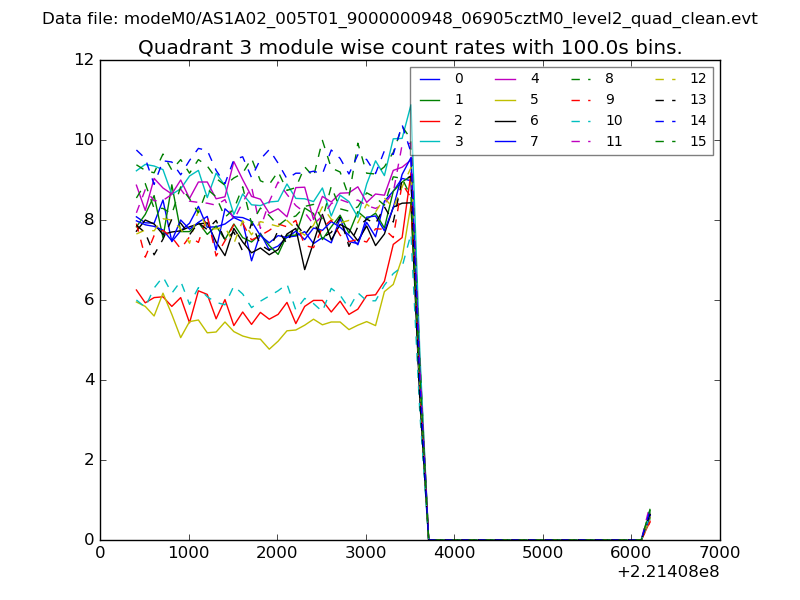
| Module-wise count rates for Quadrant C Data is divided into 100 sec bins |
 |
 |
| Module-wise count rates for Quadrant D Data is divided into 100 sec bins |
 |
 |
| Parameter | Plot |
|---|---|
| CZT HV Monitor | 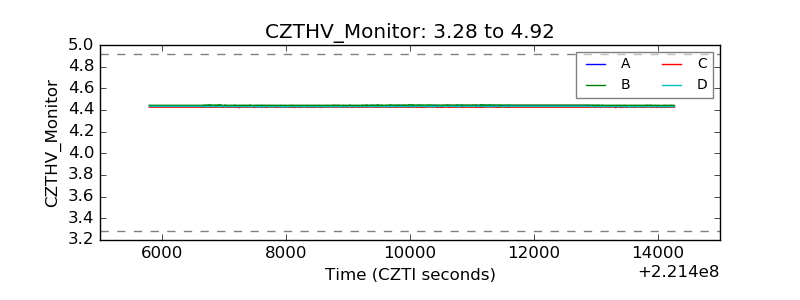 |
| D_VDD | 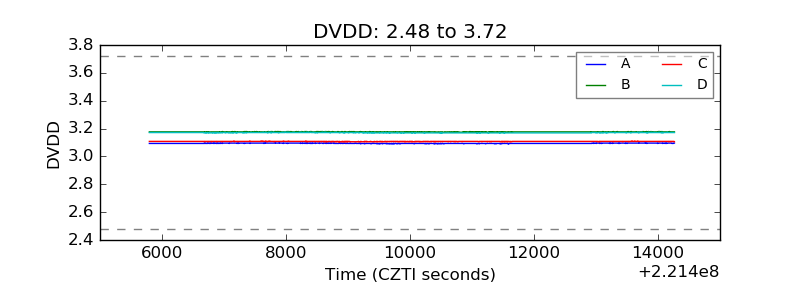 |
| Temperature 1 | 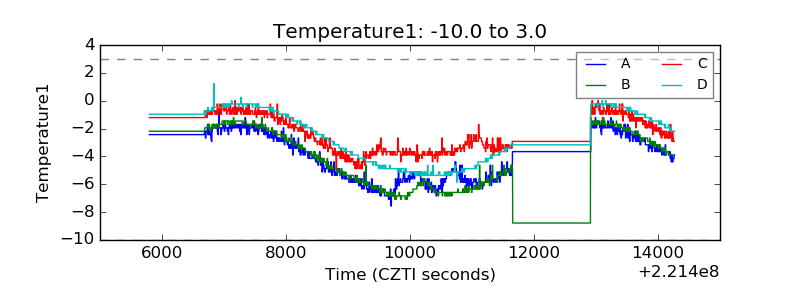 |
| Veto HV Monitor | 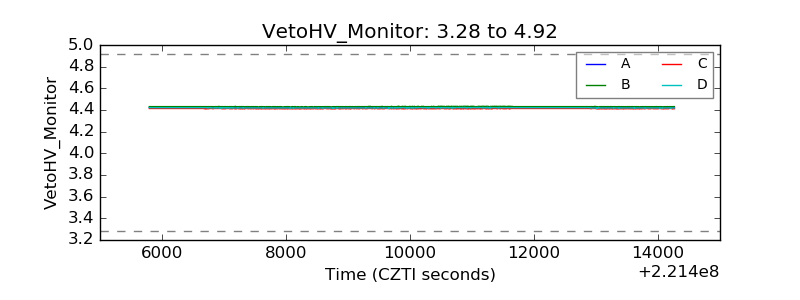 |
| Veto LLD | 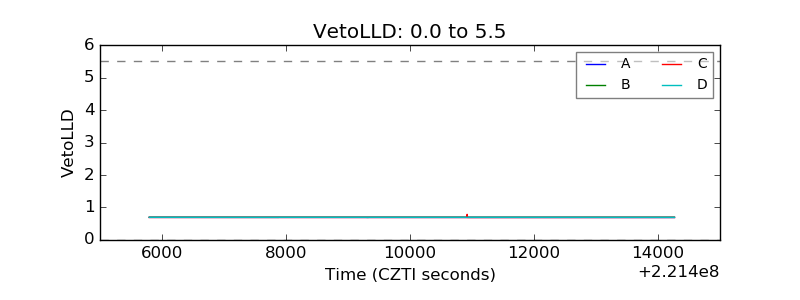 |
| Alpha Counter | 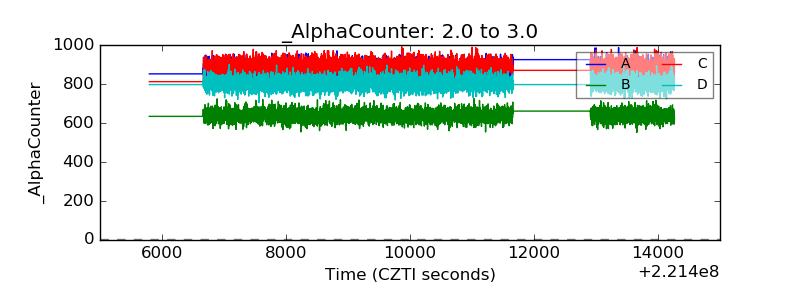 |
| _CPM_Rate | 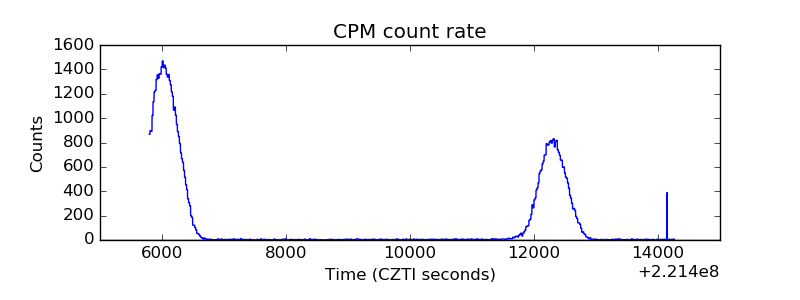 |
| CZT Counter | 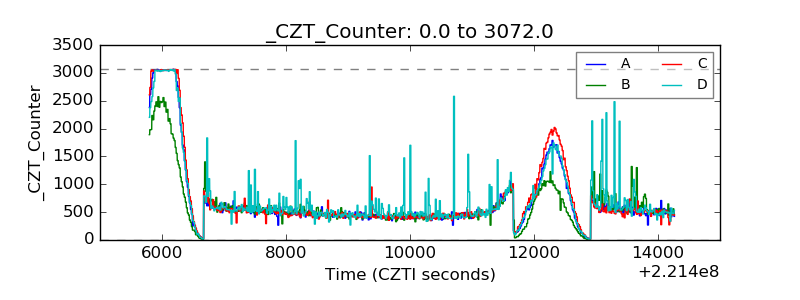 |
| +2.5 Volts monitor |  |
| +5 Volts monitor | 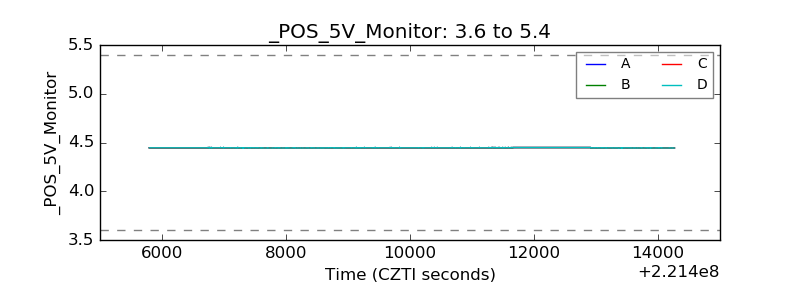 |
| _ROLL_ROT | 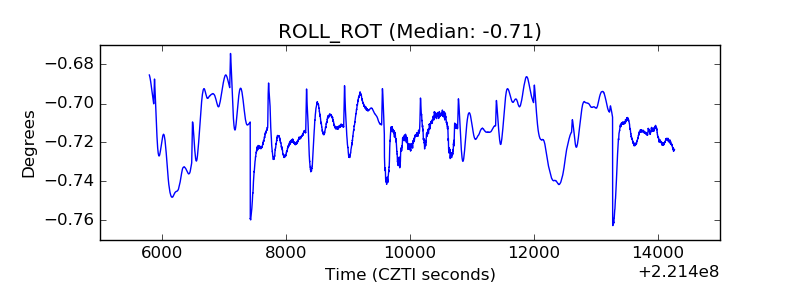 |
| _Roll_DEC | 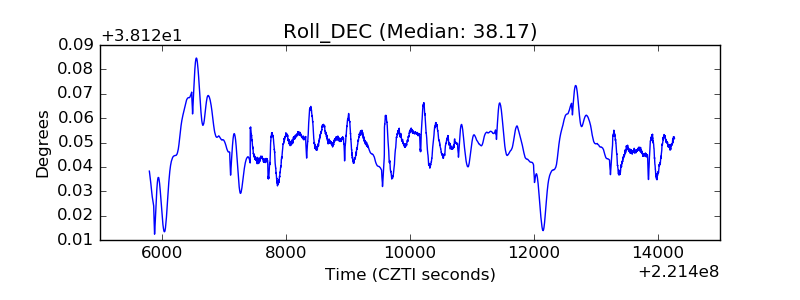 |
| _Roll_RA | 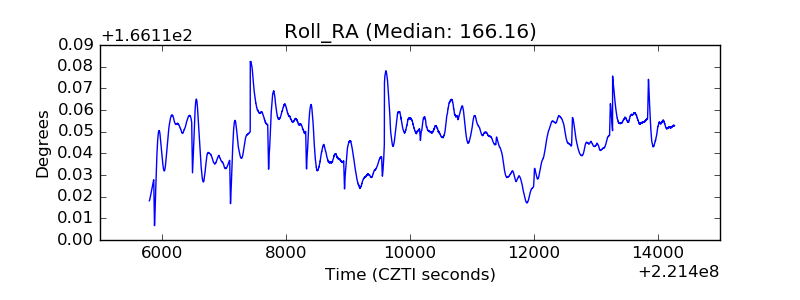 |
| Veto Counter | 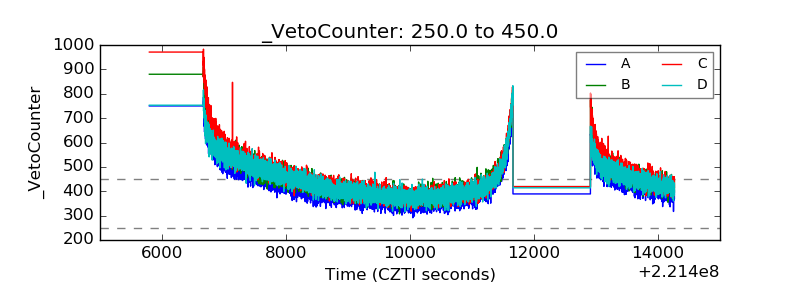 |