| Param | Original file | Final file |
|---|---|---|
| Filename | modeM0/AS1A02_005T01_9000000948_06908cztM0_level2.evt | modeM0/AS1A02_005T01_9000000948_06908cztM0_level2_quad_clean.evt |
| Size (bytes) | 496,529,280 | 94,435,200 |
| Size | 473.5 MB | 90.1 MB |
| Events in quadrant A | 3,458,258 | 587,482 |
| Events in quadrant B | 3,679,789 | 594,795 |
| Events in quadrant C | 3,367,568 | 591,176 |
| Events in quadrant D | 4,027,030 | 569,220 |
| Mode SS | |||
|---|---|---|---|
| Quadrant | BADHDUFLAG | Total packets | Discarded packets |
| A | 0 | 152 | 0 |
| B | 0 | 152 | 0 |
| C | 0 | 152 | 0 |
| D | 0 | 152 | 0 |
| Mode M0 | |||
|---|---|---|---|
| Quadrant | BADHDUFLAG | Total packets | Discarded packets |
| A | 0 | 15427 | 2 |
| B | 0 | 16100 | 1 |
| C | 0 | 15265 | 1 |
| D | 0 | 17142 | 1 |
| Mode M9 | |||
|---|---|---|---|
| Quadrant | BADHDUFLAG | Total packets | Discarded packets |
| A | 0 | 2 | 0 |
| B | 0 | 2 | 0 |
| C | 0 | 2 | 0 |
| D | 0 | 2 | 0 |
| Quadrant | Total seconds | Saturated seconds | Saturation percentage |
|---|---|---|---|
| A | 7434 | 36 | 0.484262% |
| B | 7434 | 89 | 1.197202% |
| C | 7434 | 48 | 0.645682% |
| D | 7434 | 88 | 1.183750% |
Noise dominated data is calculated using 1-second bins in cleaned event files. If a bin has >2000 counts, and if more than 50% of those come from <1% of pixels, then it is considered to be noise-dominated and hence unusable.
| Quadrant | # 1 sec bins | Bins with >0 counts | Bins with >2000 counts | High rate bins dominated by noise | Noise dominated (total time) | Noise dominated (detector-on time) | Marked lightcurve |
|---|---|---|---|---|---|---|---|
| A | 7649 | 7436 | 0 | 0 | 0.00% | 0.00% | 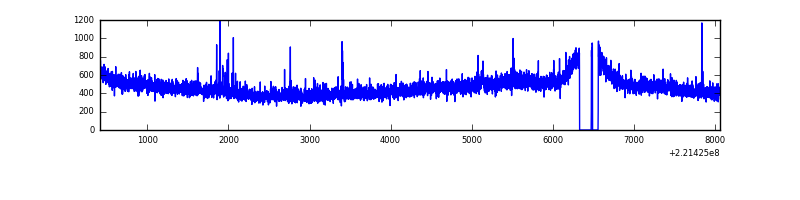 |
| B | 7649 | 7436 | 9 | 9 | 0.12% | 0.12% | 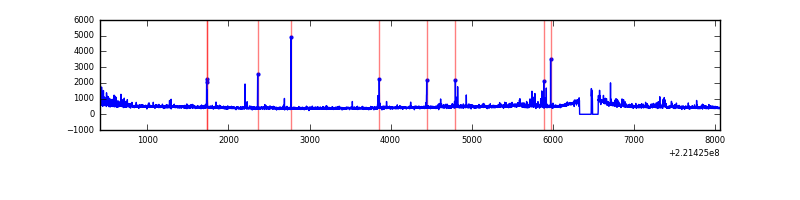 |
| C | 7649 | 7436 | 0 | 0 | 0.00% | 0.00% | 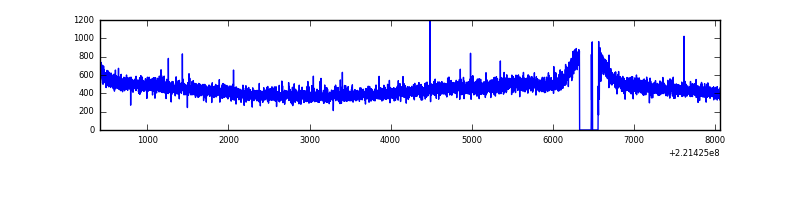 |
| D | 7649 | 7436 | 46 | 46 | 0.60% | 0.62% | 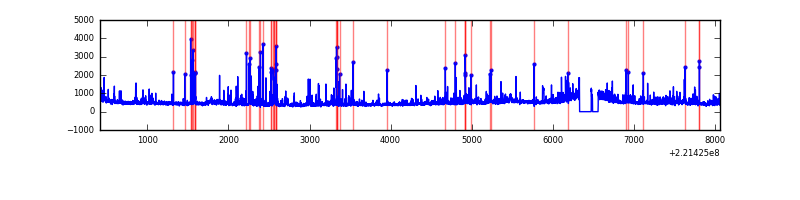 |
Top three noisy pixels from each quadrant. If the there are fewer than three noisy pixels in the level2.evt file, extra rows are filled as -1
| Pixel properties | Quadrant properties | ||||||
|---|---|---|---|---|---|---|---|
| Quadrant | DetID | PixID | Counts | Sigma | Mean | Median | Sigma |
| A | 8 | 15 | 58025 | 321.52 | 869 | 849 | 177.8 |
| A | 4 | 2 | 23663 | 128.29 | 869 | 849 | 177.8 |
| A | 0 | 23 | 13185 | 69.37 | 869 | 849 | 177.8 |
| B | 4 | 173 | 74973 | 443.37 | 877 | 857 | 167.2 |
| B | 4 | 81 | 73330 | 433.54 | 877 | 857 | 167.2 |
| B | 0 | 228 | 35804 | 209.06 | 877 | 857 | 167.2 |
| C | 9 | 247 | 28788 | 141.92 | 847 | 851 | 196.9 |
| C | 8 | 128 | 13031 | 61.87 | 847 | 851 | 196.9 |
| C | 8 | 112 | 7196 | 32.23 | 847 | 851 | 196.9 |
| D | 2 | 216 | 340160 | 1631.48 | 846 | 819 | 208.0 |
| D | 2 | 136 | 139449 | 666.5 | 846 | 819 | 208.0 |
| D | 1 | 20 | 94862 | 452.14 | 846 | 819 | 208.0 |
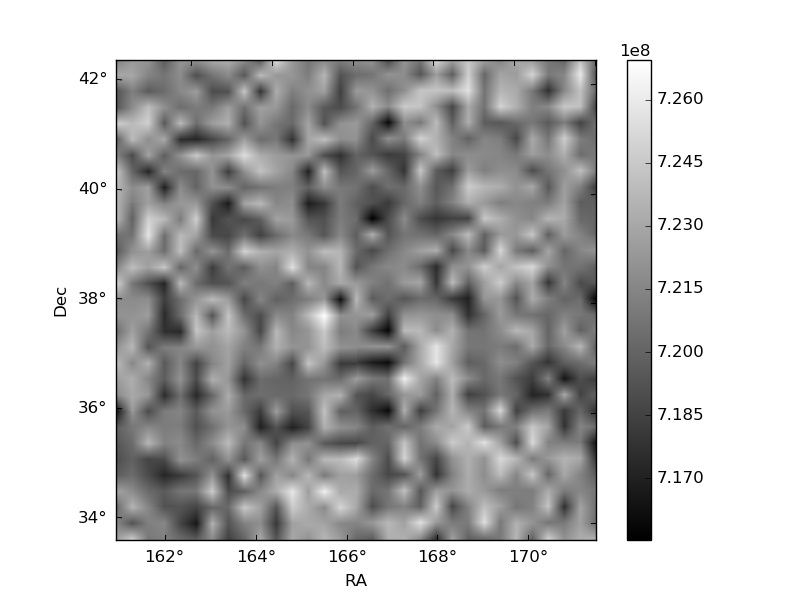
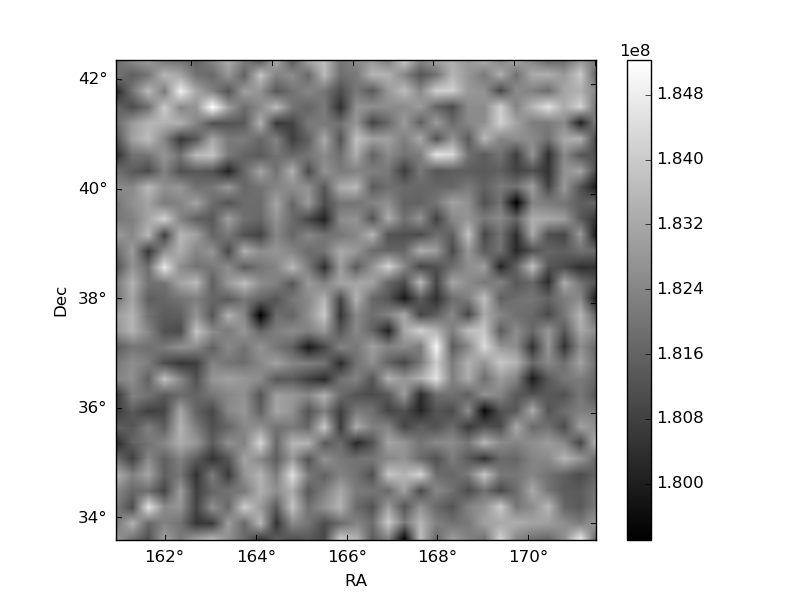
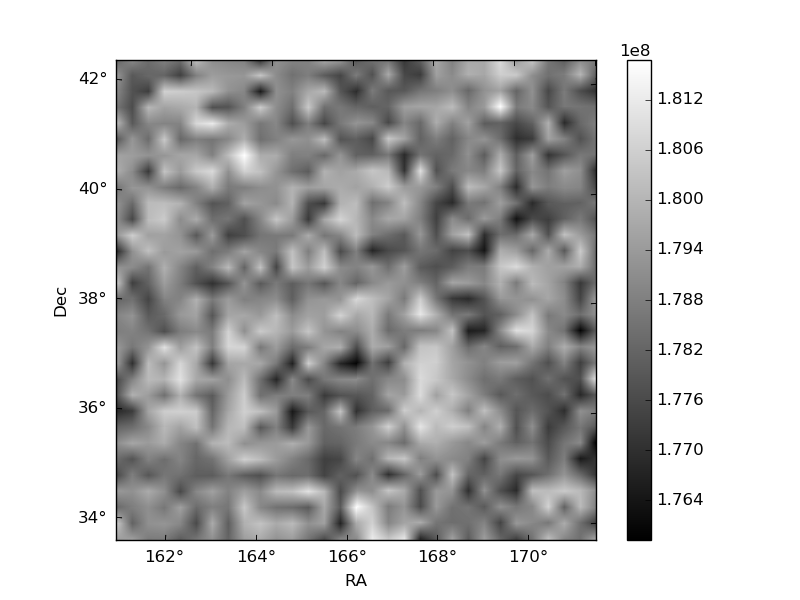
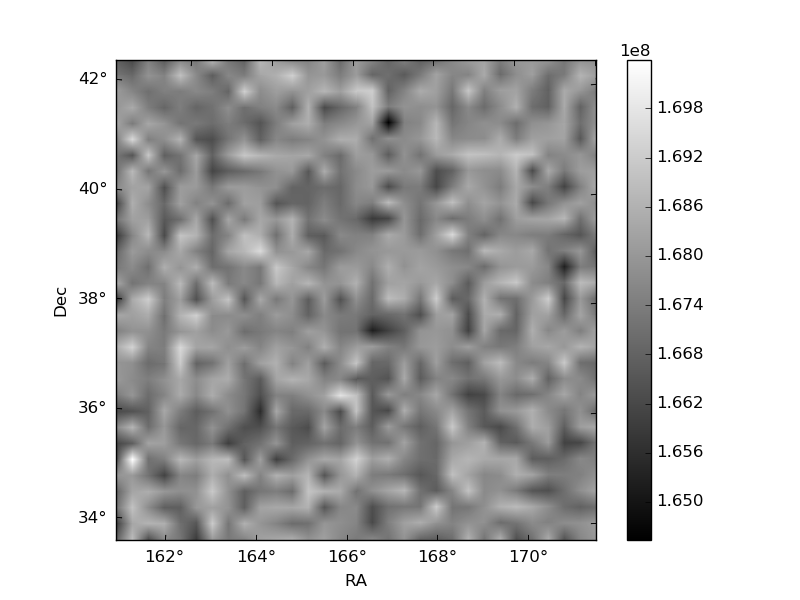
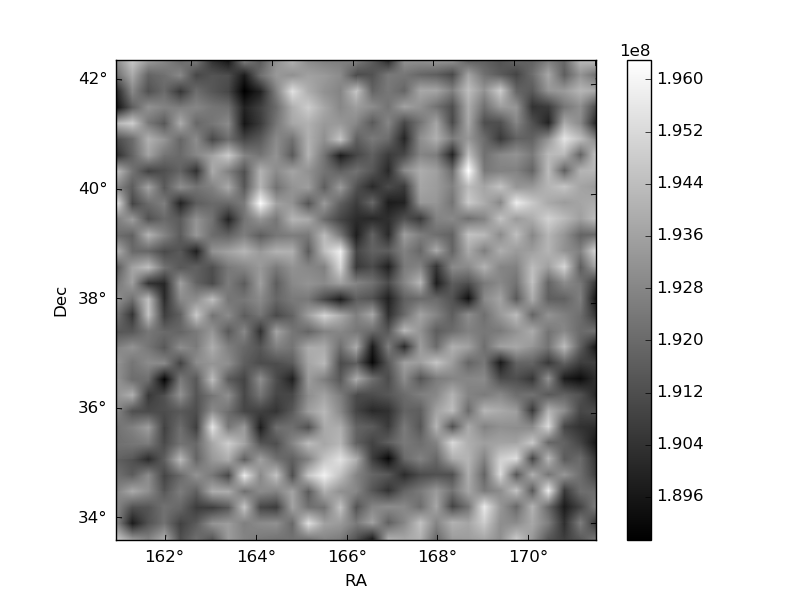
Histogram calculated using DETX and DETY for each event in the final _common_clean file
| Quadrant A | 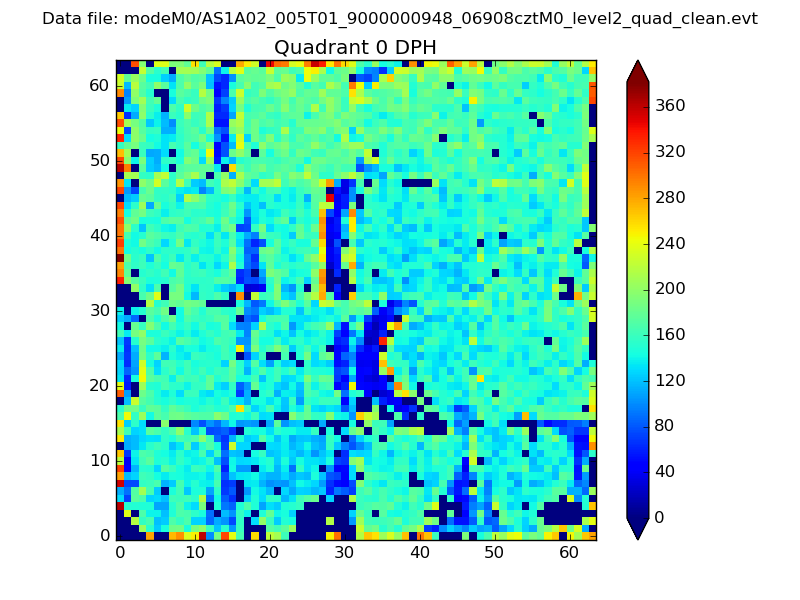 |
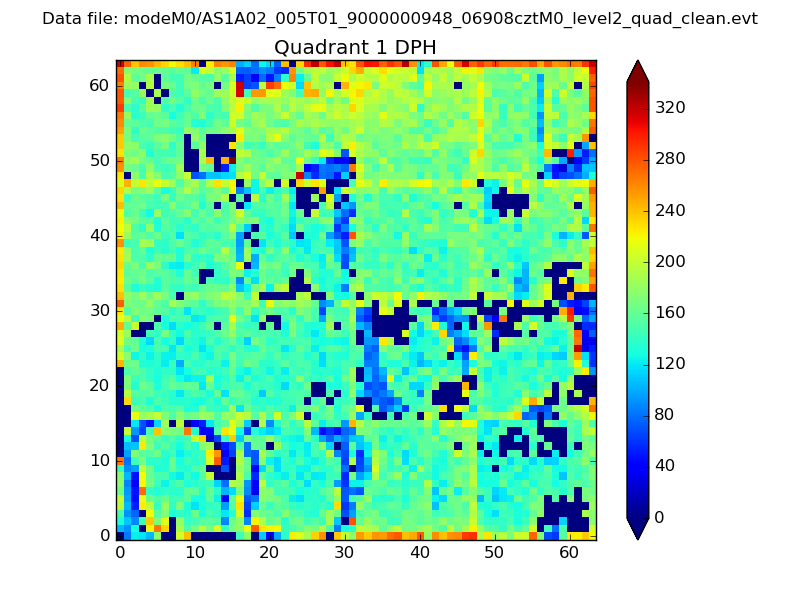 |
Quadrant B |
|---|---|---|---|
| Quadrant D | 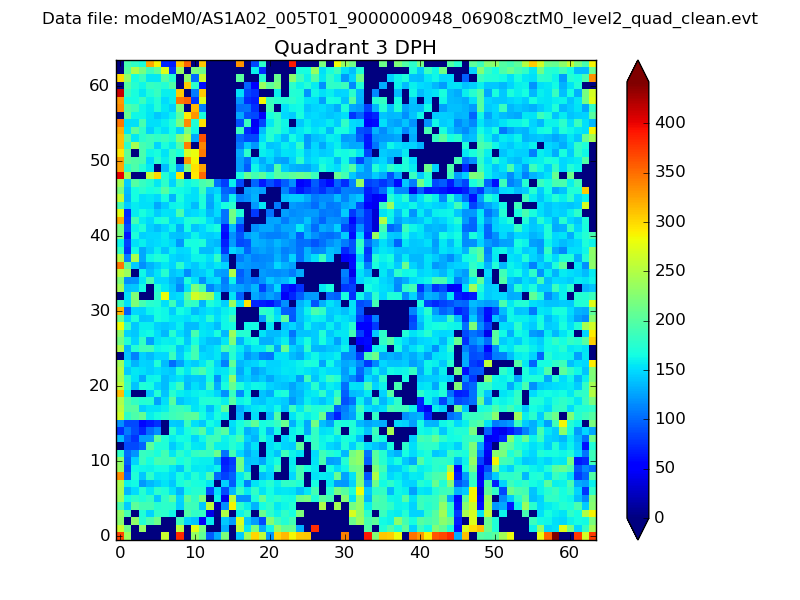 |
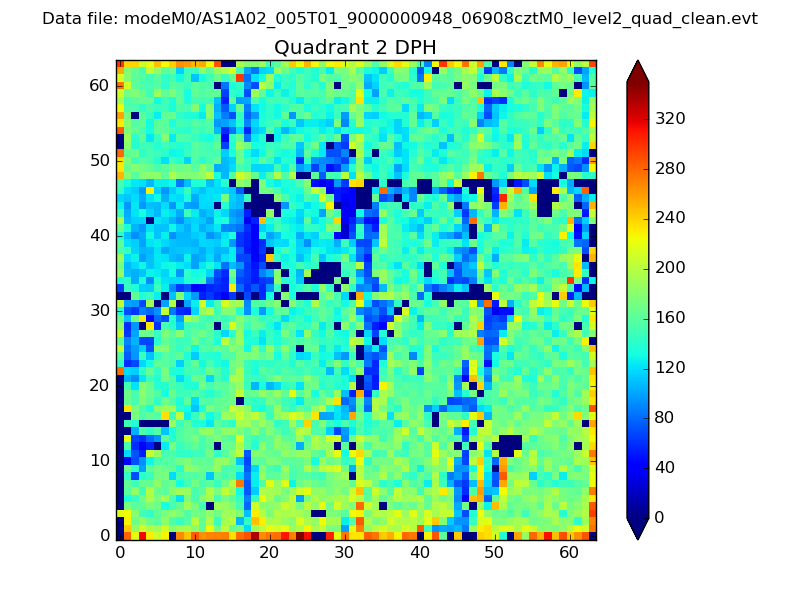 |
Quadrant C |
| Plot type | Count rate plots | Images |
|---|---|---|
| Comparison with Poisson distribution Blue bars denote a histogram of data divided into 1 sec bins. Red curve is a Poisson curve with rate = median count rate of data. |
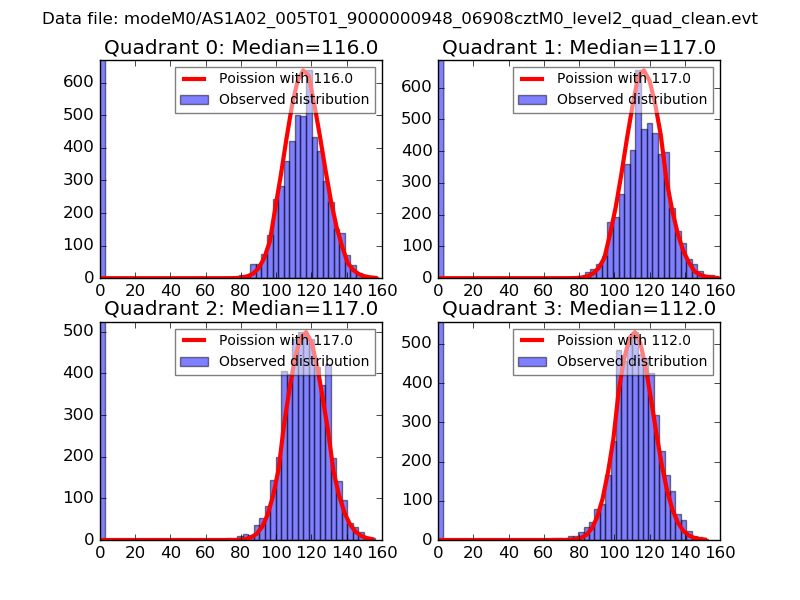 |
 |
| Quadrant-wise count rates Data is divided into 100 sec bins |
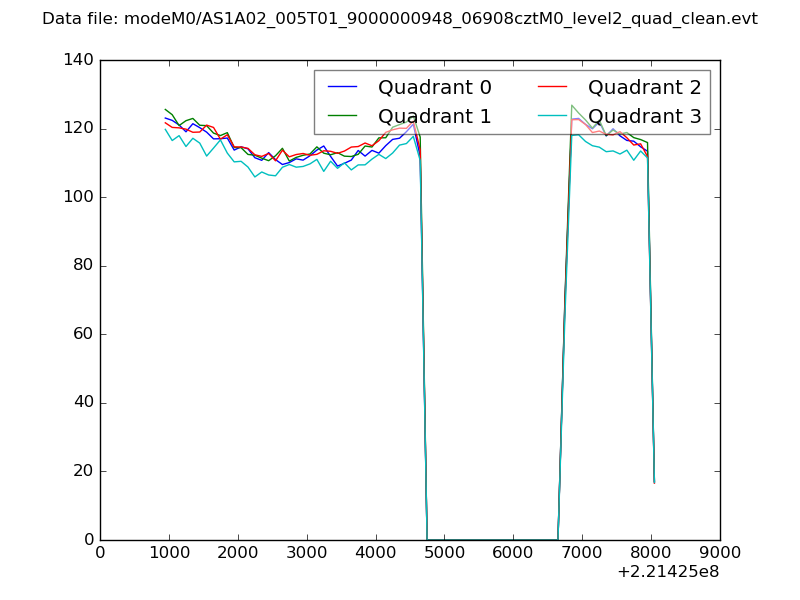 |
|
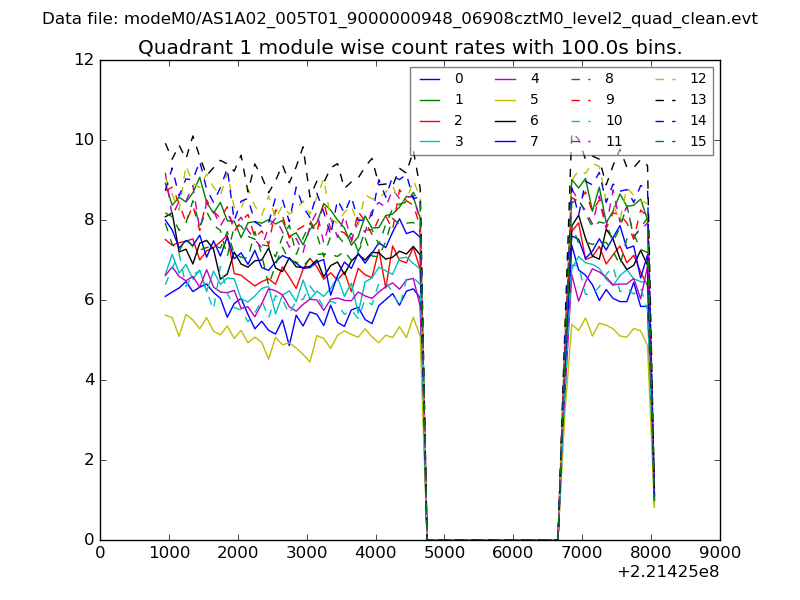
| Module-wise count rates for Quadrant A Data is divided into 100 sec bins |
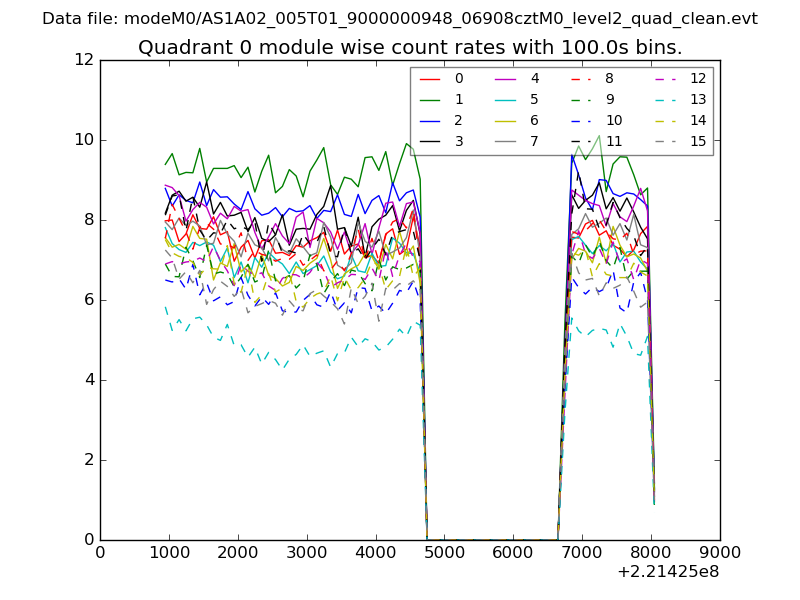 |
 |
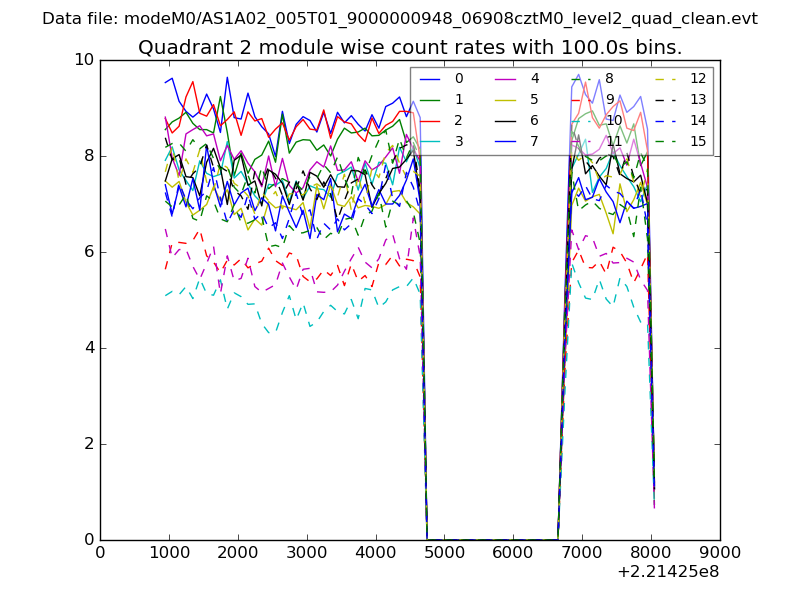
| Module-wise count rates for Quadrant B Data is divided into 100 sec bins |
 |
 |
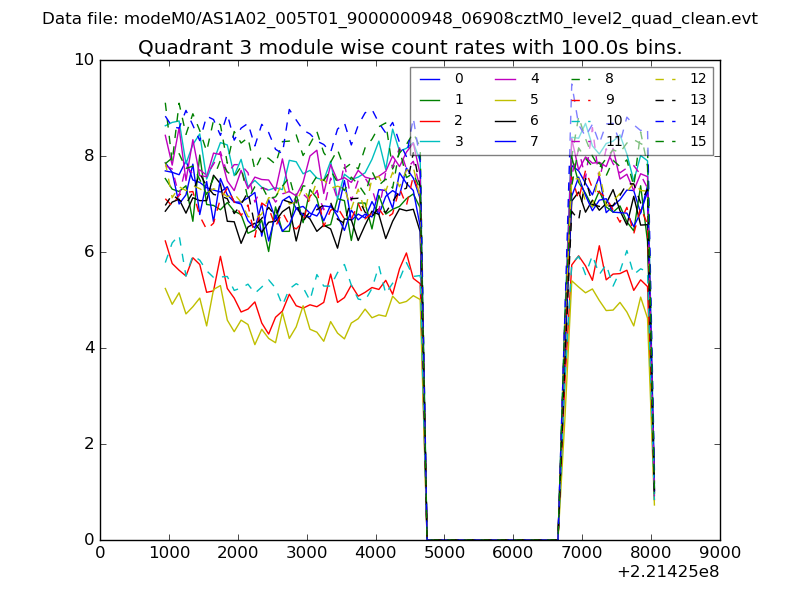
| Module-wise count rates for Quadrant C Data is divided into 100 sec bins |
 |
 |
| Module-wise count rates for Quadrant D Data is divided into 100 sec bins |
 |
 |
| Parameter | Plot |
|---|---|
| CZT HV Monitor | 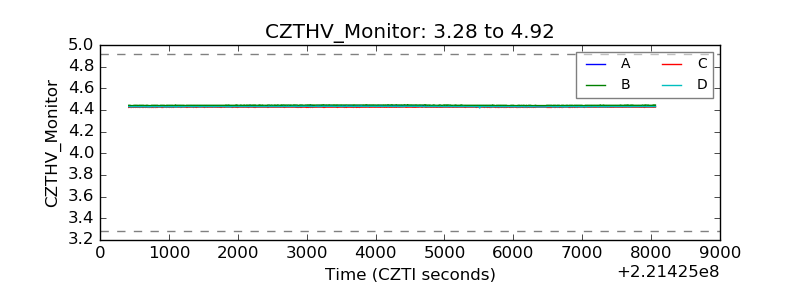 |
| D_VDD | 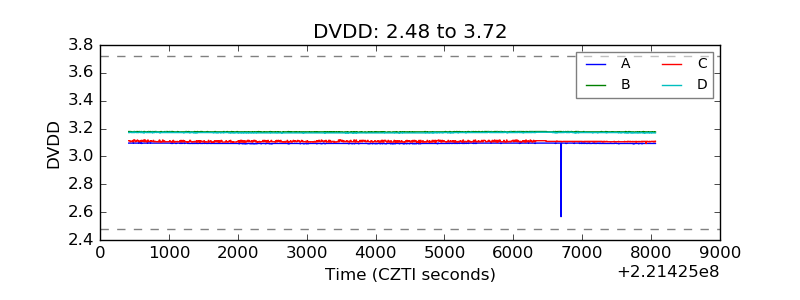 |
| Temperature 1 | 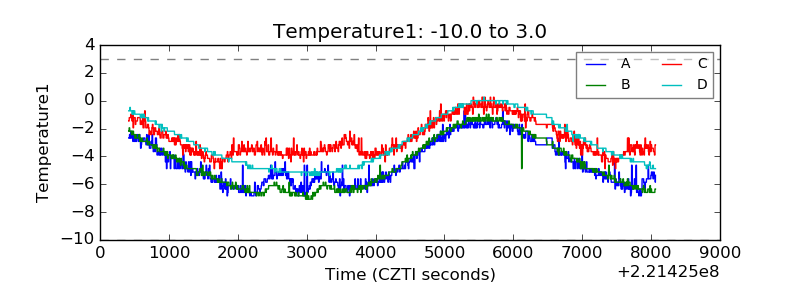 |
| Veto HV Monitor | 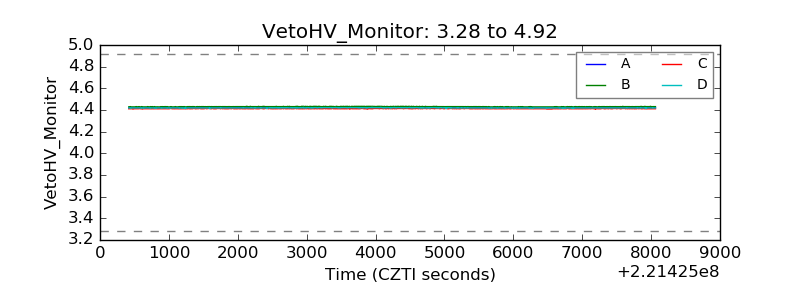 |
| Veto LLD | 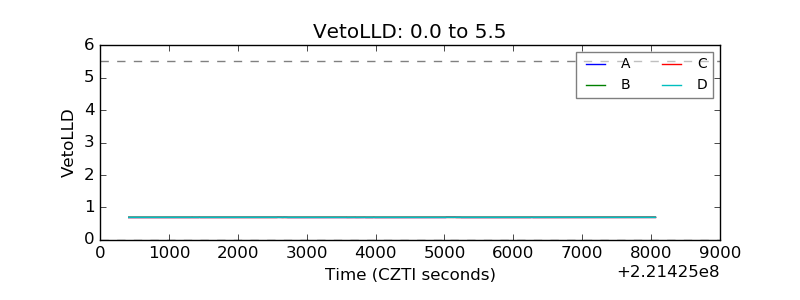 |
| Alpha Counter | 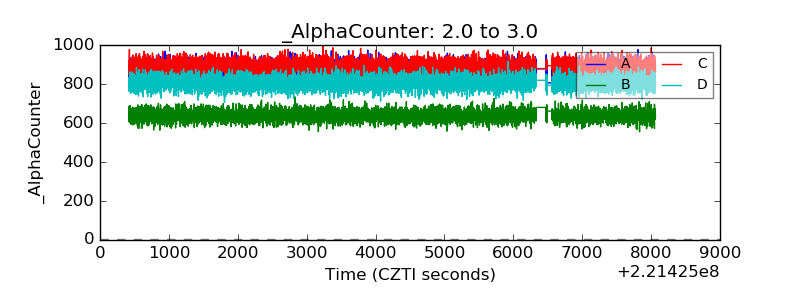 |
| _CPM_Rate | 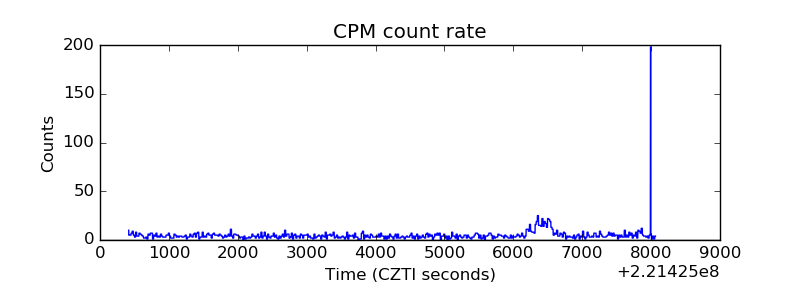 |
| CZT Counter | 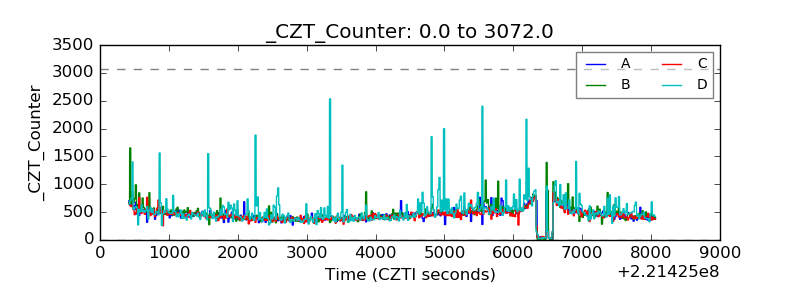 |
| +2.5 Volts monitor |  |
| +5 Volts monitor | 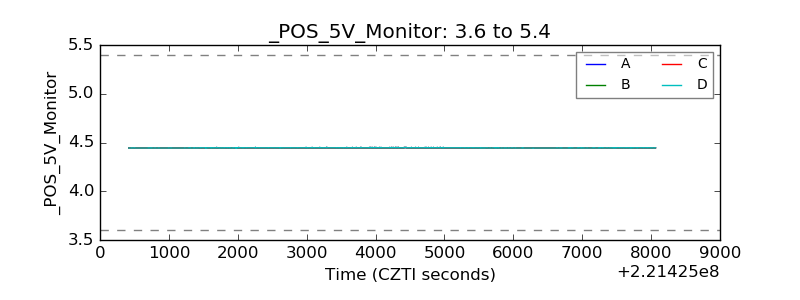 |
| _ROLL_ROT | 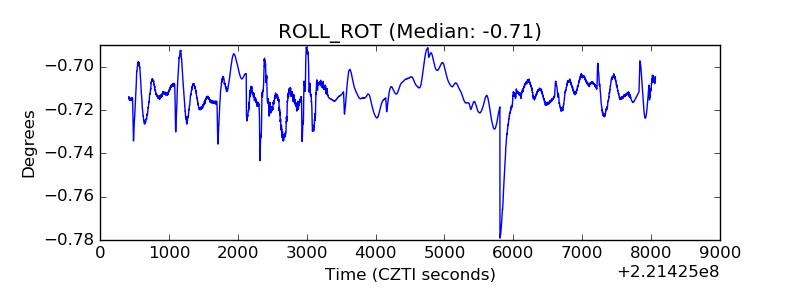 |
| _Roll_DEC | 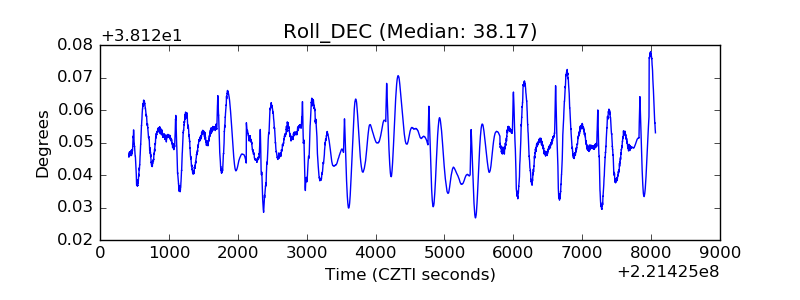 |
| _Roll_RA | 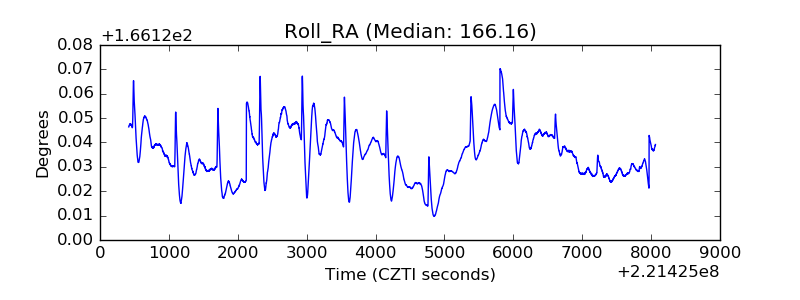 |
| Veto Counter | 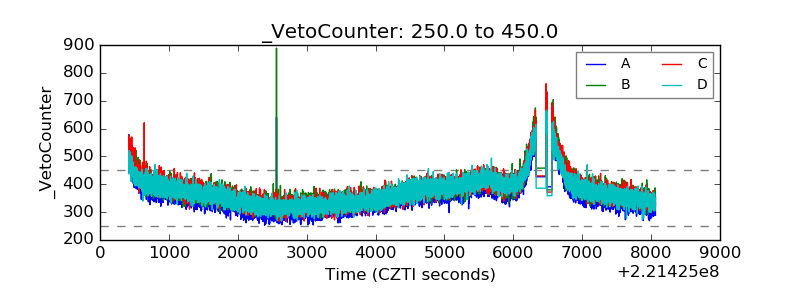 |