| Param | Original file | Final file |
|---|---|---|
| Filename | modeM0/AS1A02_005T01_9000000948_06909cztM0_level2.evt | modeM0/AS1A02_005T01_9000000948_06909cztM0_level2_quad_clean.evt |
| Size (bytes) | 534,703,680 | 100,846,080 |
| Size | 509.9 MB | 96.2 MB |
| Events in quadrant A | 3,604,633 | 631,269 |
| Events in quadrant B | 4,348,290 | 641,118 |
| Events in quadrant C | 3,583,827 | 632,564 |
| Events in quadrant D | 4,131,691 | 611,381 |
| Mode SS | |||
|---|---|---|---|
| Quadrant | BADHDUFLAG | Total packets | Discarded packets |
| A | 0 | 158 | 0 |
| B | 0 | 158 | 0 |
| C | 0 | 158 | 0 |
| D | 0 | 158 | 0 |
| Mode M0 | |||
|---|---|---|---|
| Quadrant | BADHDUFLAG | Total packets | Discarded packets |
| A | 0 | 16242 | 3 |
| B | 0 | 18514 | 2 |
| C | 0 | 16164 | 2 |
| D | 0 | 17752 | 2 |
| Mode M9 | |||
|---|---|---|---|
| Quadrant | BADHDUFLAG | Total packets | Discarded packets |
| A | 0 | 2 | 0 |
| B | 0 | 2 | 0 |
| C | 0 | 2 | 0 |
| D | 0 | 2 | 0 |
| Quadrant | Total seconds | Saturated seconds | Saturation percentage |
|---|---|---|---|
| A | 7733 | 95 | 1.228501% |
| B | 7733 | 352 | 4.551920% |
| C | 7733 | 97 | 1.254364% |
| D | 7734 | 106 | 1.370572% |
Noise dominated data is calculated using 1-second bins in cleaned event files. If a bin has >2000 counts, and if more than 50% of those come from <1% of pixels, then it is considered to be noise-dominated and hence unusable.
| Quadrant | # 1 sec bins | Bins with >0 counts | Bins with >2000 counts | High rate bins dominated by noise | Noise dominated (total time) | Noise dominated (detector-on time) | Marked lightcurve |
|---|---|---|---|---|---|---|---|
| A | 7893 | 7735 | 0 | 0 | 0.00% | 0.00% |  |
| B | 7893 | 7735 | 68 | 68 | 0.86% | 0.88% |  |
| C | 7893 | 7735 | 1 | 1 | 0.01% | 0.01% |  |
| D | 7894 | 7736 | 48 | 48 | 0.61% | 0.62% |  |
Top three noisy pixels from each quadrant. If the there are fewer than three noisy pixels in the level2.evt file, extra rows are filled as -1
| Pixel properties | Quadrant properties | ||||||
|---|---|---|---|---|---|---|---|
| Quadrant | DetID | PixID | Counts | Sigma | Mean | Median | Sigma |
| A | 8 | 15 | 36088 | 186.27 | 914 | 893 | 188.9 |
| A | 14 | 111 | 15158 | 75.5 | 914 | 893 | 188.9 |
| A | 4 | 2 | 13989 | 69.31 | 914 | 893 | 188.9 |
| B | 0 | 228 | 536780 | 3025.76 | 920 | 897 | 177.1 |
| B | 4 | 173 | 92549 | 517.5 | 920 | 897 | 177.1 |
| B | 4 | 48 | 48841 | 270.71 | 920 | 897 | 177.1 |
| C | 9 | 247 | 73779 | 349.68 | 891 | 895 | 208.4 |
| C | 9 | 54 | 14621 | 65.85 | 891 | 895 | 208.4 |
| C | 13 | 61 | 7104 | 29.79 | 891 | 895 | 208.4 |
| D | 2 | 216 | 363254 | 1647.81 | 889 | 859 | 219.9 |
| D | 1 | 20 | 122506 | 553.13 | 889 | 859 | 219.9 |
| D | 8 | 195 | 111872 | 504.77 | 889 | 859 | 219.9 |
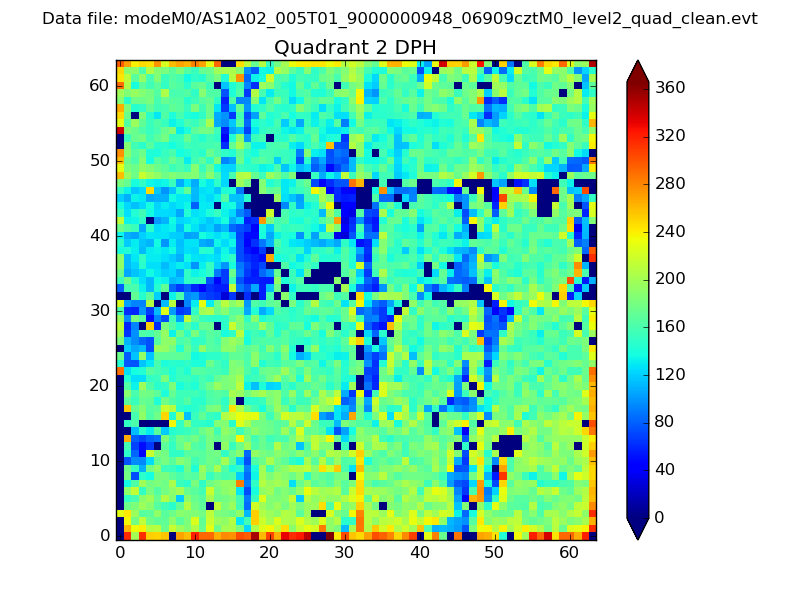
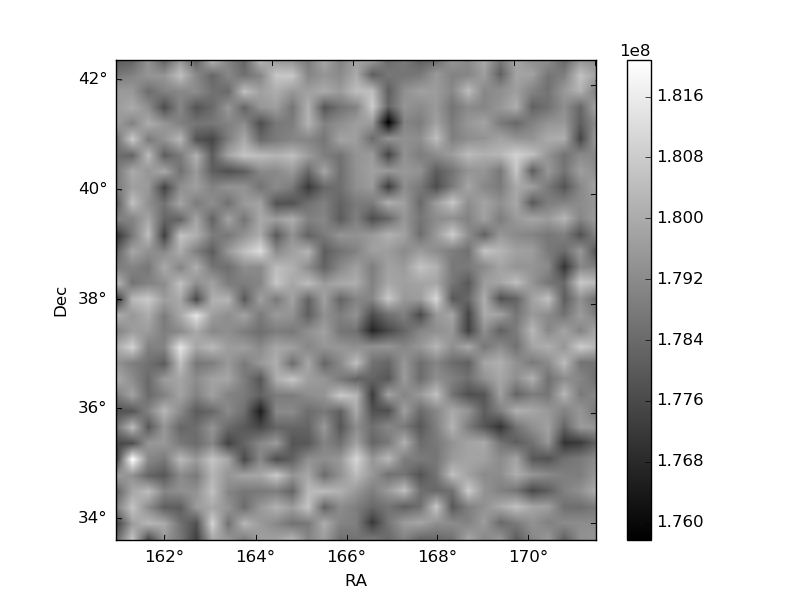
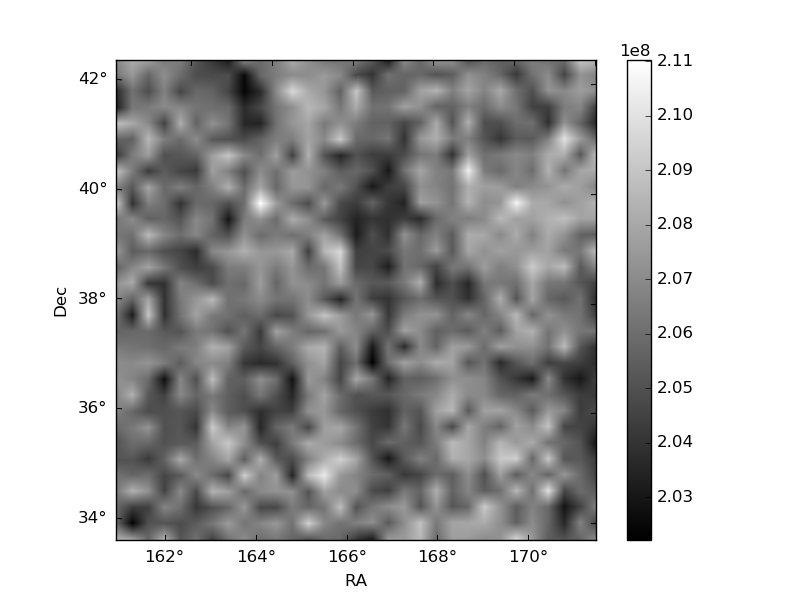
Histogram calculated using DETX and DETY for each event in the final _common_clean file
| Quadrant A | 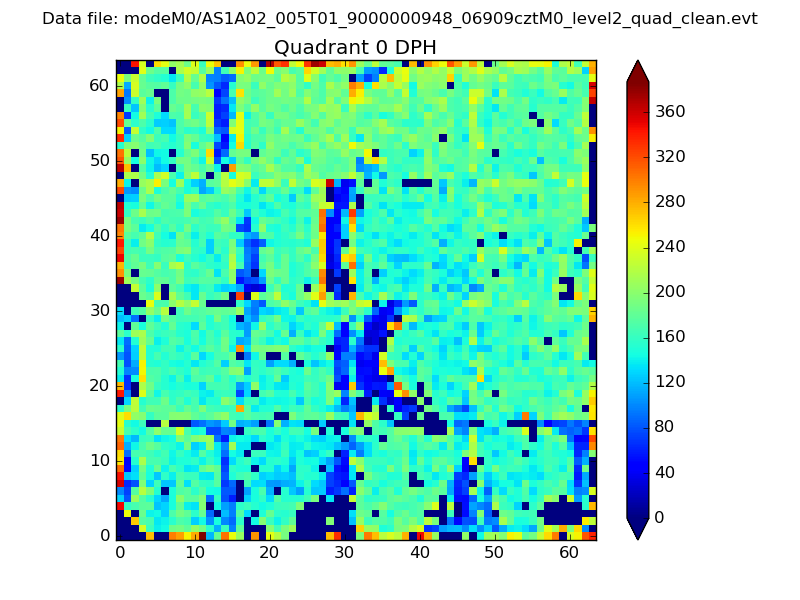 |
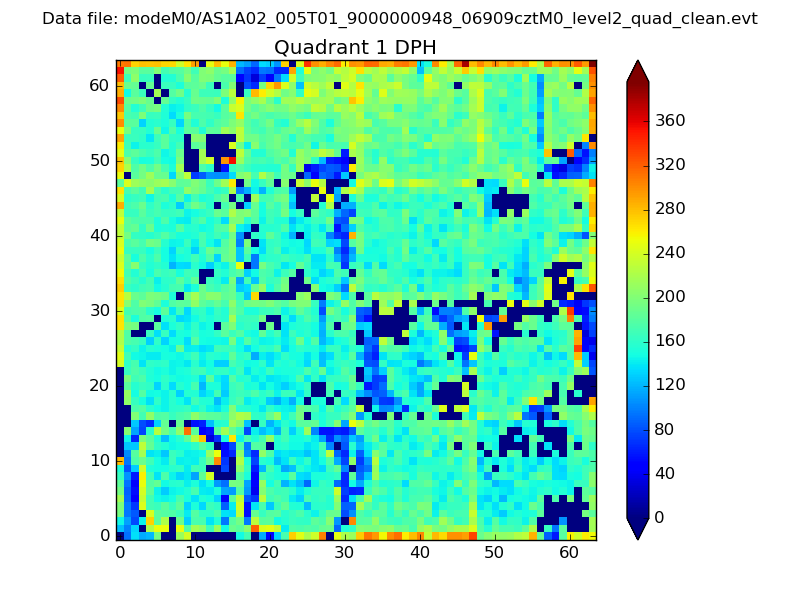 |
Quadrant B |
|---|---|---|---|
| Quadrant D | 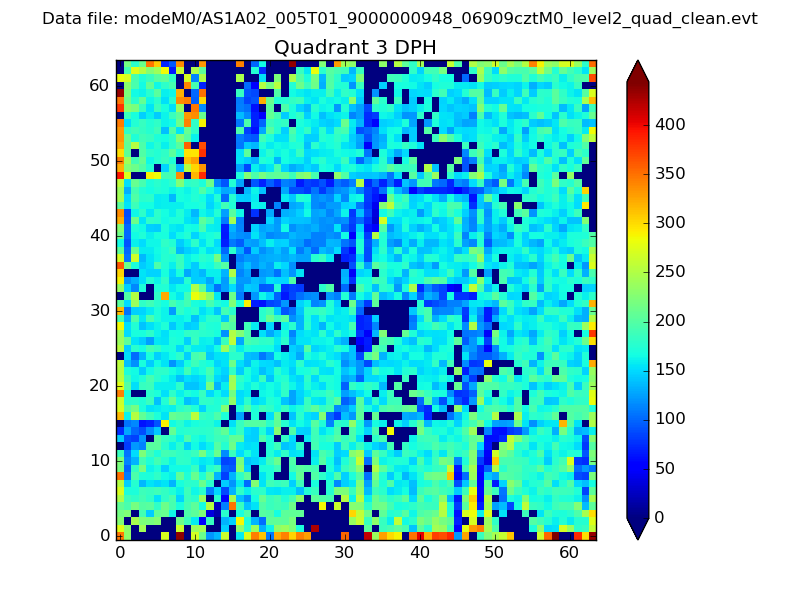 |
 |
Quadrant C |
| Plot type | Count rate plots | Images |
|---|---|---|
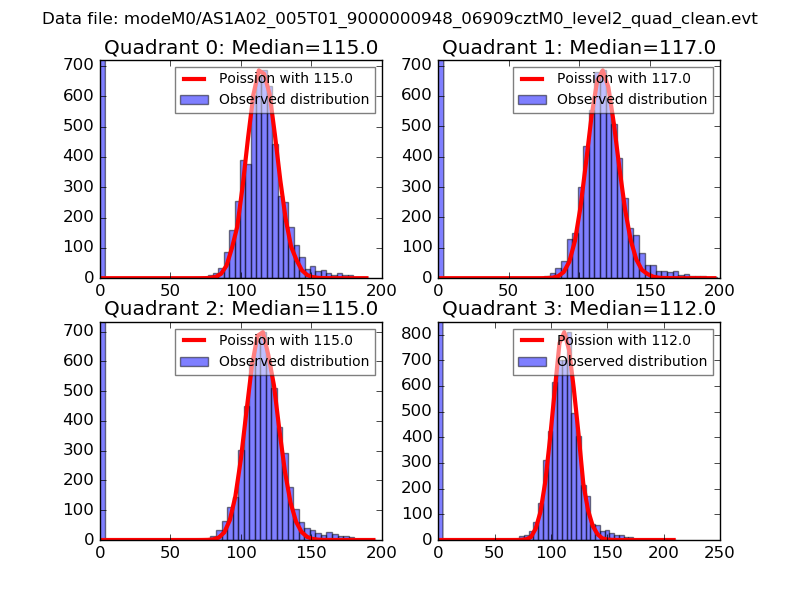
| Comparison with Poisson distribution Blue bars denote a histogram of data divided into 1 sec bins. Red curve is a Poisson curve with rate = median count rate of data. |
 |
 |
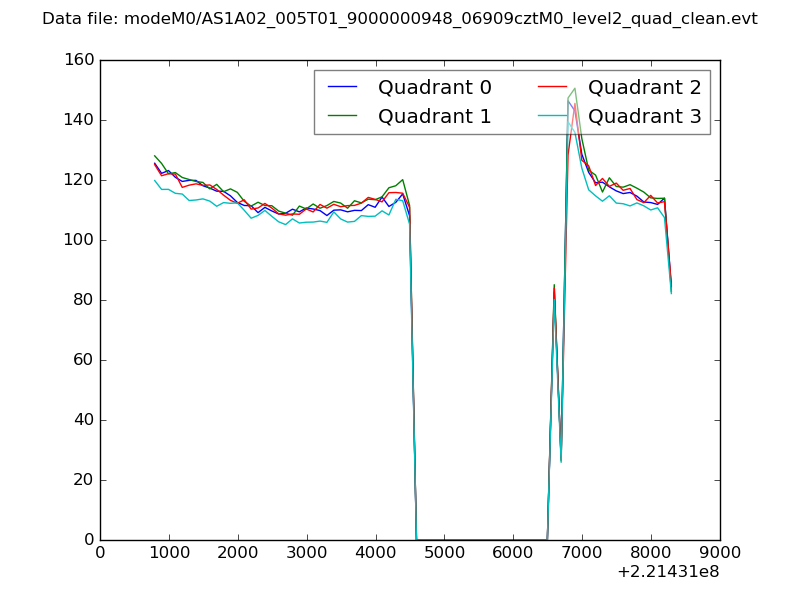
| Quadrant-wise count rates Data is divided into 100 sec bins |
 |
|
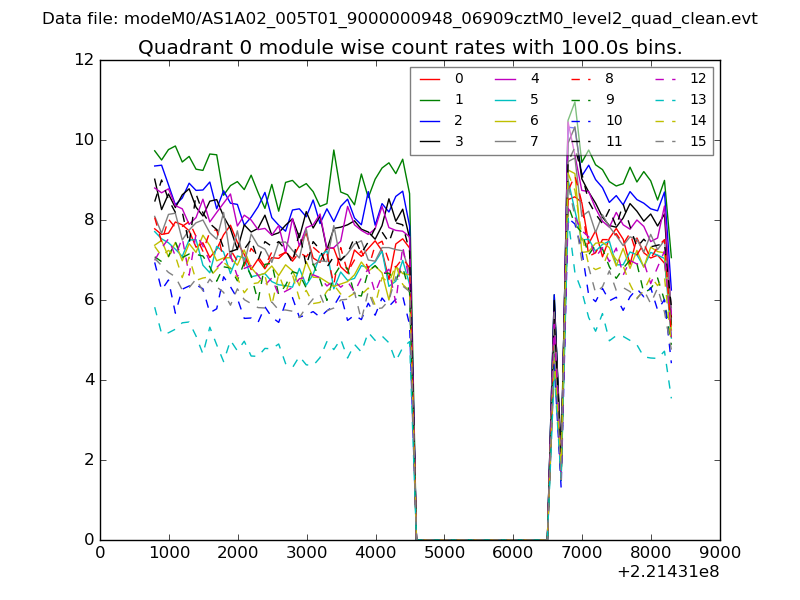
| Module-wise count rates for Quadrant A Data is divided into 100 sec bins |
 |
 |
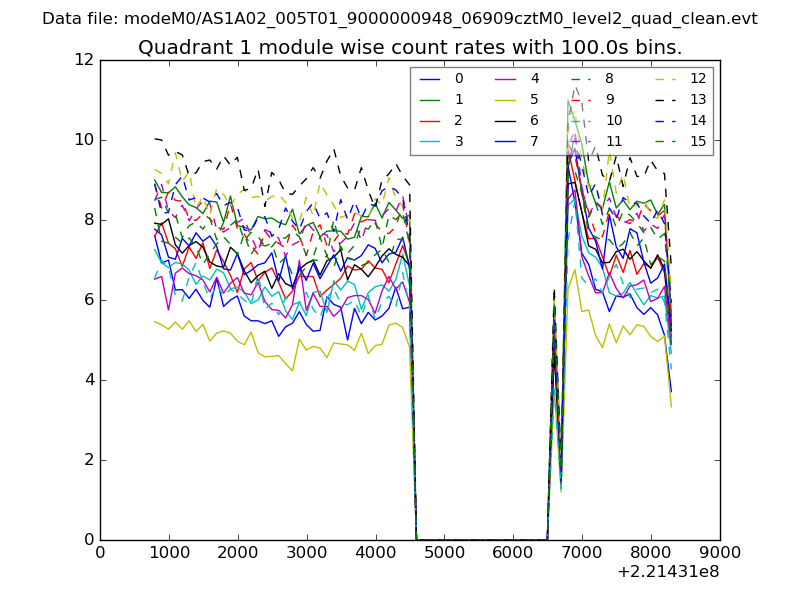
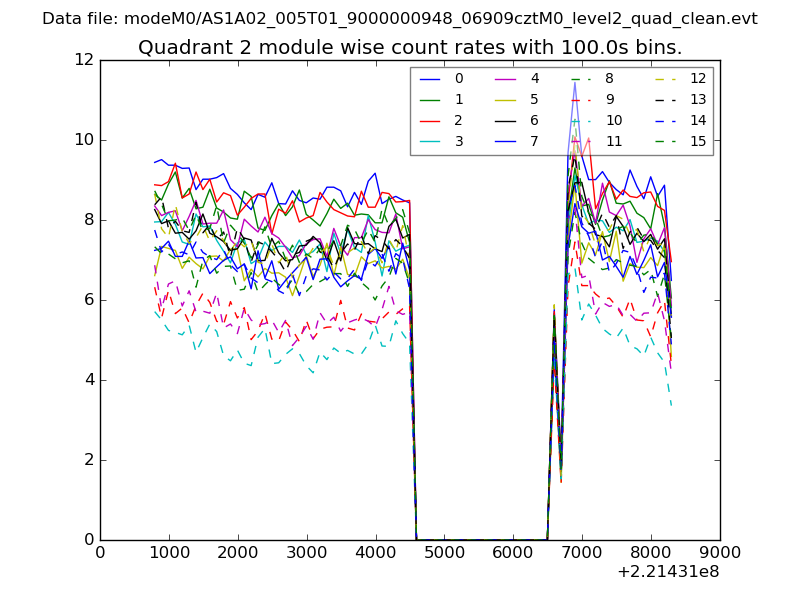
| Module-wise count rates for Quadrant B Data is divided into 100 sec bins |
 |
 |
| Module-wise count rates for Quadrant C Data is divided into 100 sec bins |
 |
 |
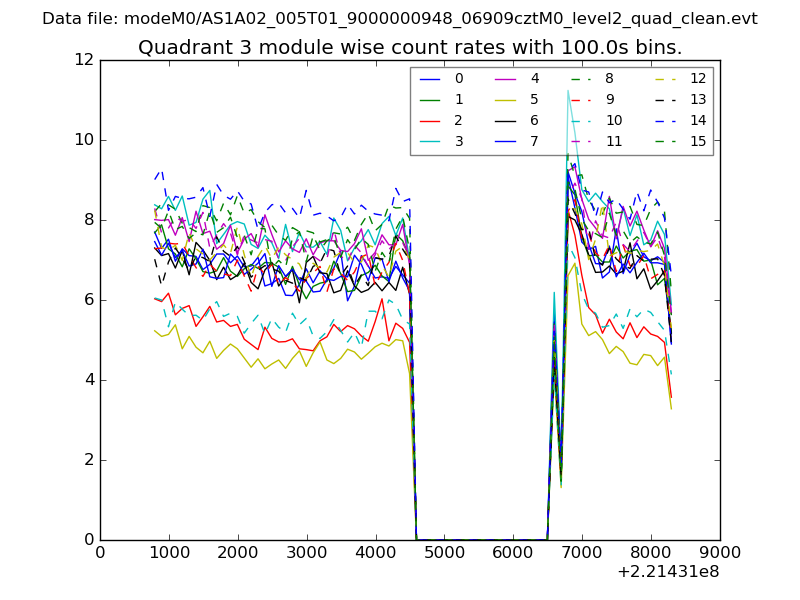
| Module-wise count rates for Quadrant D Data is divided into 100 sec bins |
 |
 |
| Parameter | Plot |
|---|---|
| CZT HV Monitor | 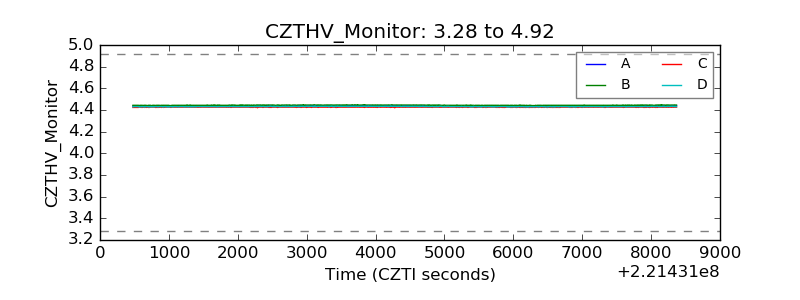 |
| D_VDD | 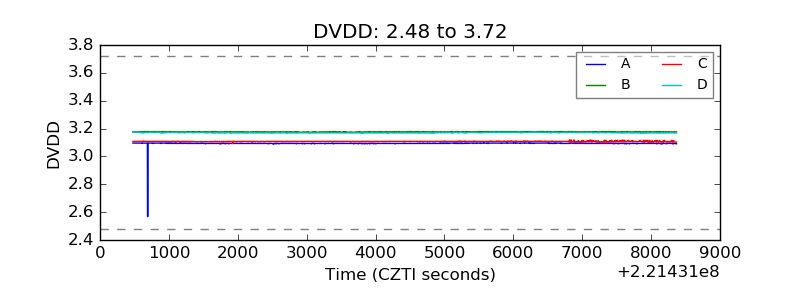 |
| Temperature 1 | 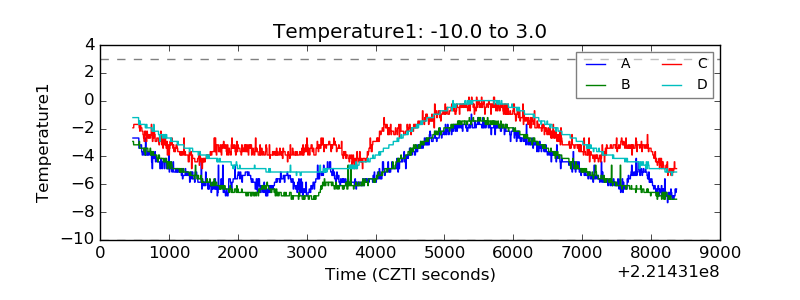 |
| Veto HV Monitor | 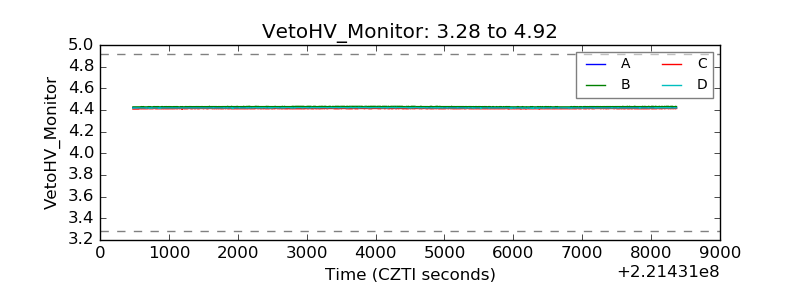 |
| Veto LLD | 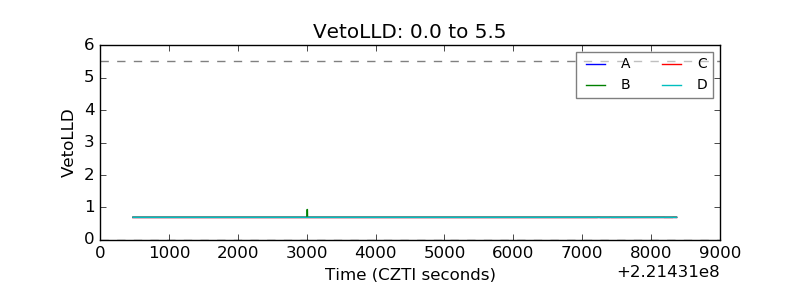 |
| Alpha Counter | 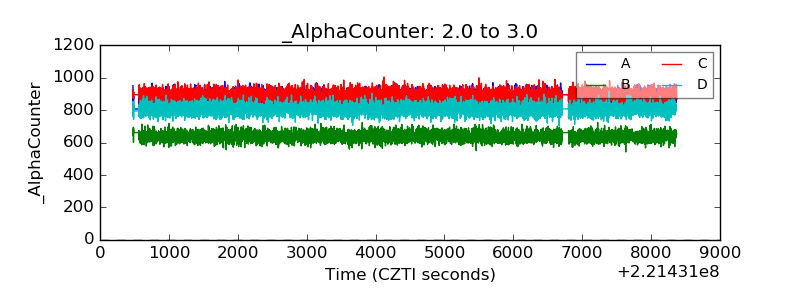 |
| _CPM_Rate | 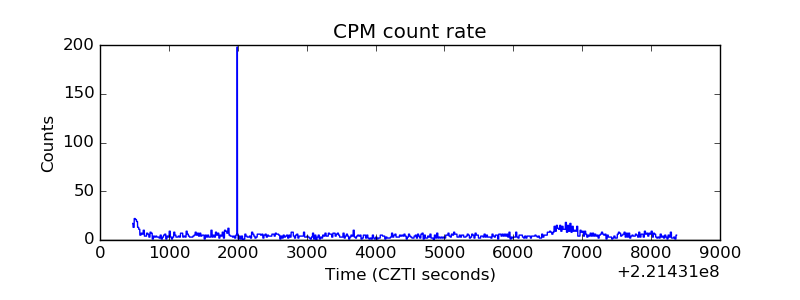 |
| CZT Counter | 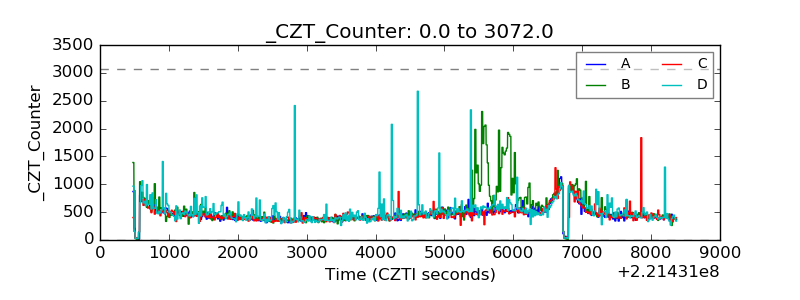 |
| +2.5 Volts monitor | 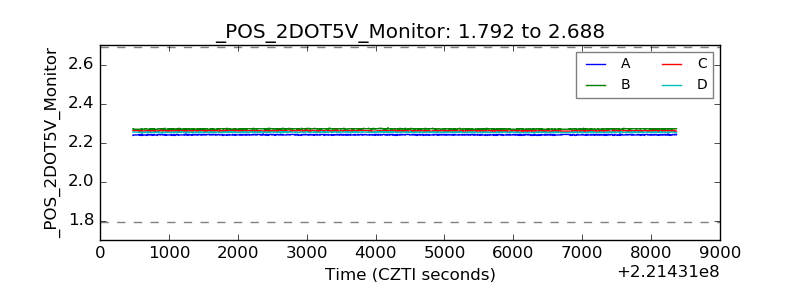 |
| +5 Volts monitor | 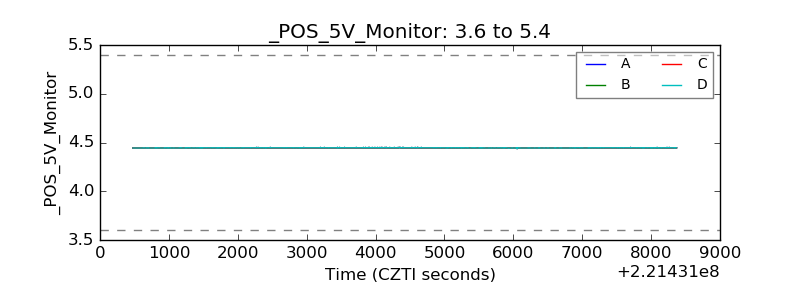 |
| _ROLL_ROT | 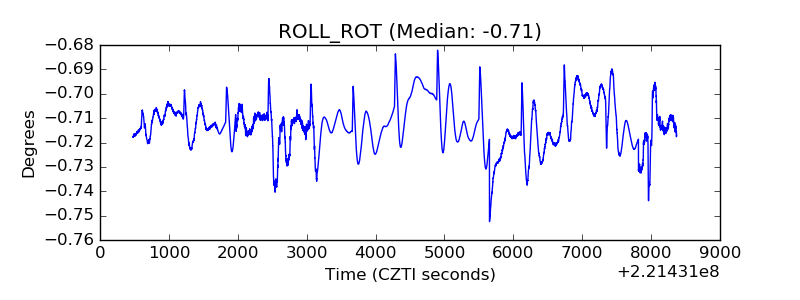 |
| _Roll_DEC | 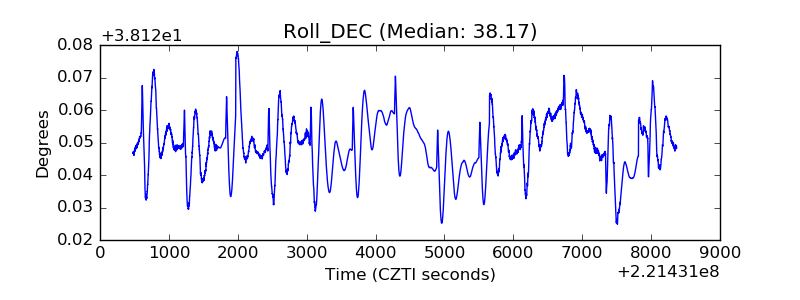 |
| _Roll_RA | 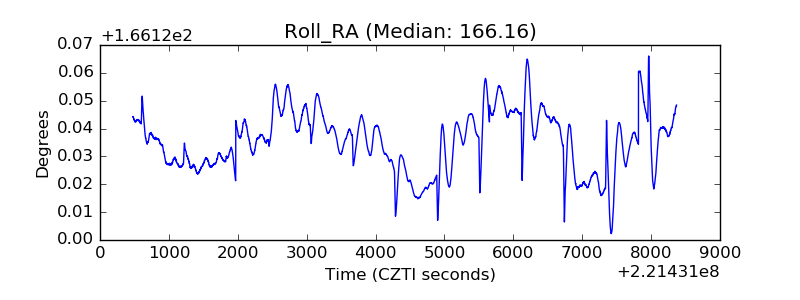 |
| Veto Counter | 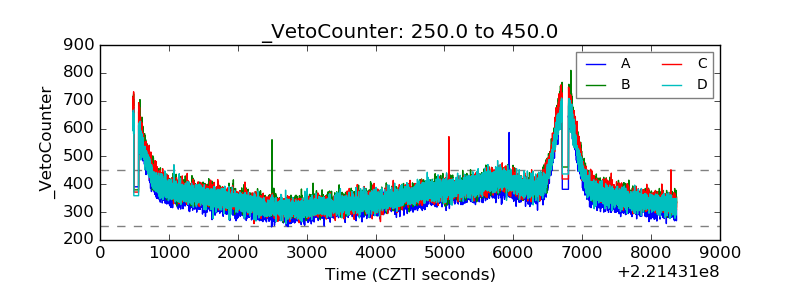 |