| Param | Original file | Final file |
|---|---|---|
| Filename | modeM0/AS1A02_005T01_9000000948_06910cztM0_level2.evt | modeM0/AS1A02_005T01_9000000948_06910cztM0_level2_quad_clean.evt |
| Size (bytes) | 51,649,920 | 14,976,000 |
| Size | 49.3 MB | 14.3 MB |
| Events in quadrant A | 347,131 | 94,763 |
| Events in quadrant B | 392,209 | 98,365 |
| Events in quadrant C | 371,762 | 97,471 |
| Events in quadrant D | 392,409 | 96,207 |
| Mode SS | |||
|---|---|---|---|
| Quadrant | BADHDUFLAG | Total packets | Discarded packets |
| A | 0 | 40 | 20 |
| B | 0 | 39 | 19 |
| C | 0 | 40 | 24 |
| D | 0 | 40 | 30 |
| Mode M0 | |||
|---|---|---|---|
| Quadrant | BADHDUFLAG | Total packets | Discarded packets |
| A | 0 | 4345 | 2685 |
| B | 0 | 4593 | 2842 |
| C | 0 | 4350 | 2644 |
| D | 0 | 4484 | 2679 |
| Mode M9 | |||
|---|---|---|---|
| Quadrant | BADHDUFLAG | Total packets | Discarded packets |
| A | 0 | 1 | 1 |
| B | 0 | 1 | 1 |
| C | 0 | 1 | 0 |
| D | 0 | 1 | 0 |
| Quadrant | Total seconds | Saturated seconds | Saturation percentage |
|---|---|---|---|
| A | 818 | 1 | 0.122249% |
| B | 843 | 7 | 0.830368% |
| C | 837 | 2 | 0.238949% |
| D | 855 | 2 | 0.233918% |
Noise dominated data is calculated using 1-second bins in cleaned event files. If a bin has >2000 counts, and if more than 50% of those come from <1% of pixels, then it is considered to be noise-dominated and hence unusable.
| Quadrant | # 1 sec bins | Bins with >0 counts | Bins with >2000 counts | High rate bins dominated by noise | Noise dominated (total time) | Noise dominated (detector-on time) | Marked lightcurve |
|---|---|---|---|---|---|---|---|
| A | 1842 | 1113 | 0 | 0 | 0.00% | 0.00% | 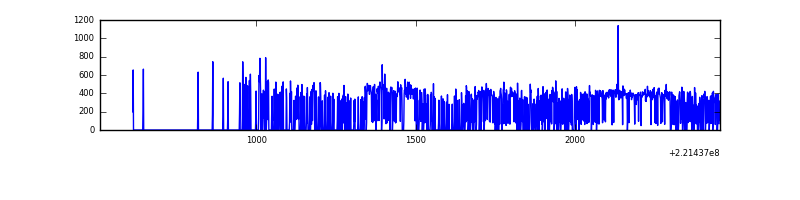 |
| B | 1947 | 1132 | 0 | 0 | 0.00% | 0.00% | 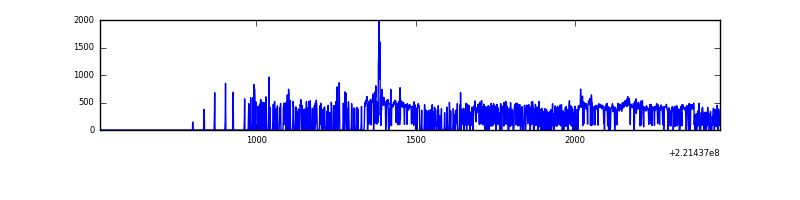 |
| C | 1904 | 1146 | 0 | 0 | 0.00% | 0.00% | 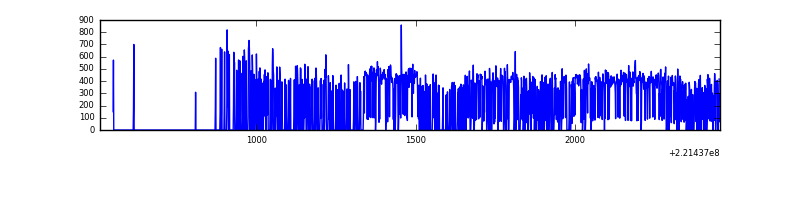 |
| D | 1614 | 1143 | 1 | 1 | 0.06% | 0.09% | 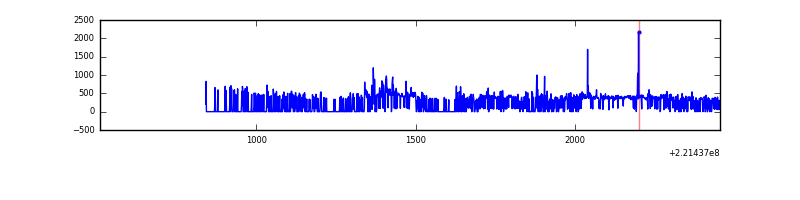 |
Top three noisy pixels from each quadrant. If the there are fewer than three noisy pixels in the level2.evt file, extra rows are filled as -1
| Pixel properties | Quadrant properties | ||||||
|---|---|---|---|---|---|---|---|
| Quadrant | DetID | PixID | Counts | Sigma | Mean | Median | Sigma |
| A | 4 | 2 | 1227 | 55.77 | 89 | 87 | 20.4 |
| A | 13 | 14 | 1181 | 53.52 | 89 | 87 | 20.4 |
| A | 0 | 226 | 850 | 37.33 | 89 | 87 | 20.4 |
| B | 4 | 80 | 9216 | 447.11 | 93 | 91 | 20.4 |
| B | 4 | 173 | 8501 | 412.08 | 93 | 91 | 20.4 |
| B | 4 | 81 | 5479 | 264.0 | 93 | 91 | 20.4 |
| C | 9 | 247 | 9088 | 384.96 | 91 | 91 | 23.4 |
| C | 8 | 128 | 1781 | 72.31 | 91 | 91 | 23.4 |
| C | 9 | 54 | 973 | 37.74 | 91 | 91 | 23.4 |
| D | 2 | 216 | 17231 | 696.37 | 90 | 87 | 24.6 |
| D | 2 | 136 | 8295 | 333.4 | 90 | 87 | 24.6 |
| D | 8 | 195 | 7334 | 294.37 | 90 | 87 | 24.6 |
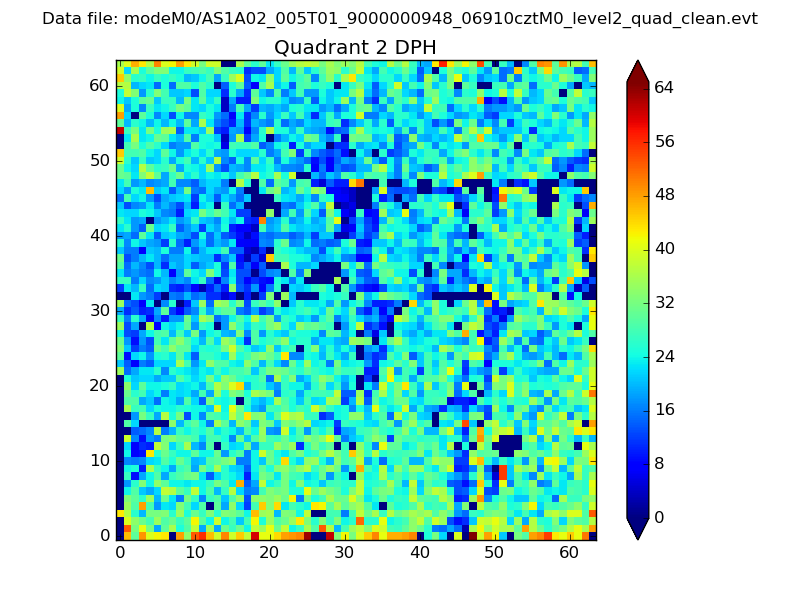
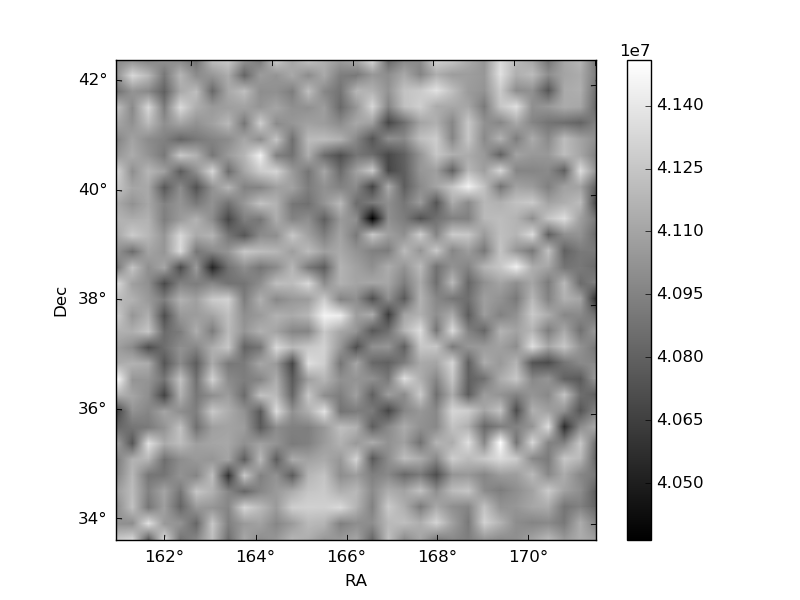
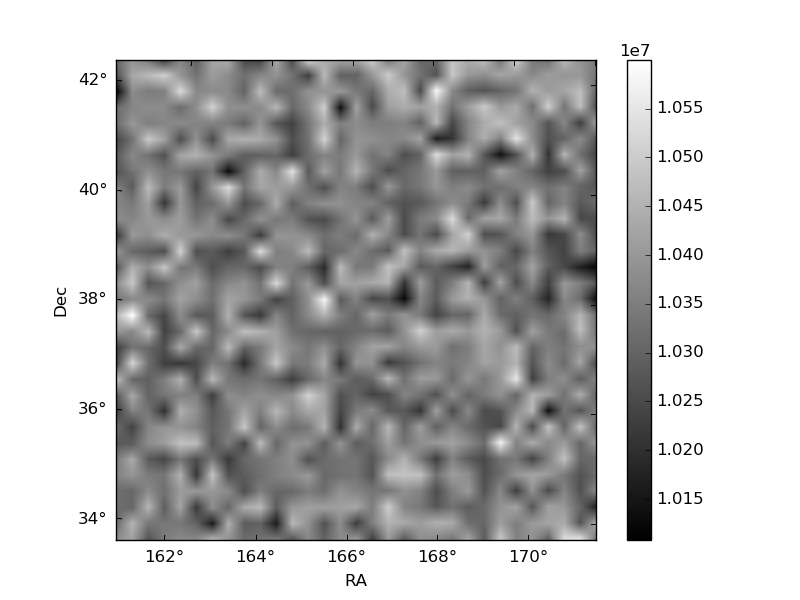
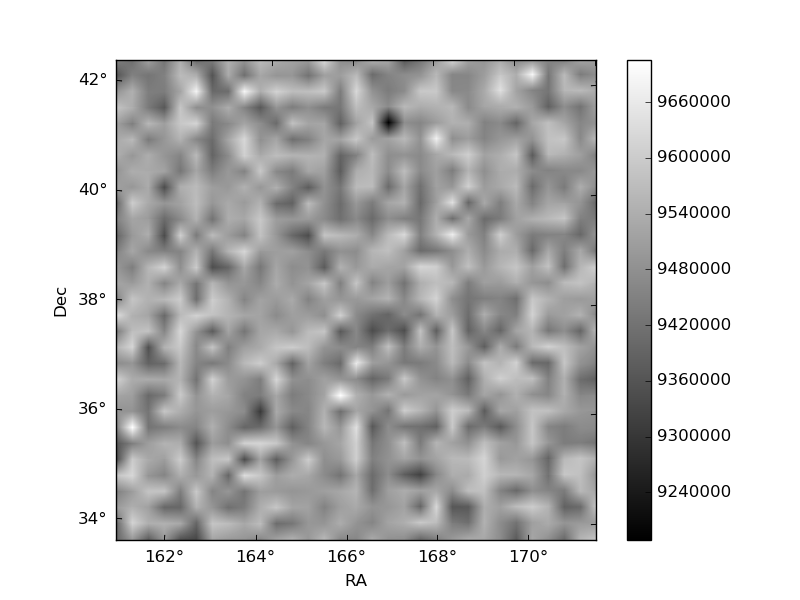
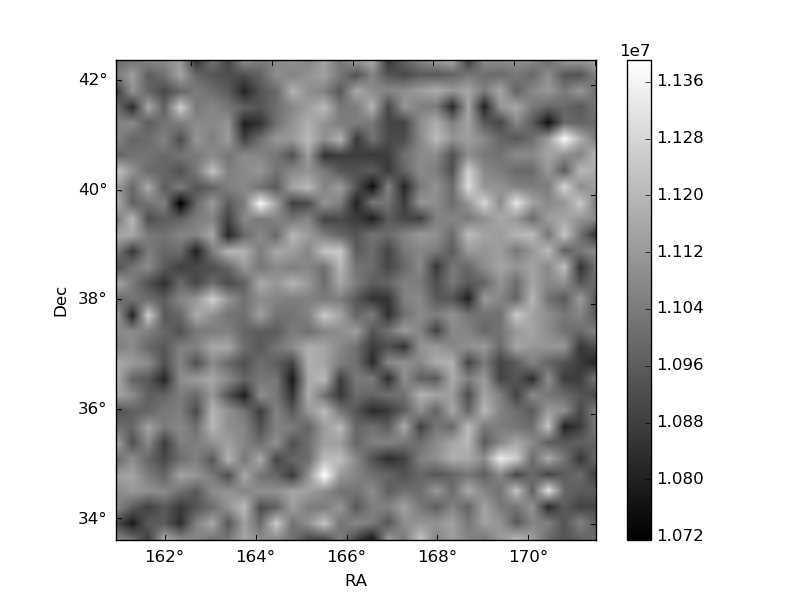
Histogram calculated using DETX and DETY for each event in the final _common_clean file
| Quadrant A | 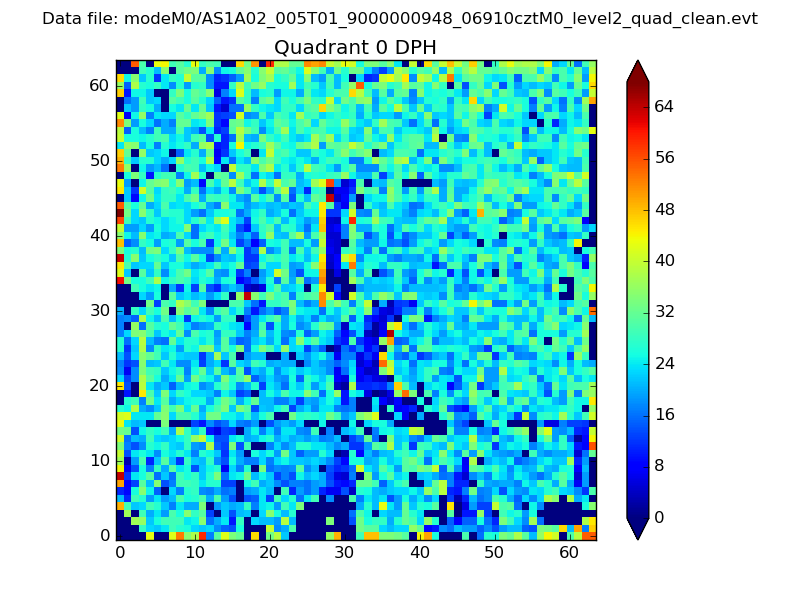 |
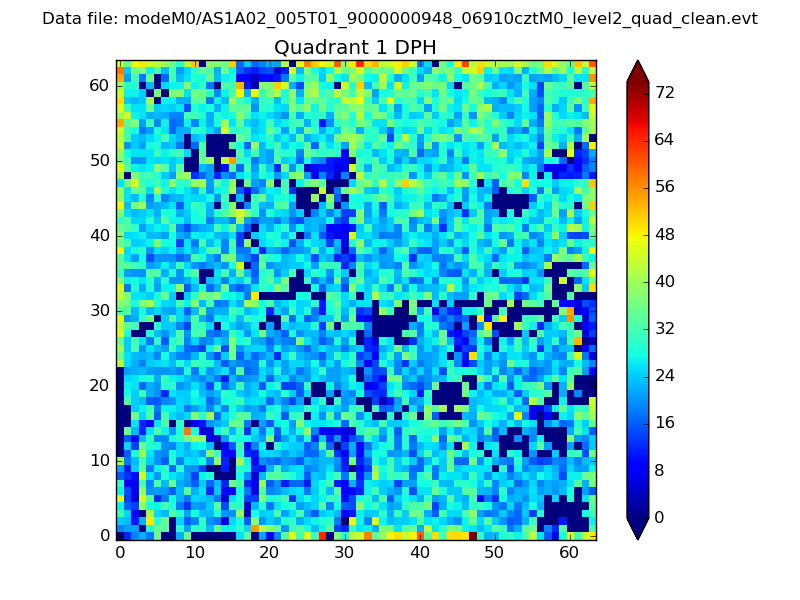 |
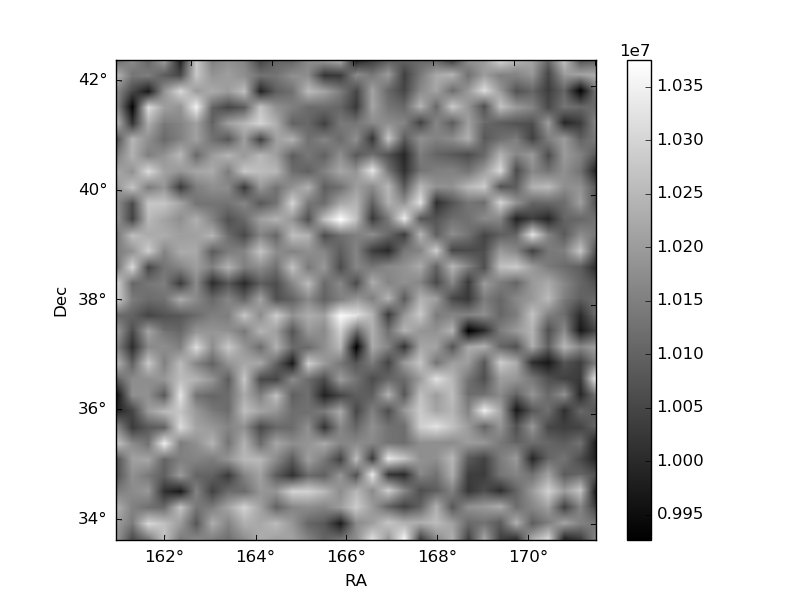
Quadrant B |
|---|---|---|---|
| Quadrant D | 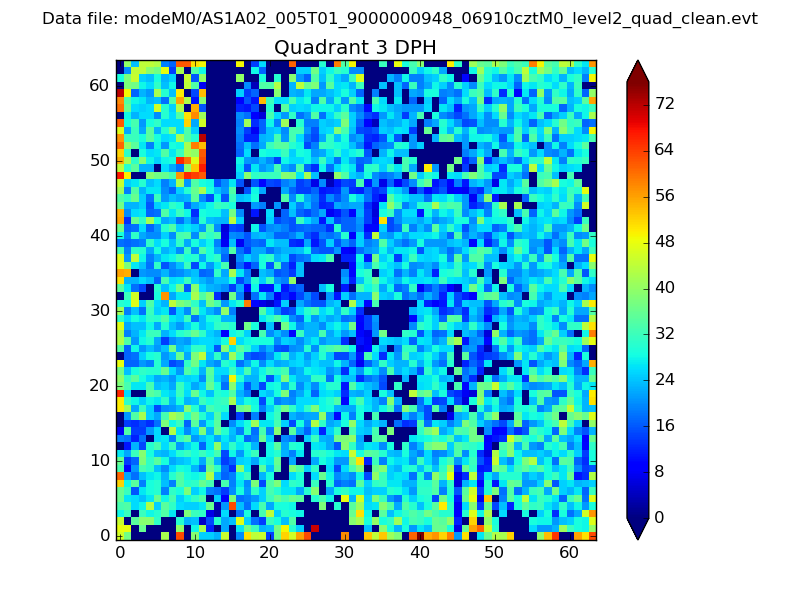 |
 |
Quadrant C |
| Plot type | Count rate plots | Images |
|---|---|---|
| Comparison with Poisson distribution Blue bars denote a histogram of data divided into 1 sec bins. Red curve is a Poisson curve with rate = median count rate of data. |
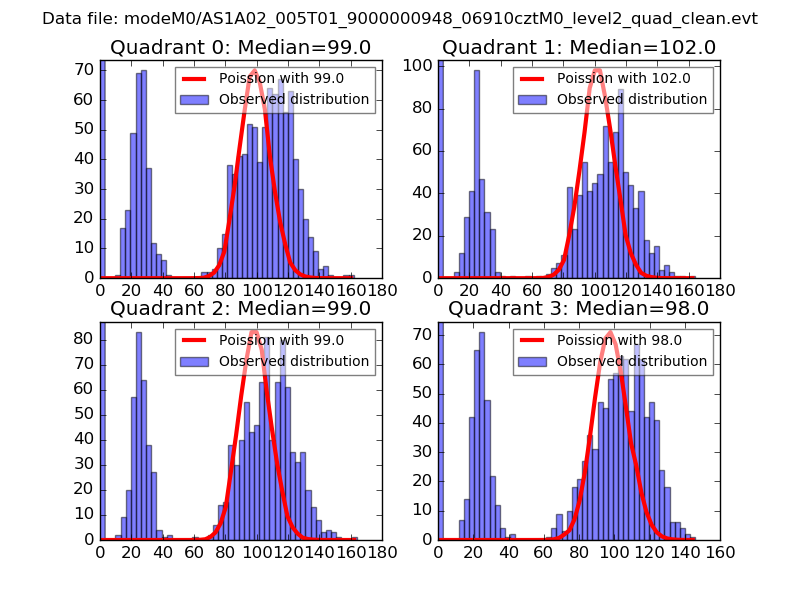 |
 |
| Quadrant-wise count rates Data is divided into 100 sec bins |
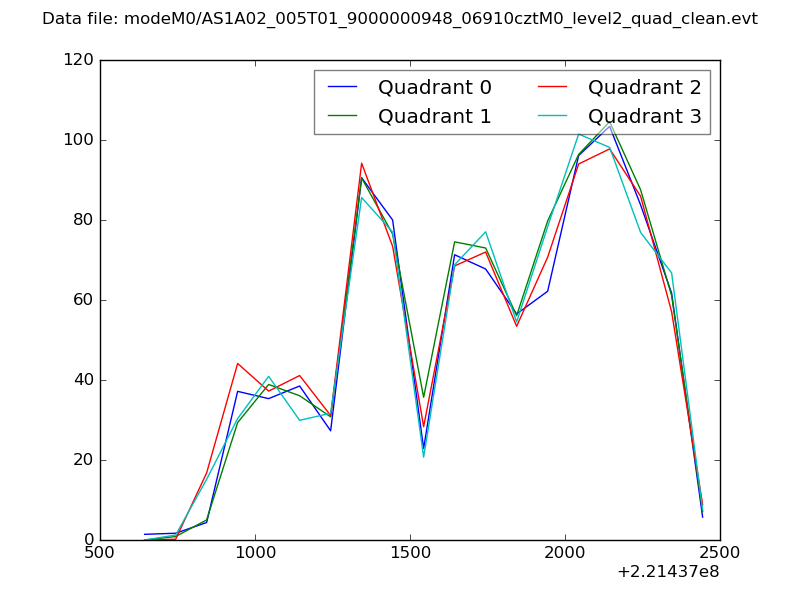 |
|
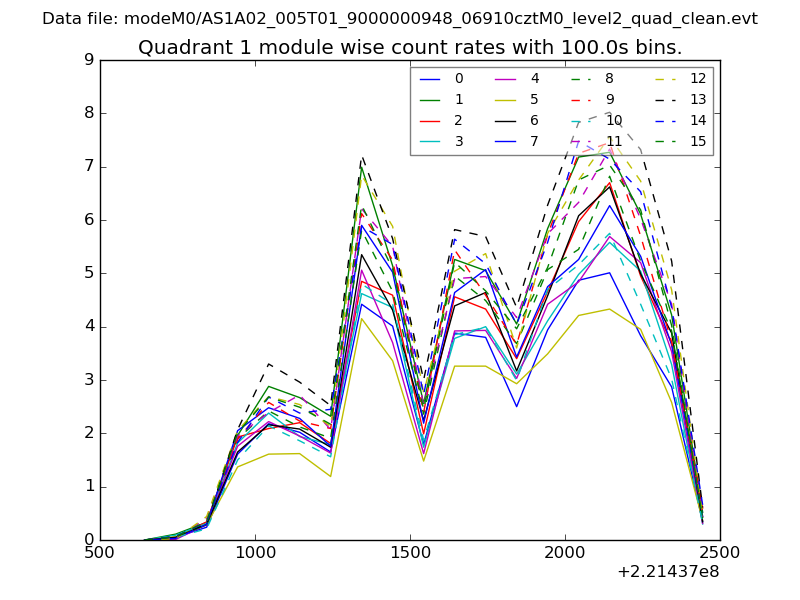
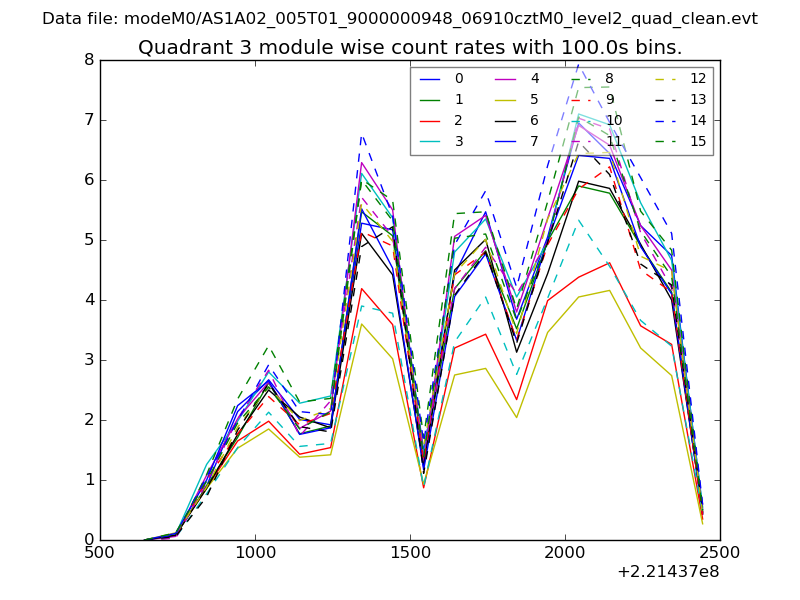
| Module-wise count rates for Quadrant A Data is divided into 100 sec bins |
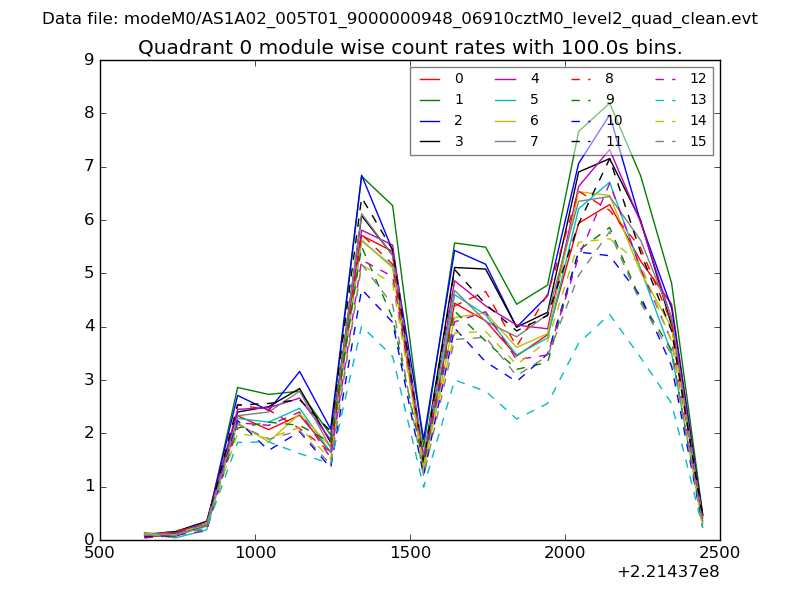 |
 |
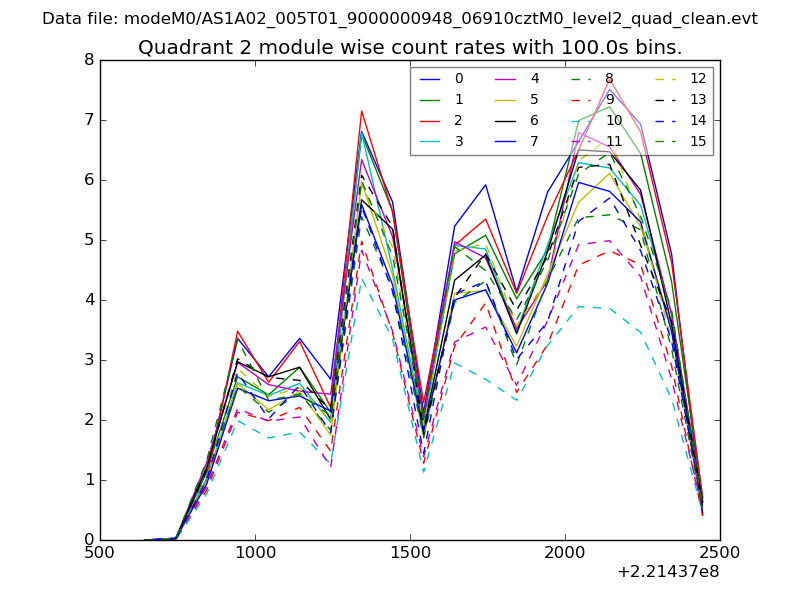
| Module-wise count rates for Quadrant B Data is divided into 100 sec bins |
 |
 |
| Module-wise count rates for Quadrant C Data is divided into 100 sec bins |
 |
 |
| Module-wise count rates for Quadrant D Data is divided into 100 sec bins |
 |
 |
| Parameter | Plot |
|---|---|
| CZT HV Monitor | 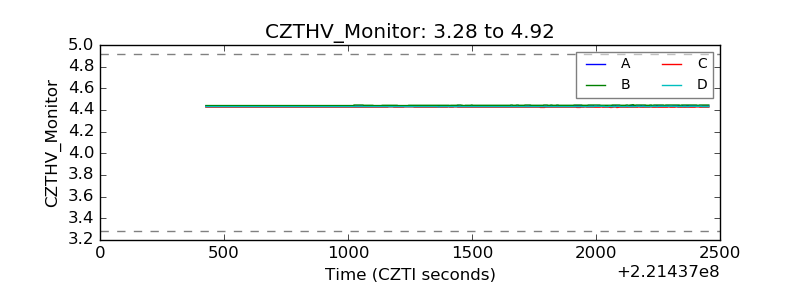 |
| D_VDD | 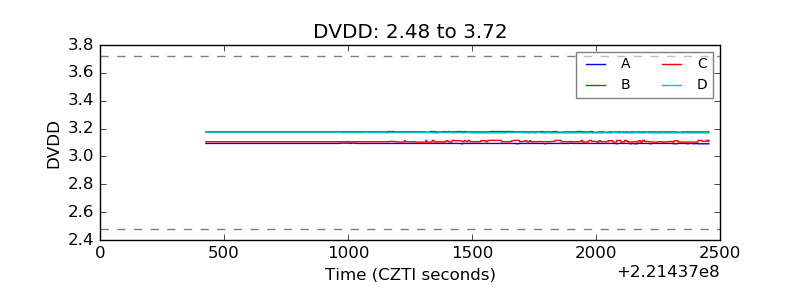 |
| Temperature 1 | 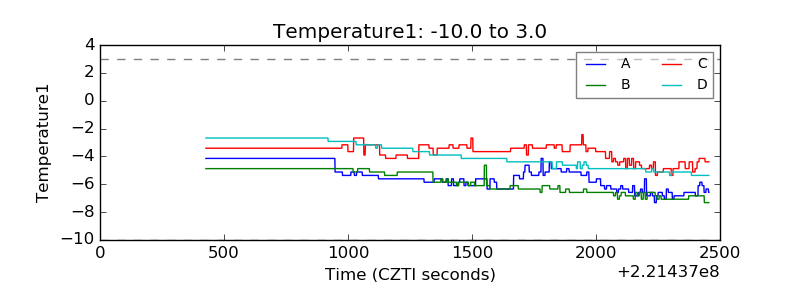 |
| Veto HV Monitor | 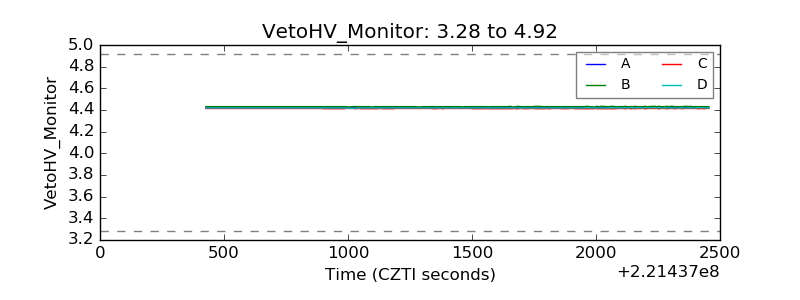 |
| Veto LLD | 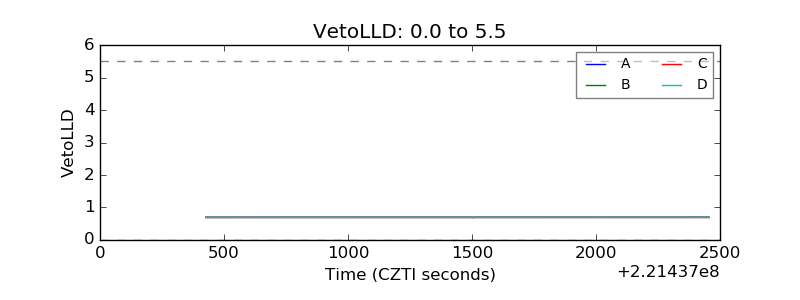 |
| Alpha Counter | 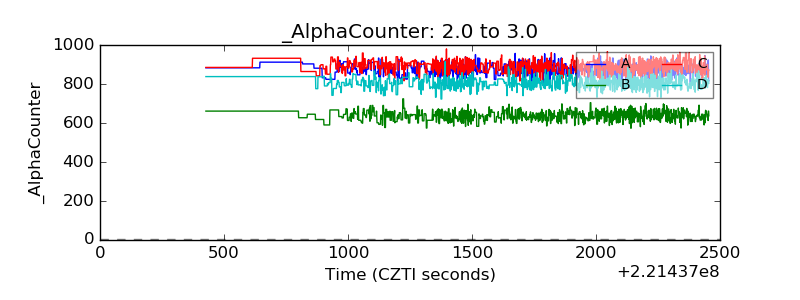 |
| _CPM_Rate | 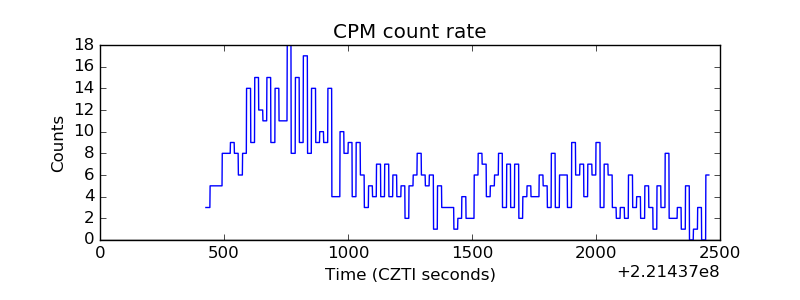 |
| CZT Counter | 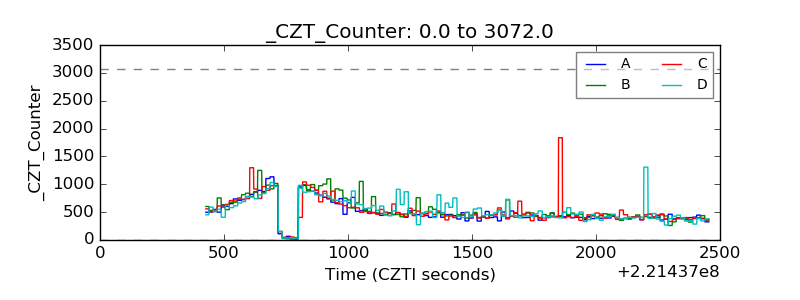 |
| +2.5 Volts monitor | 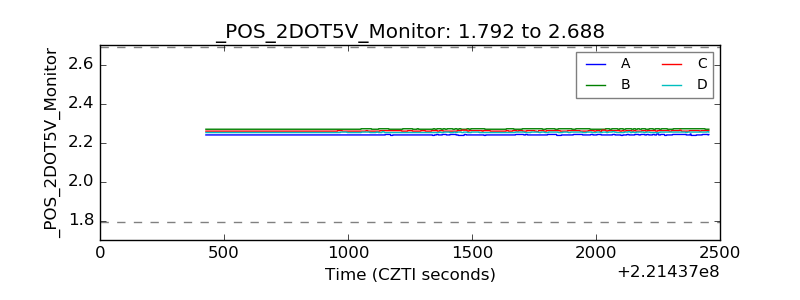 |
| +5 Volts monitor | 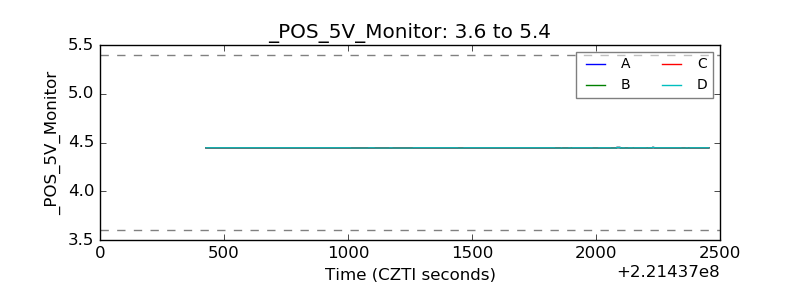 |
| _ROLL_ROT | 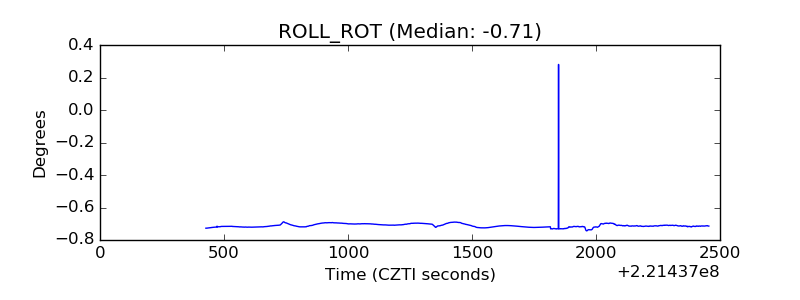 |
| _Roll_DEC | 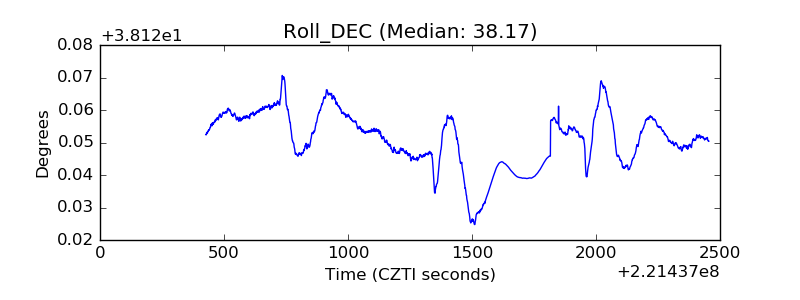 |
| _Roll_RA | 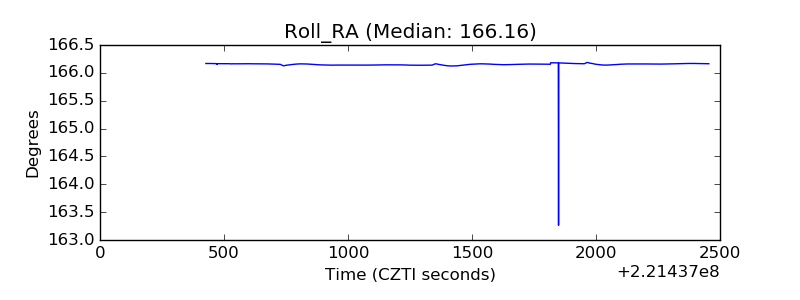 |
| Veto Counter | 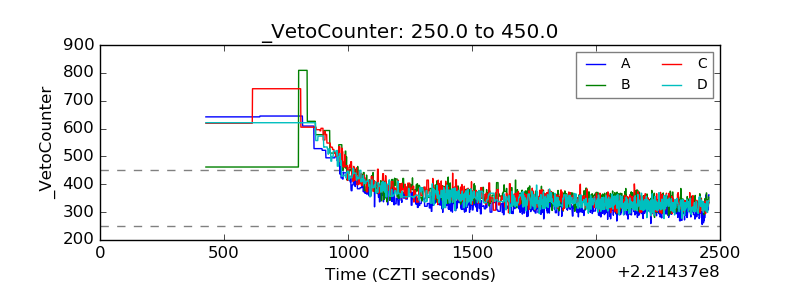 |