| Param | Original file | Final file |
|---|---|---|
| Filename | modeM0/AS1A02_005T01_9000000948_06912cztM0_level2.evt | modeM0/AS1A02_005T01_9000000948_06912cztM0_level2_quad_clean.evt |
| Size (bytes) | 1,122,992,640 | 215,712,000 |
| Size | 1.0 GB | 205.7 MB |
| Events in quadrant A | 7,865,867 | 1,330,400 |
| Events in quadrant B | 8,326,184 | 1,349,386 |
| Events in quadrant C | 7,866,903 | 1,343,209 |
| Events in quadrant D | 8,750,969 | 1,288,363 |
| Mode SS | |||
|---|---|---|---|
| Quadrant | BADHDUFLAG | Total packets | Discarded packets |
| A | 0 | 362 | 0 |
| B | 0 | 362 | 0 |
| C | 0 | 362 | 0 |
| D | 0 | 362 | 0 |
| Mode M0 | |||
|---|---|---|---|
| Quadrant | BADHDUFLAG | Total packets | Discarded packets |
| A | 0 | 36126 | 5 |
| B | 0 | 36966 | 4 |
| C | 0 | 36184 | 4 |
| D | 0 | 38968 | 4 |
| Mode M9 | |||
|---|---|---|---|
| Quadrant | BADHDUFLAG | Total packets | Discarded packets |
| A | 0 | 16 | 0 |
| B | 0 | 16 | 0 |
| C | 0 | 16 | 0 |
| D | 0 | 16 | 0 |
| Quadrant | Total seconds | Saturated seconds | Saturation percentage |
|---|---|---|---|
| A | 17720 | 124 | 0.699774% |
| B | 17720 | 169 | 0.953725% |
| C | 17720 | 112 | 0.632054% |
| D | 17720 | 180 | 1.015801% |
Noise dominated data is calculated using 1-second bins in cleaned event files. If a bin has >2000 counts, and if more than 50% of those come from <1% of pixels, then it is considered to be noise-dominated and hence unusable.
| Quadrant | # 1 sec bins | Bins with >0 counts | Bins with >2000 counts | High rate bins dominated by noise | Noise dominated (total time) | Noise dominated (detector-on time) | Marked lightcurve |
|---|---|---|---|---|---|---|---|
| A | 19380 | 17724 | 0 | 0 | 0.00% | 0.00% | 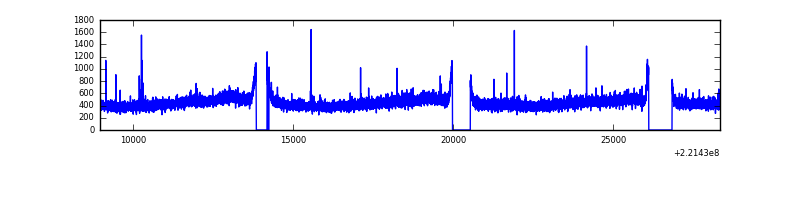 |
| B | 19380 | 17724 | 8 | 8 | 0.04% | 0.05% | 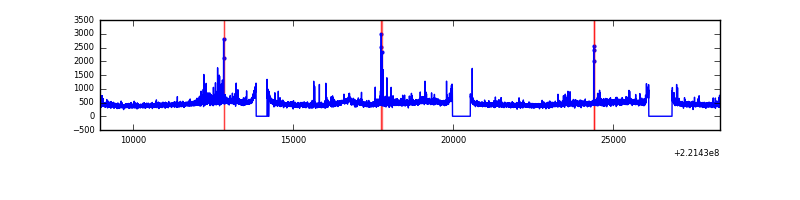 |
| C | 19380 | 17724 | 0 | 0 | 0.00% | 0.00% | 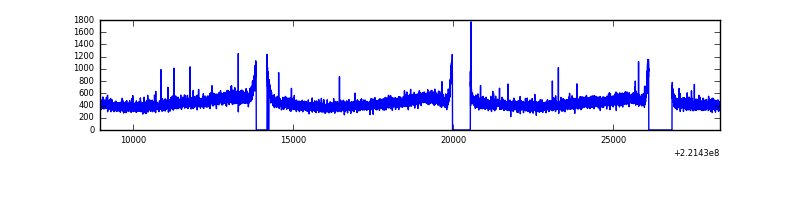 |
| D | 19380 | 17724 | 86 | 86 | 0.44% | 0.49% | 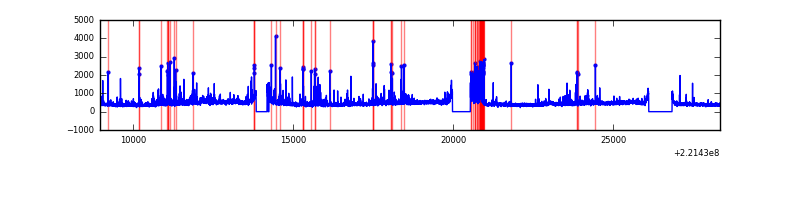 |
Top three noisy pixels from each quadrant. If the there are fewer than three noisy pixels in the level2.evt file, extra rows are filled as -1
| Pixel properties | Quadrant properties | ||||||
|---|---|---|---|---|---|---|---|
| Quadrant | DetID | PixID | Counts | Sigma | Mean | Median | Sigma |
| A | 0 | 23 | 33487 | 76.76 | 2016 | 1973 | 410.6 |
| A | 13 | 14 | 22798 | 50.72 | 2016 | 1973 | 410.6 |
| A | 4 | 2 | 22008 | 48.8 | 2016 | 1973 | 410.6 |
| B | 4 | 80 | 132962 | 340.33 | 2031 | 1984 | 384.9 |
| B | 4 | 173 | 130734 | 334.54 | 2031 | 1984 | 384.9 |
| B | 15 | 204 | 72667 | 183.66 | 2031 | 1984 | 384.9 |
| C | 9 | 247 | 135340 | 295.21 | 1958 | 1963 | 451.8 |
| C | 8 | 128 | 24172 | 49.16 | 1958 | 1963 | 451.8 |
| C | 9 | 16 | 20578 | 41.2 | 1958 | 1963 | 451.8 |
| D | 1 | 20 | 390249 | 814.67 | 1956 | 1896 | 476.7 |
| D | 2 | 216 | 351230 | 732.81 | 1956 | 1896 | 476.7 |
| D | 2 | 136 | 267846 | 557.9 | 1956 | 1896 | 476.7 |
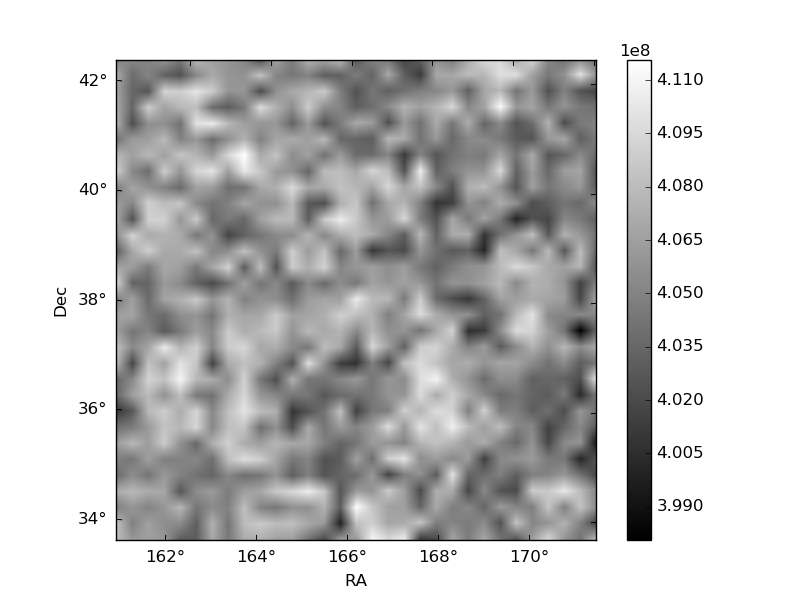
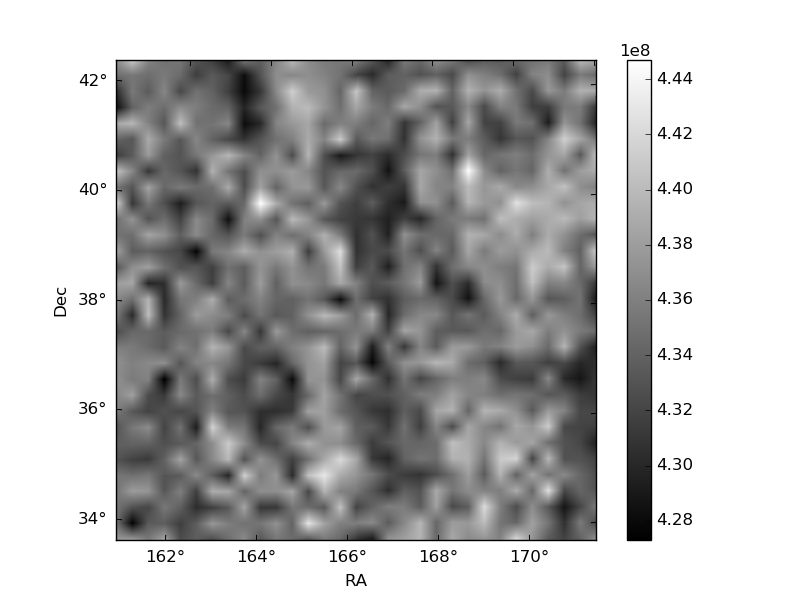
Histogram calculated using DETX and DETY for each event in the final _common_clean file
| Quadrant A | 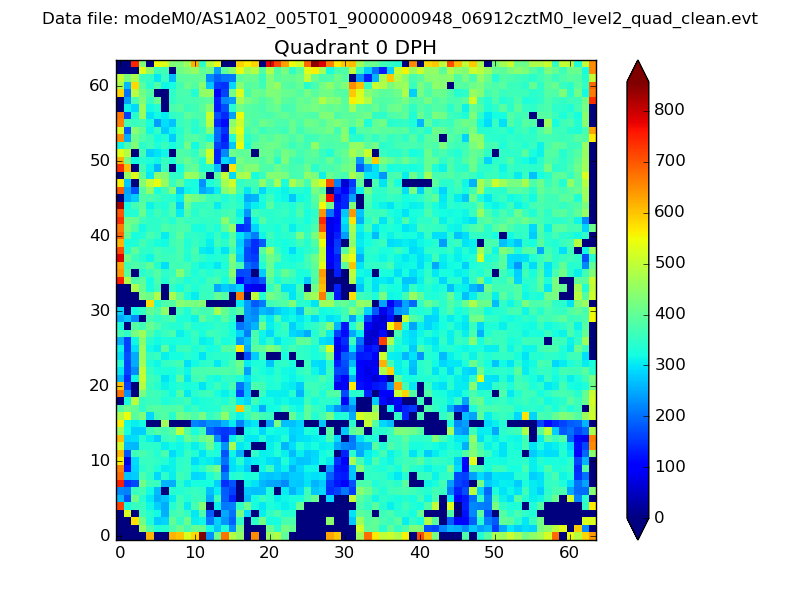 |
 |
Quadrant B |
|---|---|---|---|
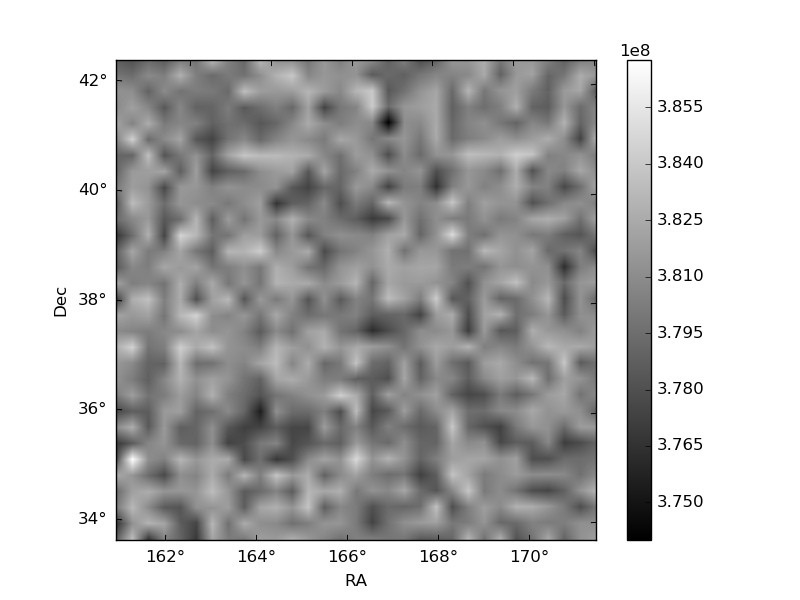
| Quadrant D | 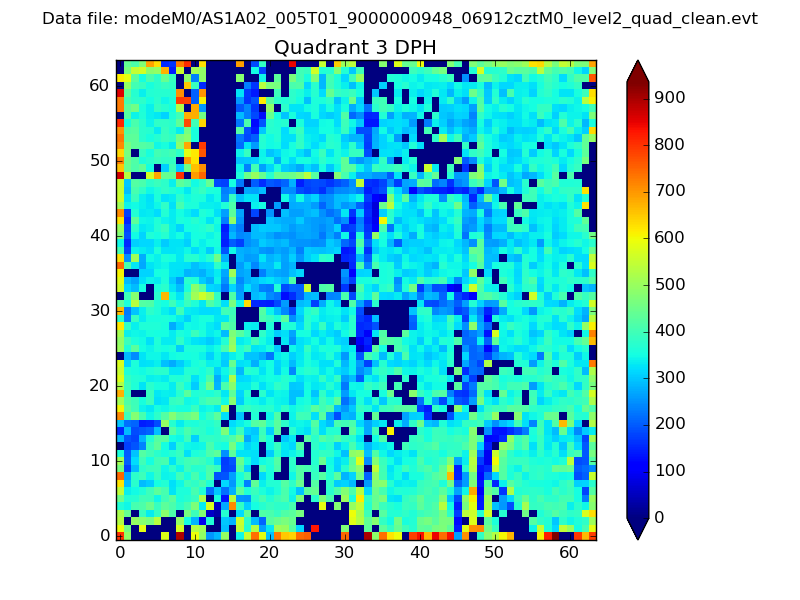 |
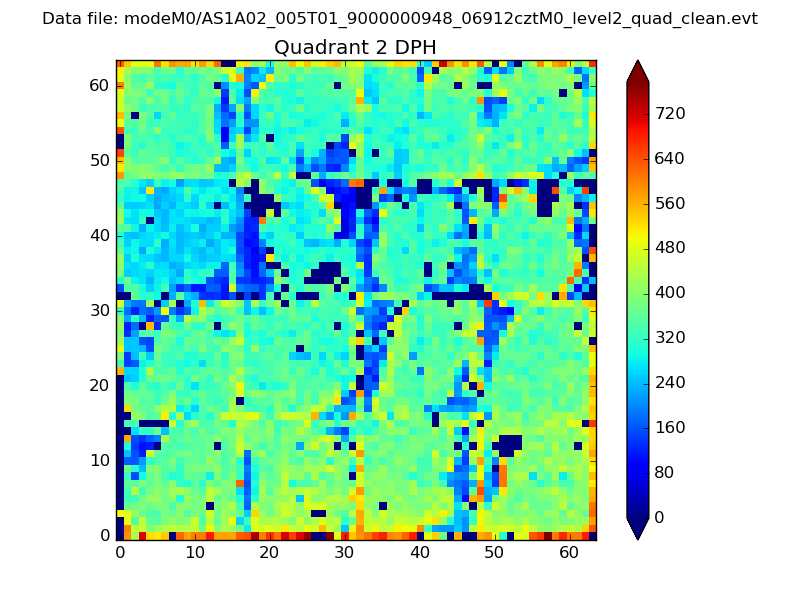 |
Quadrant C |
| Plot type | Count rate plots | Images |
|---|---|---|
| Comparison with Poisson distribution Blue bars denote a histogram of data divided into 1 sec bins. Red curve is a Poisson curve with rate = median count rate of data. |
 |
 |
| Quadrant-wise count rates Data is divided into 100 sec bins |
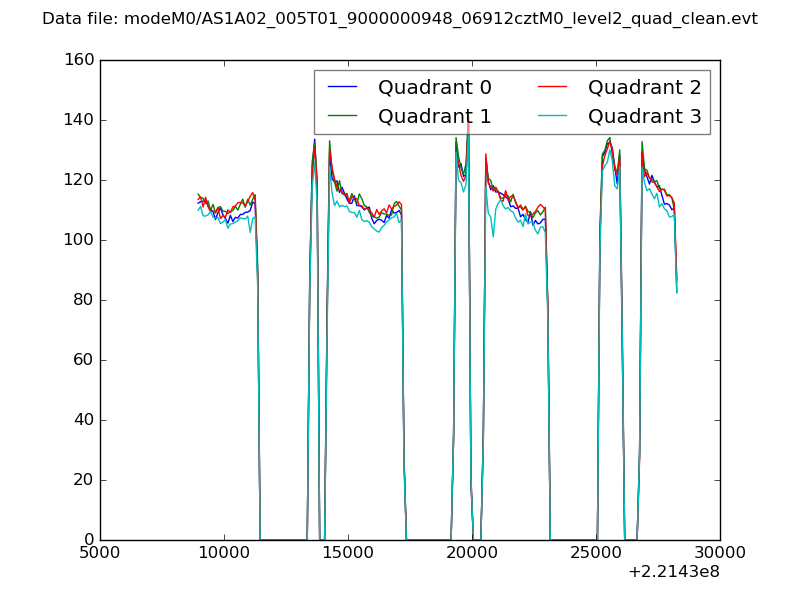 |
|
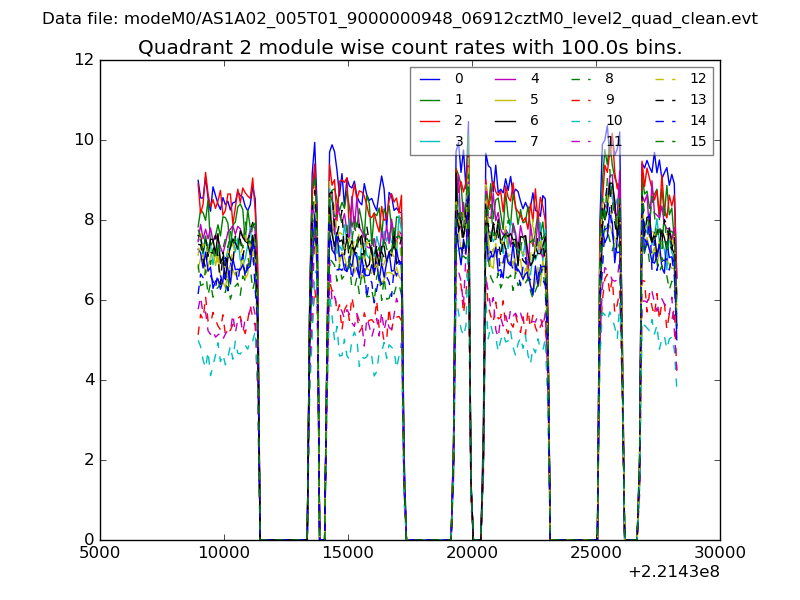
| Module-wise count rates for Quadrant A Data is divided into 100 sec bins |
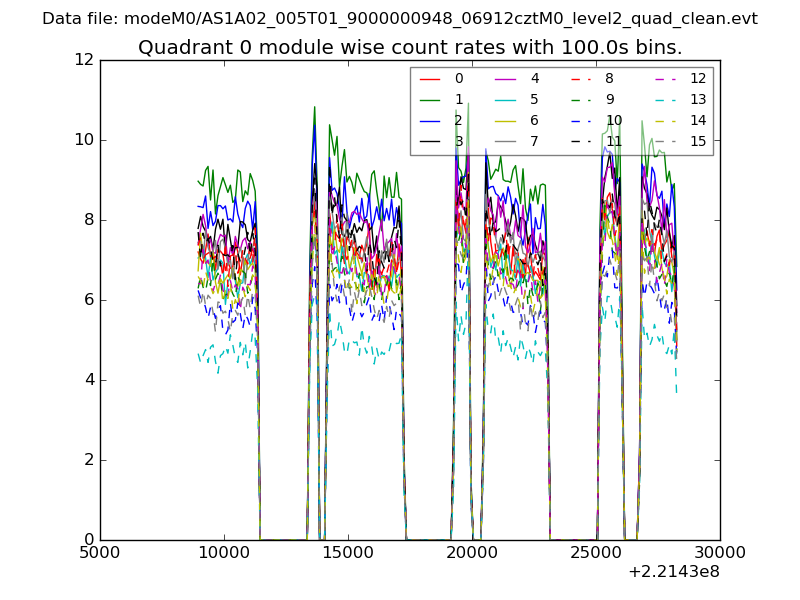 |
 |
| Module-wise count rates for Quadrant B Data is divided into 100 sec bins |
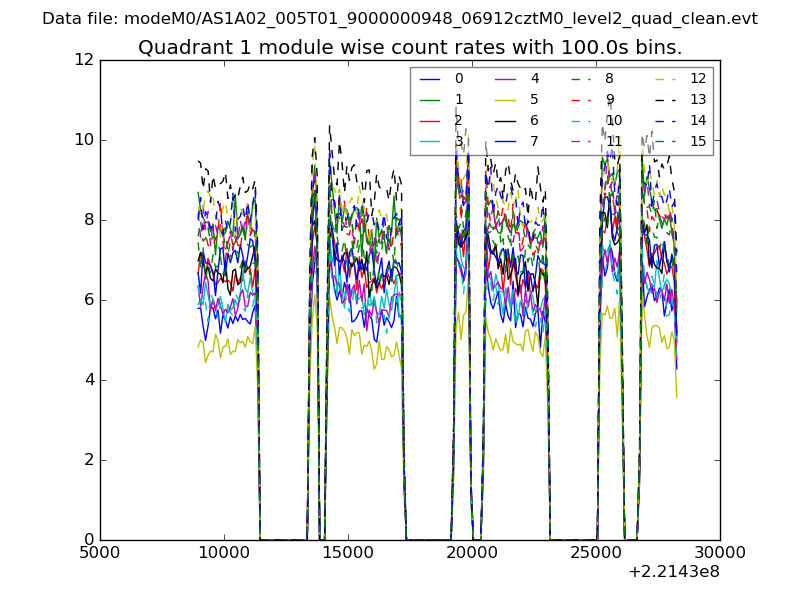 |
 |
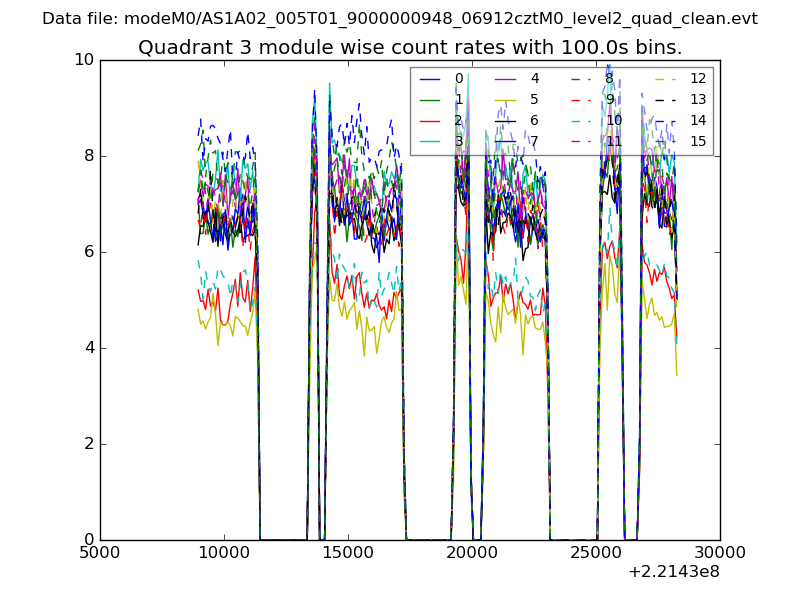
| Module-wise count rates for Quadrant C Data is divided into 100 sec bins |
 |
 |
| Module-wise count rates for Quadrant D Data is divided into 100 sec bins |
 |
 |
| Parameter | Plot |
|---|---|
| CZT HV Monitor | 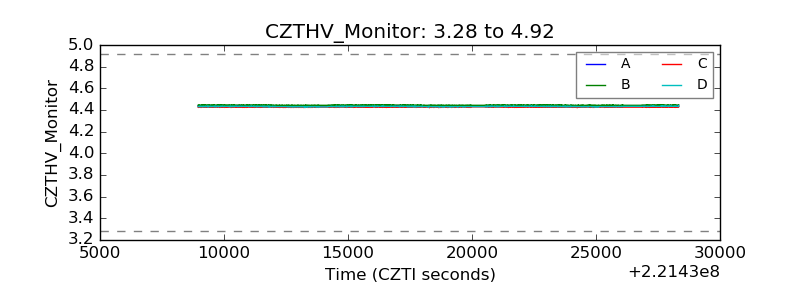 |
| D_VDD | 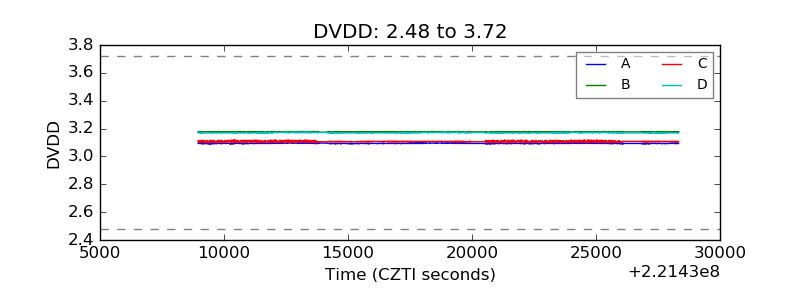 |
| Temperature 1 | 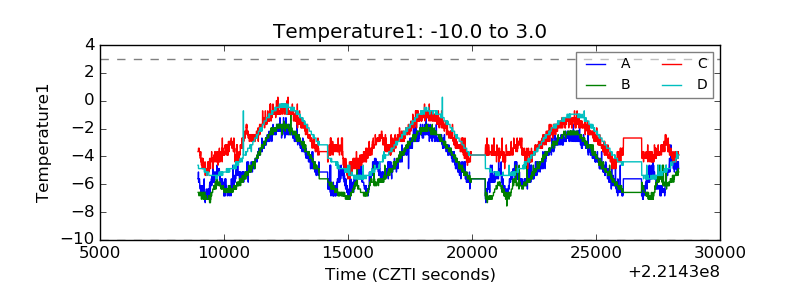 |
| Veto HV Monitor | 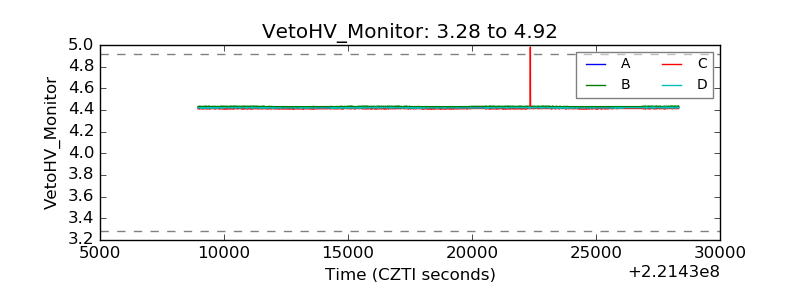 |
| Veto LLD | 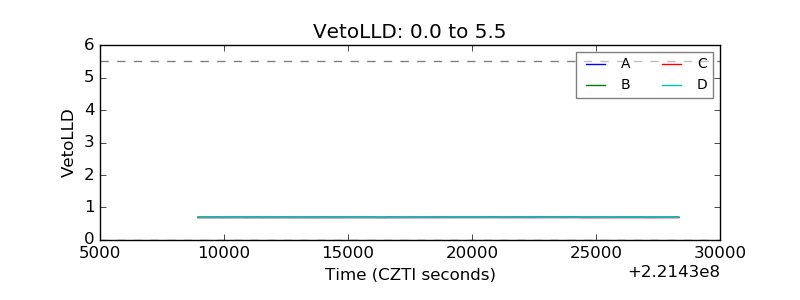 |
| Alpha Counter | 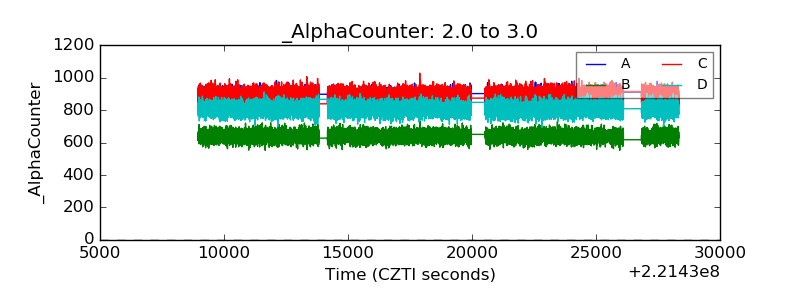 |
| _CPM_Rate | 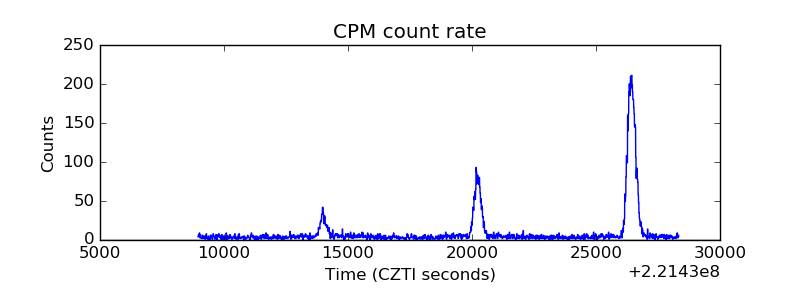 |
| CZT Counter | 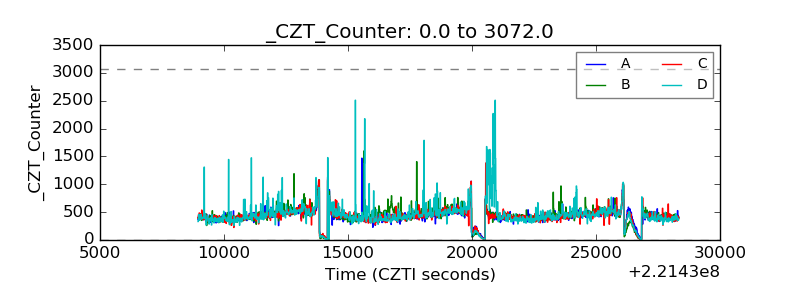 |
| +2.5 Volts monitor |  |
| +5 Volts monitor | 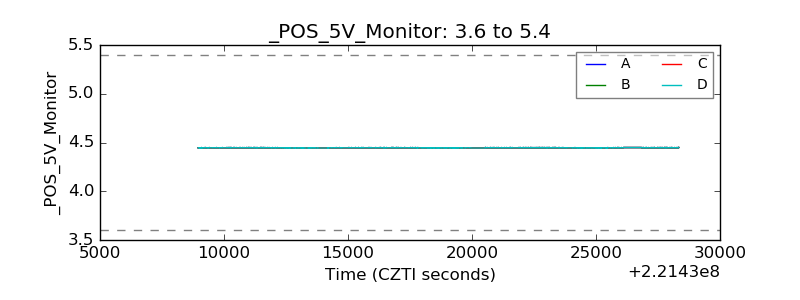 |
| _ROLL_ROT | 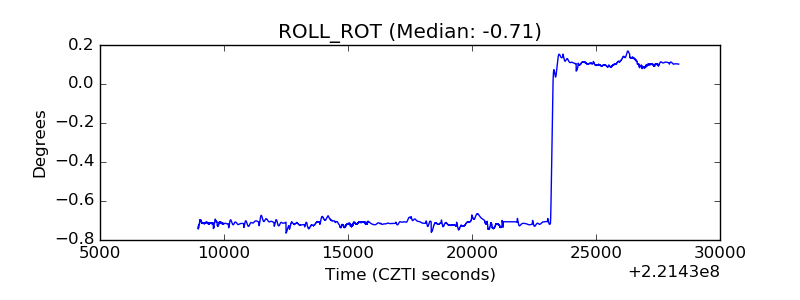 |
| _Roll_DEC | 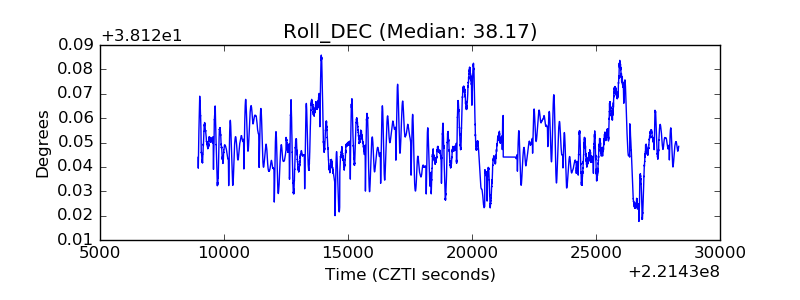 |
| _Roll_RA | 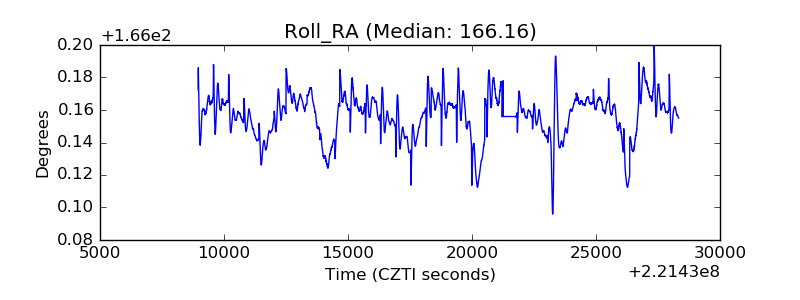 |
| Veto Counter | 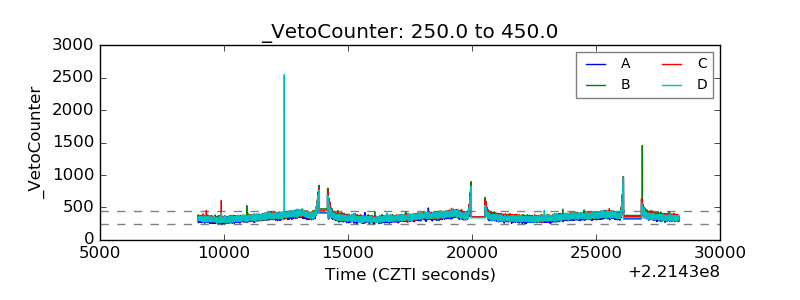 |