| Param | Original file | Final file |
|---|---|---|
| Filename | modeM0/AS1A02_005T01_9000000948_06913cztM0_level2.evt | modeM0/AS1A02_005T01_9000000948_06913cztM0_level2_quad_clean.evt |
| Size (bytes) | 1,584,112,320 | 305,547,840 |
| Size | 1.5 GB | 291.4 MB |
| Events in quadrant A | 11,134,331 | 1,895,673 |
| Events in quadrant B | 11,794,151 | 1,923,822 |
| Events in quadrant C | 11,092,607 | 1,908,279 |
| Events in quadrant D | 12,289,131 | 1,833,113 |
| Mode SS | |||
|---|---|---|---|
| Quadrant | BADHDUFLAG | Total packets | Discarded packets |
| A | 0 | 504 | 0 |
| B | 0 | 504 | 0 |
| C | 0 | 504 | 0 |
| D | 0 | 504 | 0 |
| Mode M0 | |||
|---|---|---|---|
| Quadrant | BADHDUFLAG | Total packets | Discarded packets |
| A | 0 | 50622 | 7 |
| B | 0 | 51875 | 6 |
| C | 0 | 50624 | 6 |
| D | 0 | 54191 | 6 |
| Mode M9 | |||
|---|---|---|---|
| Quadrant | BADHDUFLAG | Total packets | Discarded packets |
| A | 0 | 26 | 0 |
| B | 0 | 26 | 0 |
| C | 0 | 26 | 0 |
| D | 0 | 26 | 0 |
| Quadrant | Total seconds | Saturated seconds | Saturation percentage |
|---|---|---|---|
| A | 24610 | 243 | 0.987403% |
| B | 24610 | 342 | 1.389679% |
| C | 24610 | 205 | 0.832995% |
| D | 24610 | 291 | 1.182446% |
Noise dominated data is calculated using 1-second bins in cleaned event files. If a bin has >2000 counts, and if more than 50% of those come from <1% of pixels, then it is considered to be noise-dominated and hence unusable.
| Quadrant | # 1 sec bins | Bins with >0 counts | Bins with >2000 counts | High rate bins dominated by noise | Noise dominated (total time) | Noise dominated (detector-on time) | Marked lightcurve |
|---|---|---|---|---|---|---|---|
| A | 27285 | 24616 | 10 | 10 | 0.04% | 0.04% | 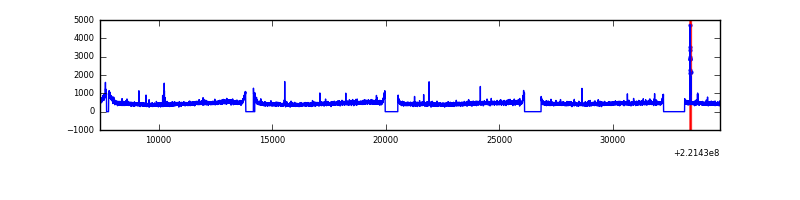 |
| B | 27285 | 24616 | 20 | 20 | 0.07% | 0.08% | 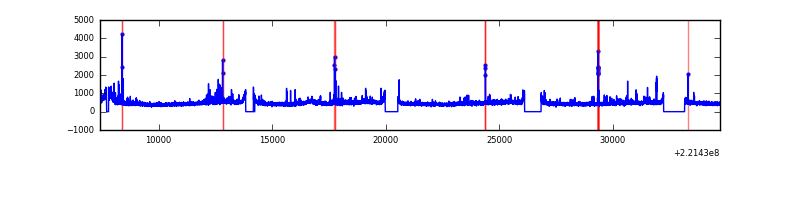 |
| C | 27285 | 24616 | 2 | 2 | 0.01% | 0.01% | 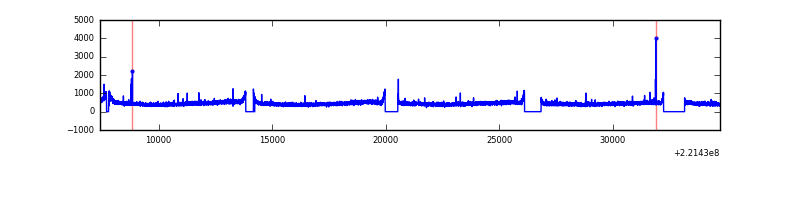 |
| D | 27285 | 24616 | 126 | 126 | 0.46% | 0.51% | 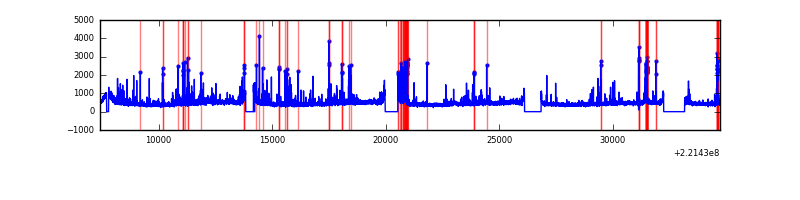 |
Top three noisy pixels from each quadrant. If the there are fewer than three noisy pixels in the level2.evt file, extra rows are filled as -1
| Pixel properties | Quadrant properties | ||||||
|---|---|---|---|---|---|---|---|
| Quadrant | DetID | PixID | Counts | Sigma | Mean | Median | Sigma |
| A | 13 | 248 | 60841 | 100.2 | 2845 | 2783 | 579.4 |
| A | 0 | 23 | 36046 | 57.41 | 2845 | 2783 | 579.4 |
| A | 13 | 14 | 35562 | 56.57 | 2845 | 2783 | 579.4 |
| B | 4 | 173 | 169404 | 306.04 | 2868 | 2803 | 544.4 |
| B | 4 | 80 | 149340 | 269.18 | 2868 | 2803 | 544.4 |
| B | 0 | 228 | 94822 | 169.04 | 2868 | 2803 | 544.4 |
| C | 9 | 247 | 189423 | 293.19 | 2762 | 2770 | 636.6 |
| C | 8 | 128 | 27687 | 39.14 | 2762 | 2770 | 636.6 |
| C | 9 | 16 | 26888 | 37.88 | 2762 | 2770 | 636.6 |
| D | 1 | 20 | 460454 | 677.1 | 2763 | 2676 | 676.1 |
| D | 2 | 216 | 403648 | 593.08 | 2763 | 2676 | 676.1 |
| D | 2 | 136 | 341363 | 500.95 | 2763 | 2676 | 676.1 |
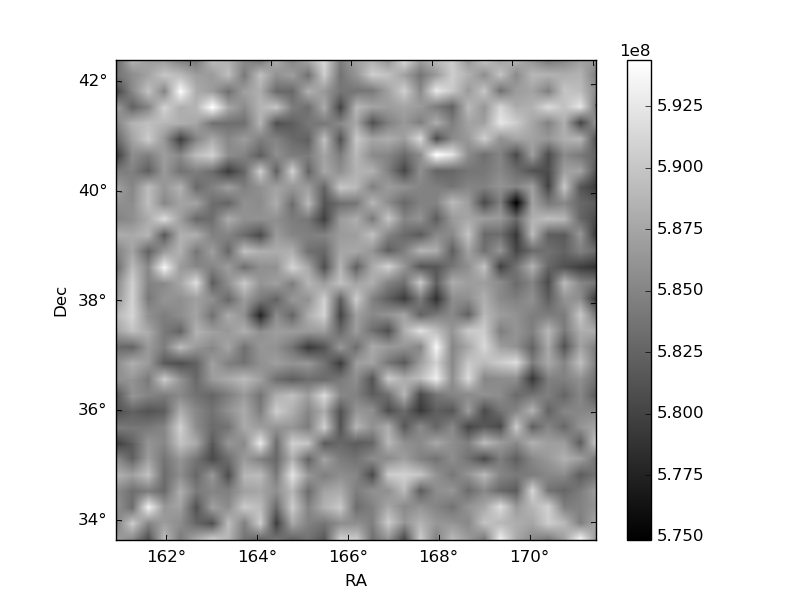
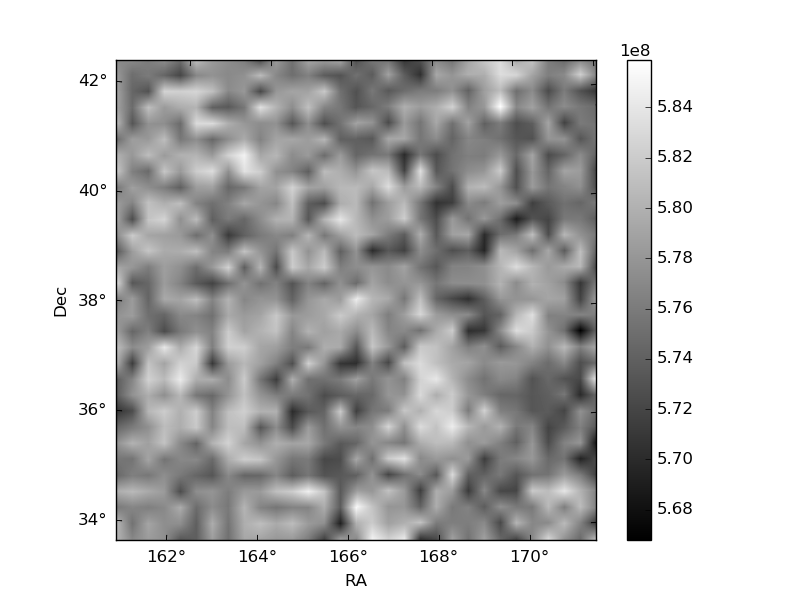
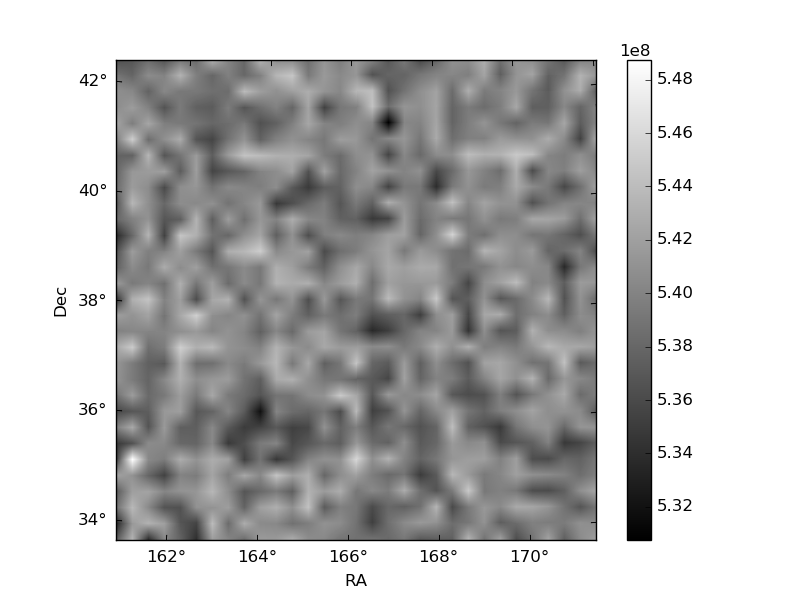
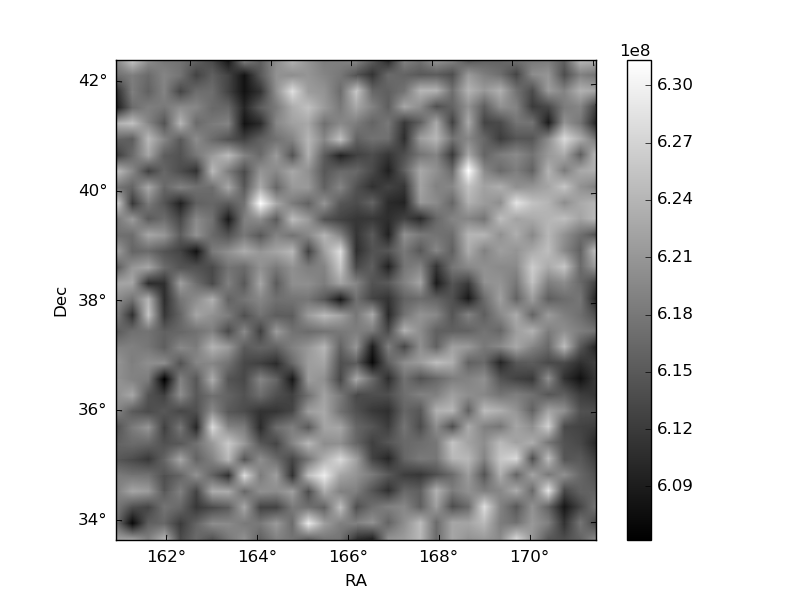
Histogram calculated using DETX and DETY for each event in the final _common_clean file
| Quadrant A | 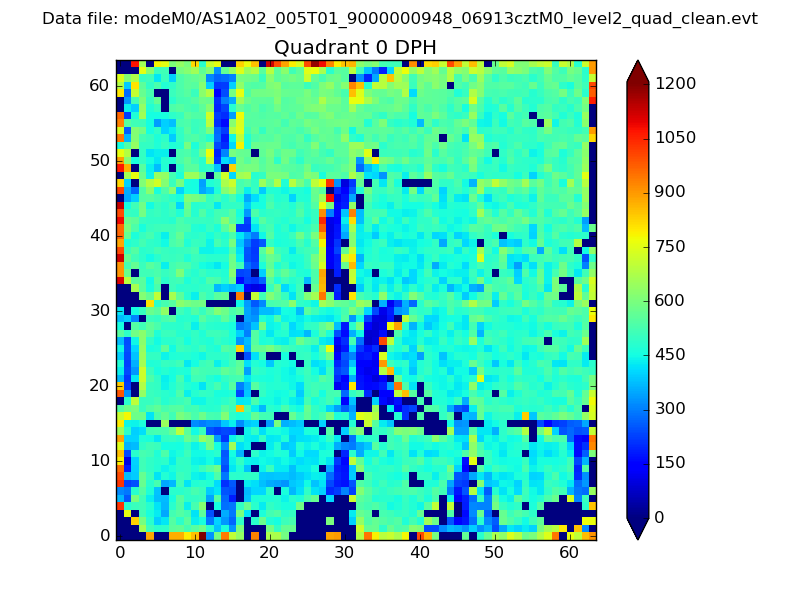 |
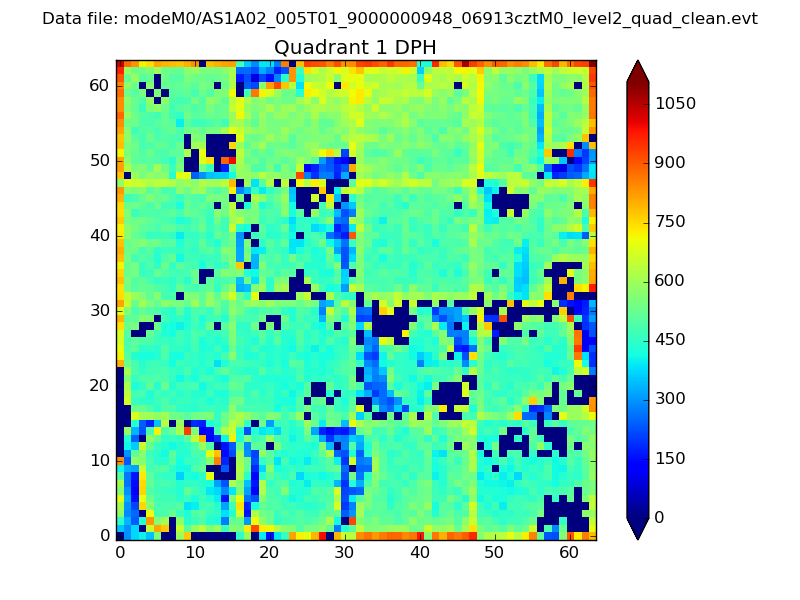 |
Quadrant B |
|---|---|---|---|
| Quadrant D | 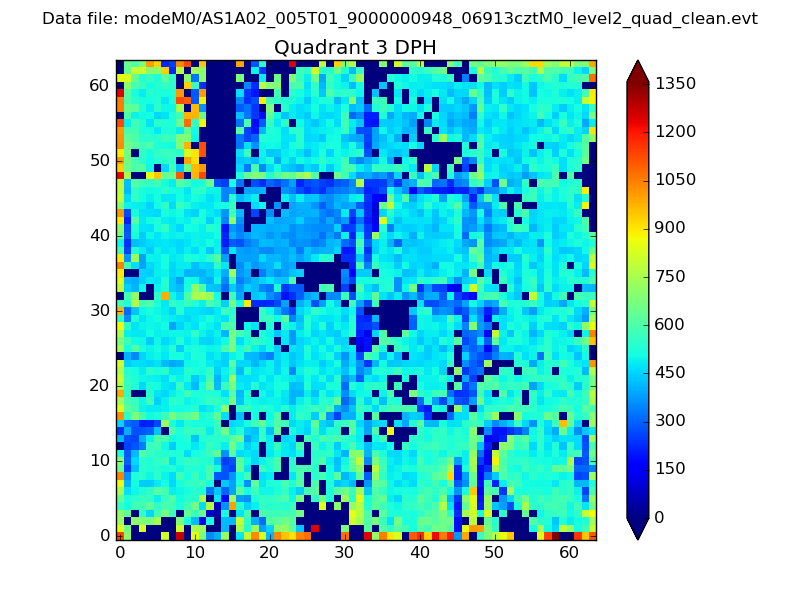 |
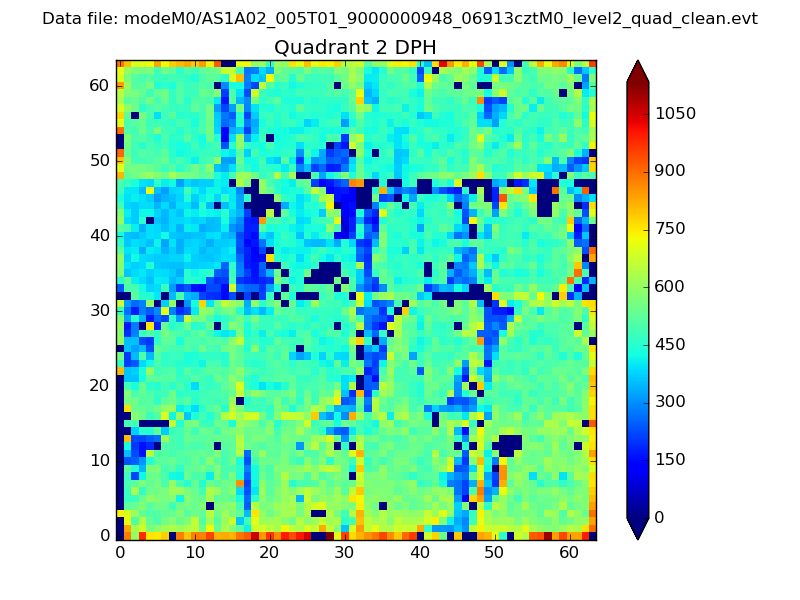 |
Quadrant C |
| Plot type | Count rate plots | Images |
|---|---|---|
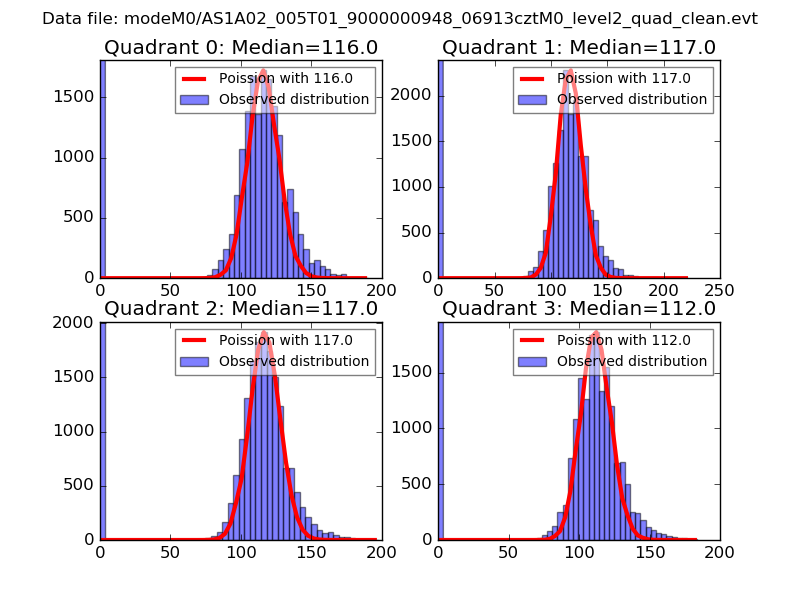
| Comparison with Poisson distribution Blue bars denote a histogram of data divided into 1 sec bins. Red curve is a Poisson curve with rate = median count rate of data. |
 |
 |
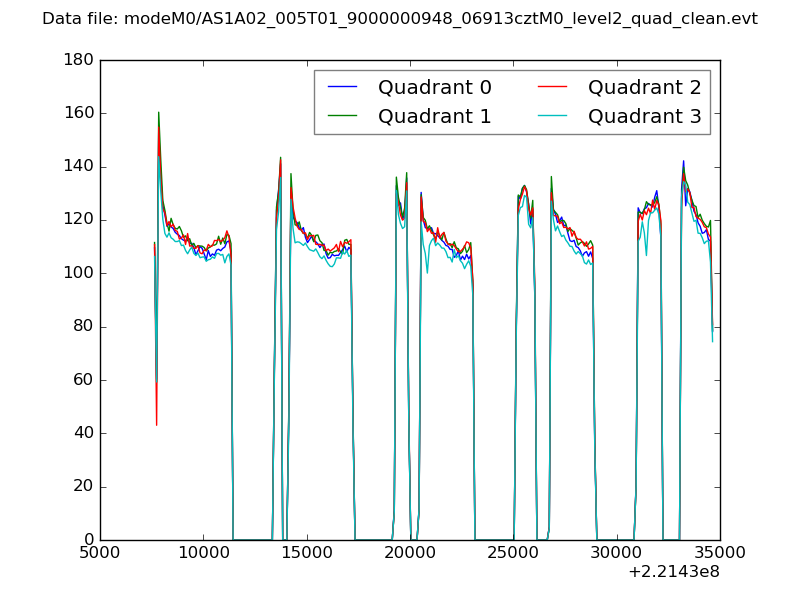
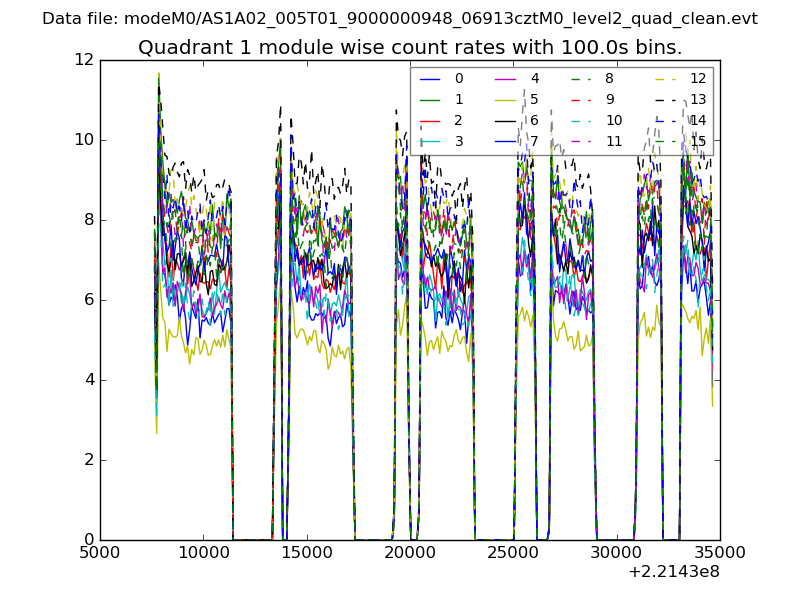
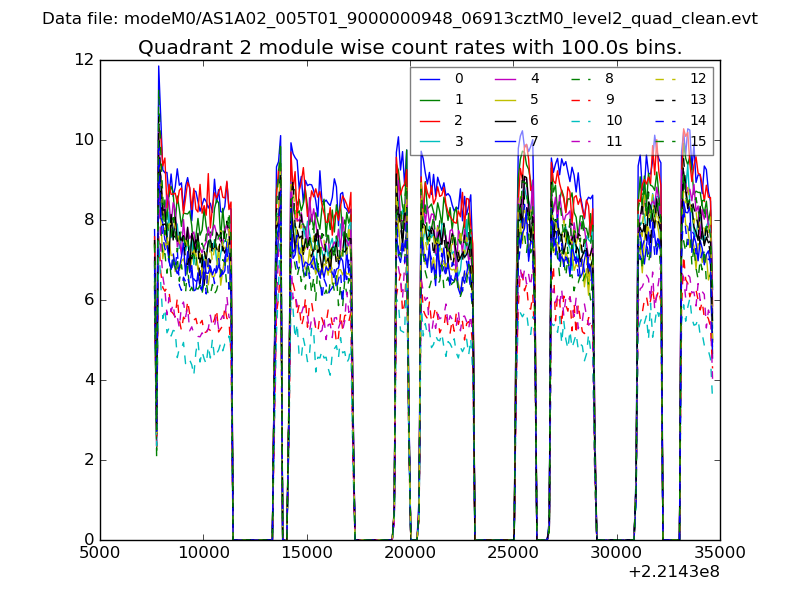
| Quadrant-wise count rates Data is divided into 100 sec bins |
 |
|
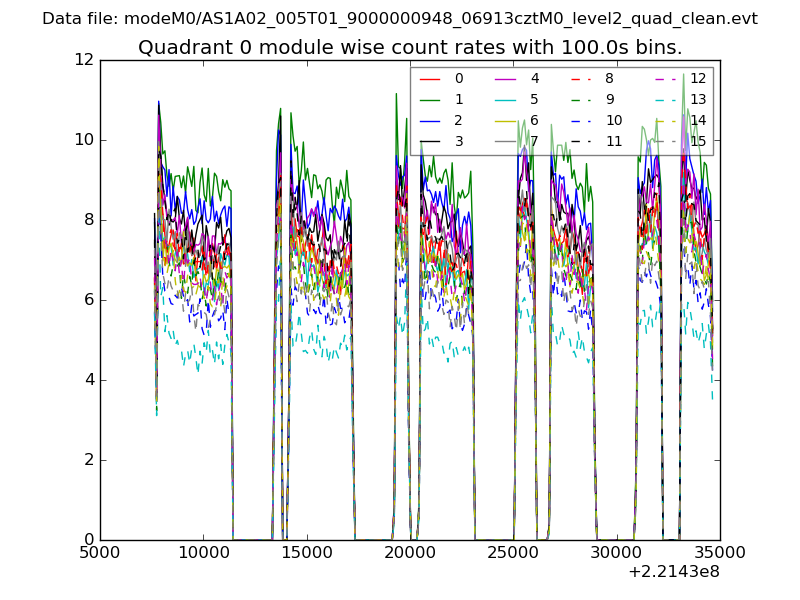
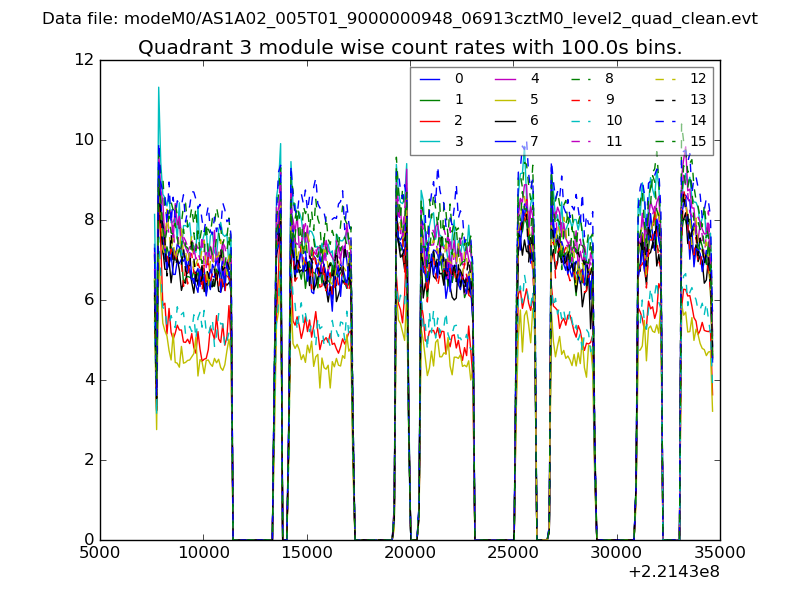
| Module-wise count rates for Quadrant A Data is divided into 100 sec bins |
 |
 |
| Module-wise count rates for Quadrant B Data is divided into 100 sec bins |
 |
 |
| Module-wise count rates for Quadrant C Data is divided into 100 sec bins |
 |
 |
| Module-wise count rates for Quadrant D Data is divided into 100 sec bins |
 |
 |
| Parameter | Plot |
|---|---|
| CZT HV Monitor | 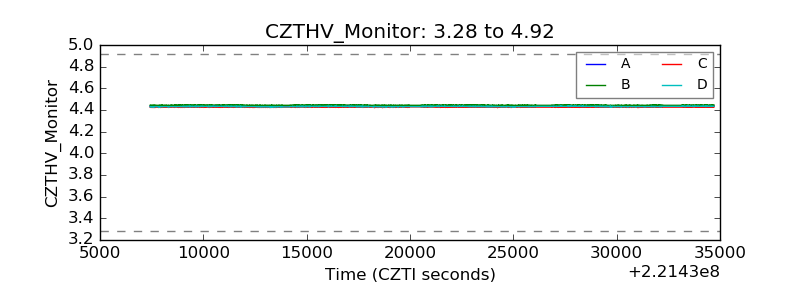 |
| D_VDD | 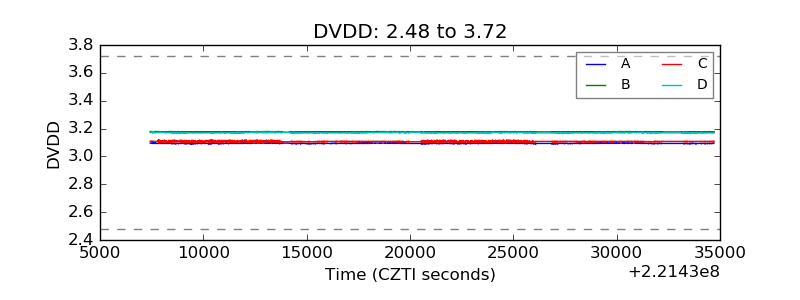 |
| Temperature 1 | 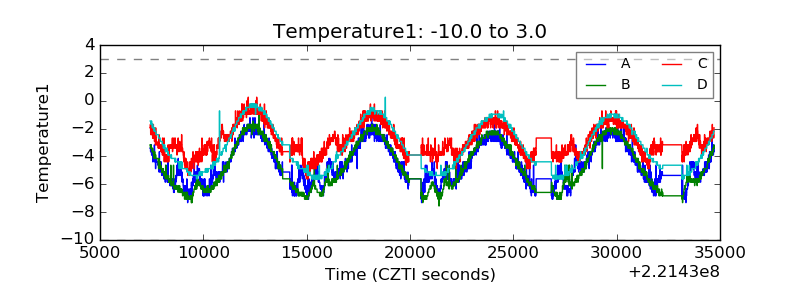 |
| Veto HV Monitor | 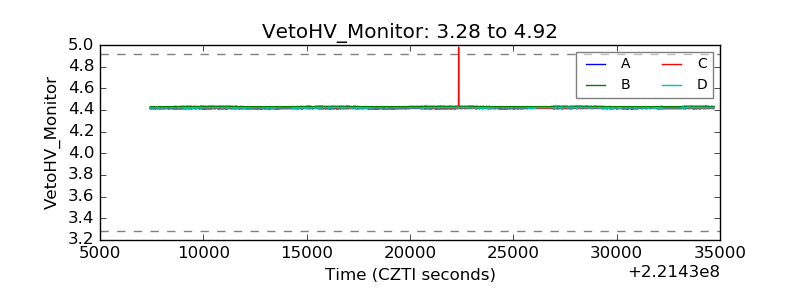 |
| Veto LLD | 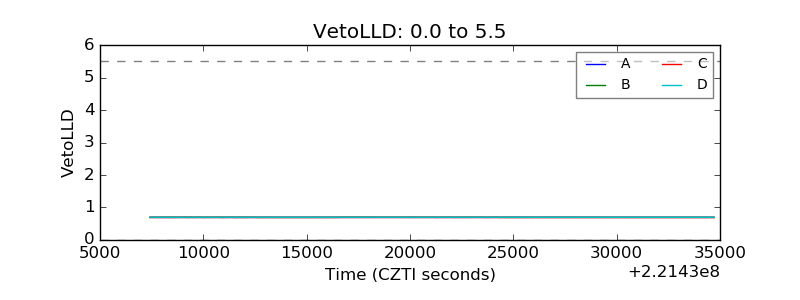 |
| Alpha Counter | 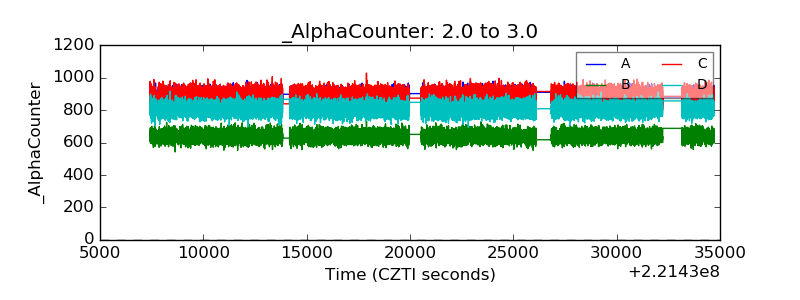 |
| _CPM_Rate | 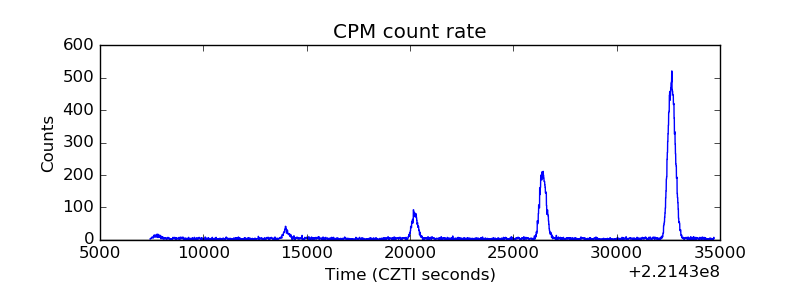 |
| CZT Counter | 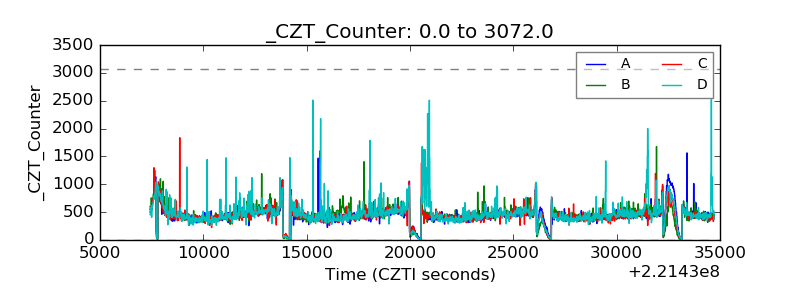 |
| +2.5 Volts monitor | 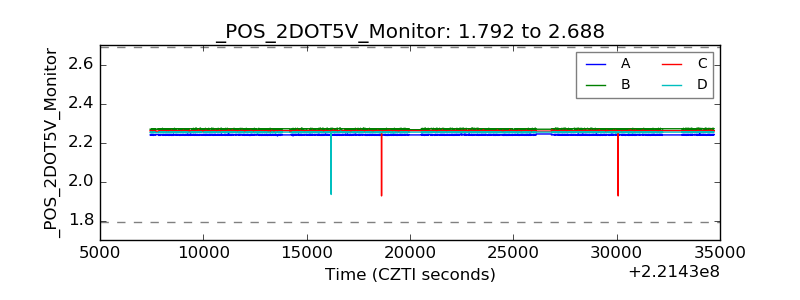 |
| +5 Volts monitor |  |
| _ROLL_ROT | 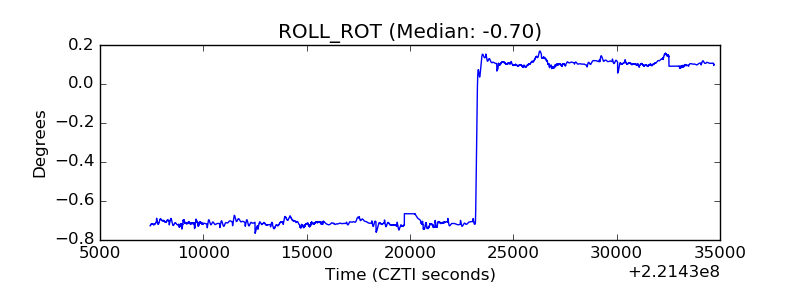 |
| _Roll_DEC | 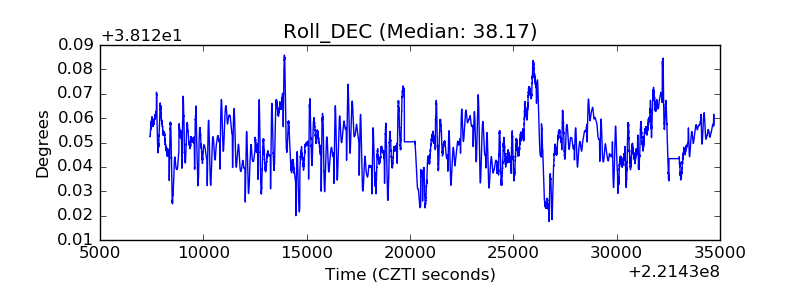 |
| _Roll_RA | 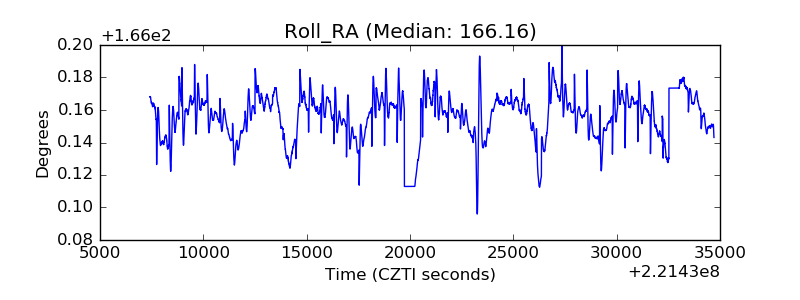 |
| Veto Counter |  |