| Param | Original file | Final file |
|---|---|---|
| Filename | modeM0/AS1A02_005T01_9000000948_06915cztM0_level2.evt | modeM0/AS1A02_005T01_9000000948_06915cztM0_level2_quad_clean.evt |
| Size (bytes) | 392,322,240 | 80,769,600 |
| Size | 374.1 MB | 77.0 MB |
| Events in quadrant A | 2,794,122 | 508,524 |
| Events in quadrant B | 2,926,740 | 513,884 |
| Events in quadrant C | 2,733,593 | 508,602 |
| Events in quadrant D | 3,010,273 | 487,247 |
| Mode SS | |||
|---|---|---|---|
| Quadrant | BADHDUFLAG | Total packets | Discarded packets |
| A | 0 | 124 | 0 |
| B | 0 | 124 | 0 |
| C | 0 | 124 | 0 |
| D | 0 | 124 | 0 |
| Mode M0 | |||
|---|---|---|---|
| Quadrant | BADHDUFLAG | Total packets | Discarded packets |
| A | 0 | 12431 | 2 |
| B | 0 | 12729 | 1 |
| C | 0 | 12404 | 1 |
| D | 0 | 12994 | 1 |
| Mode M9 | |||
|---|---|---|---|
| Quadrant | BADHDUFLAG | Total packets | Discarded packets |
| A | 0 | 11 | 0 |
| B | 0 | 11 | 0 |
| C | 0 | 11 | 0 |
| D | 0 | 11 | 0 |
| Quadrant | Total seconds | Saturated seconds | Saturation percentage |
|---|---|---|---|
| A | 6126 | 53 | 0.865165% |
| B | 6126 | 65 | 1.061051% |
| C | 6126 | 50 | 0.816193% |
| D | 6126 | 73 | 1.191642% |
Noise dominated data is calculated using 1-second bins in cleaned event files. If a bin has >2000 counts, and if more than 50% of those come from <1% of pixels, then it is considered to be noise-dominated and hence unusable.
| Quadrant | # 1 sec bins | Bins with >0 counts | Bins with >2000 counts | High rate bins dominated by noise | Noise dominated (total time) | Noise dominated (detector-on time) | Marked lightcurve |
|---|---|---|---|---|---|---|---|
| A | 7171 | 6127 | 0 | 0 | 0.00% | 0.00% | 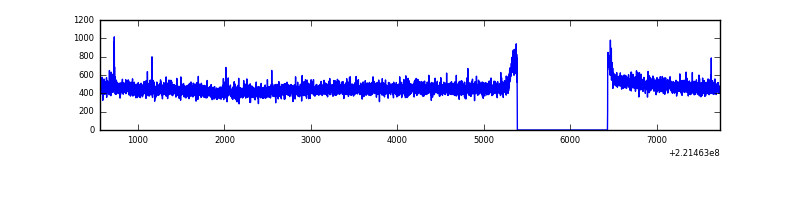 |
| B | 7171 | 6127 | 1 | 1 | 0.01% | 0.02% | 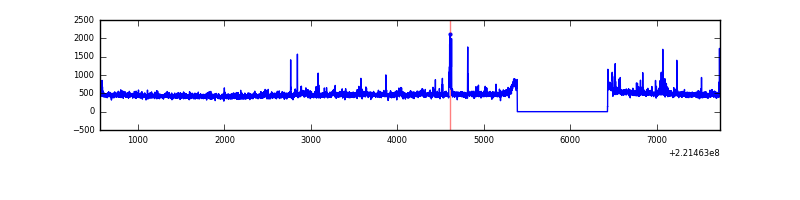 |
| C | 7171 | 6127 | 0 | 0 | 0.00% | 0.00% | 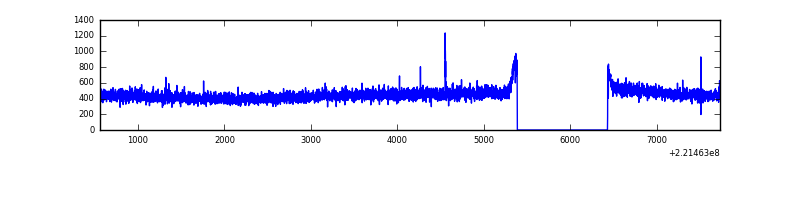 |
| D | 7171 | 6127 | 18 | 18 | 0.25% | 0.29% | 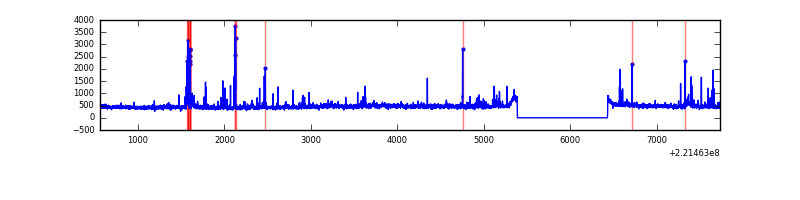 |
Top three noisy pixels from each quadrant. If the there are fewer than three noisy pixels in the level2.evt file, extra rows are filled as -1
| Pixel properties | Quadrant properties | ||||||
|---|---|---|---|---|---|---|---|
| Quadrant | DetID | PixID | Counts | Sigma | Mean | Median | Sigma |
| A | 13 | 14 | 11645 | 74.44 | 719 | 703 | 147.0 |
| A | 13 | 248 | 7511 | 46.32 | 719 | 703 | 147.0 |
| A | 0 | 226 | 7150 | 43.86 | 719 | 703 | 147.0 |
| B | 4 | 81 | 46124 | 329.8 | 719 | 701 | 137.7 |
| B | 4 | 173 | 39333 | 280.49 | 719 | 701 | 137.7 |
| B | 15 | 204 | 20035 | 140.38 | 719 | 701 | 137.7 |
| C | 9 | 247 | 20491 | 123.25 | 692 | 693 | 160.6 |
| C | 13 | 61 | 5556 | 30.27 | 692 | 693 | 160.6 |
| C | 8 | 128 | 5318 | 28.79 | 692 | 693 | 160.6 |
| D | 2 | 33 | 84984 | 492.64 | 696 | 674 | 171.1 |
| D | 8 | 195 | 78492 | 454.71 | 696 | 674 | 171.1 |
| D | 1 | 20 | 64291 | 371.73 | 696 | 674 | 171.1 |
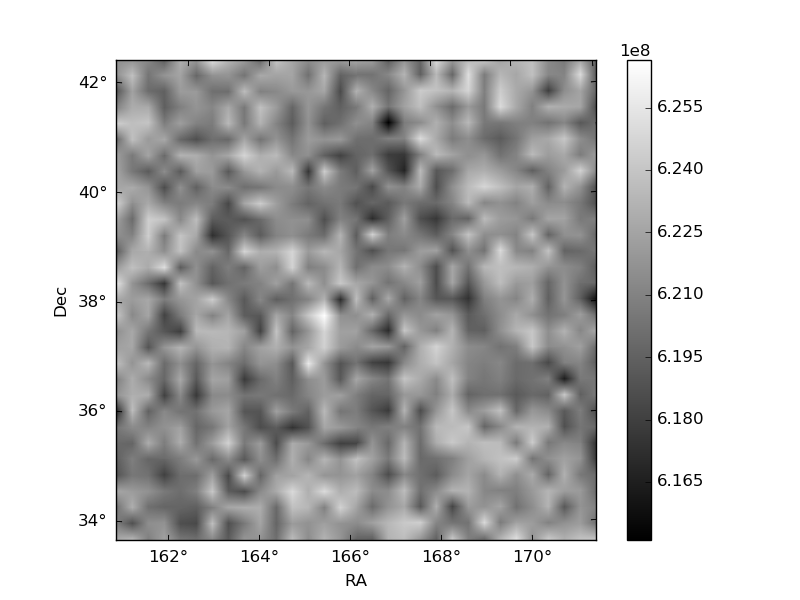
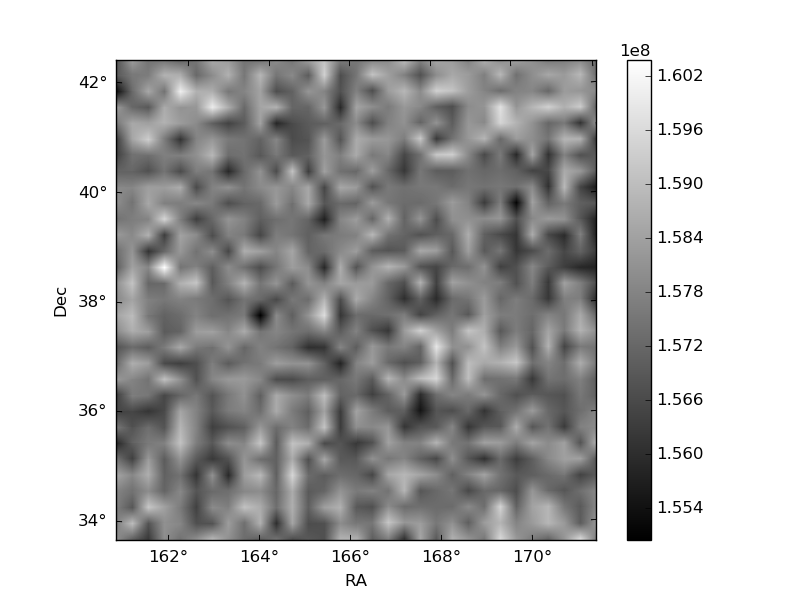
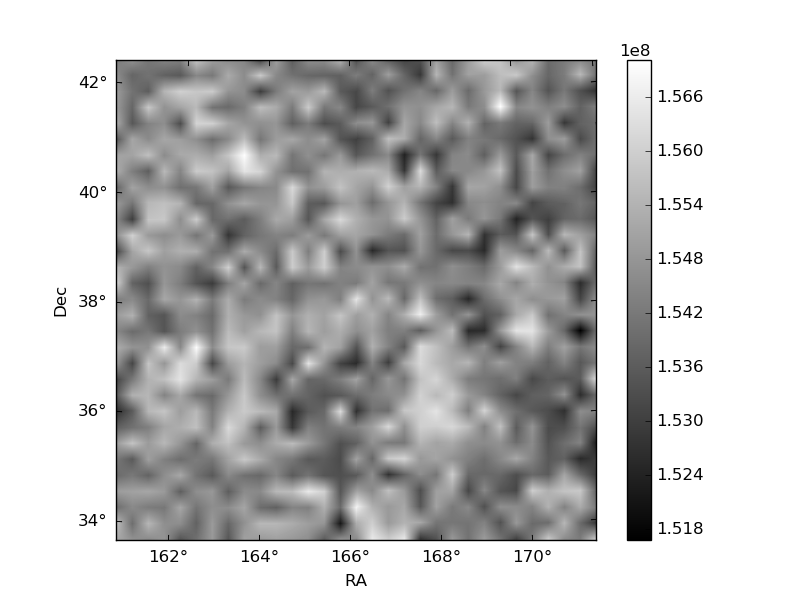
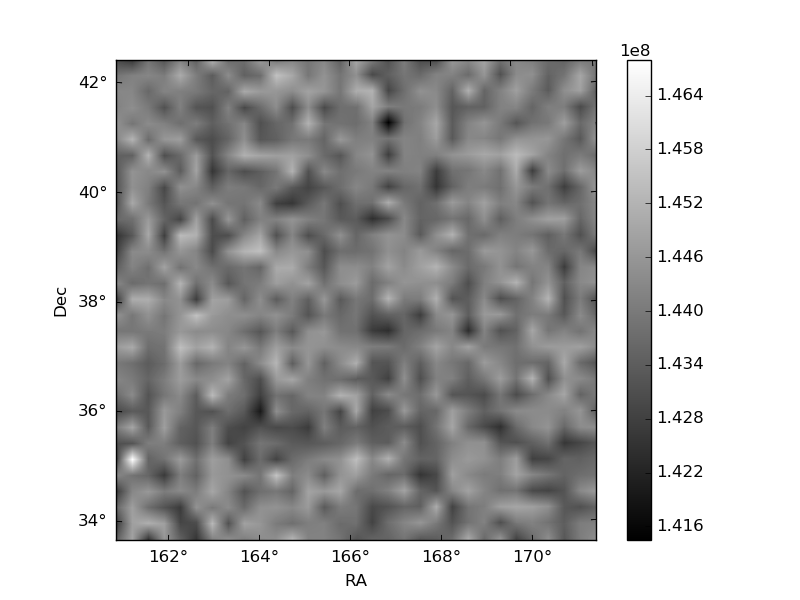
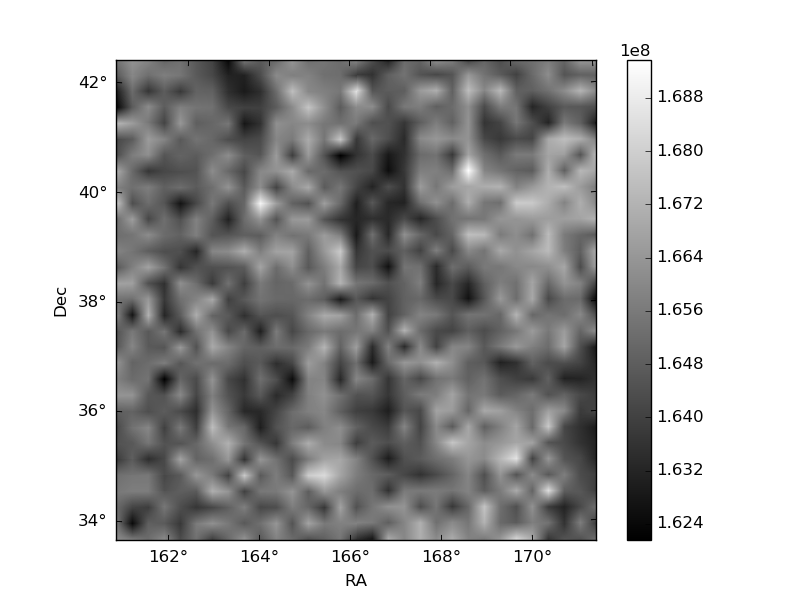
Histogram calculated using DETX and DETY for each event in the final _common_clean file
| Quadrant A | 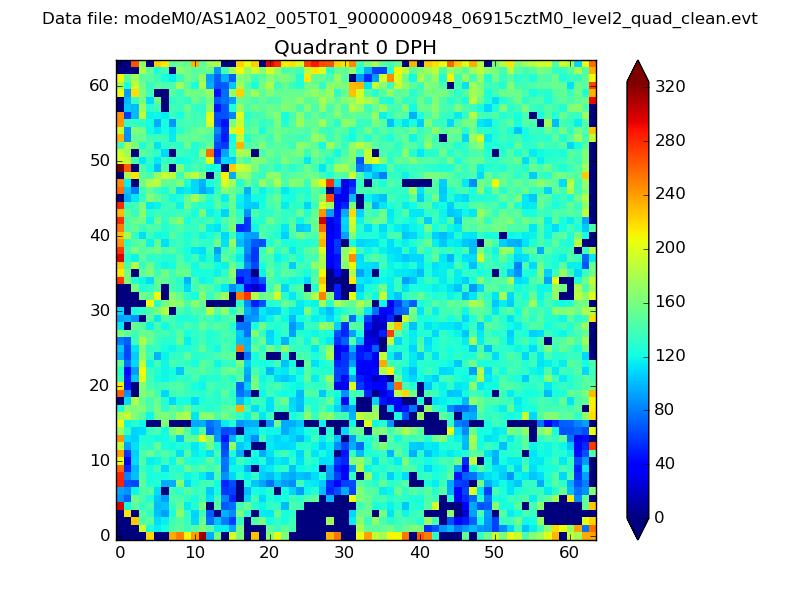 |
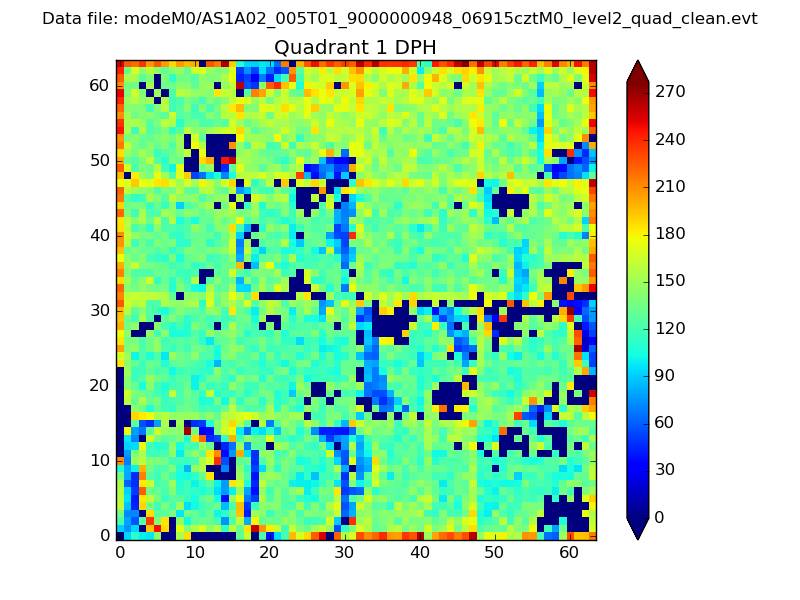 |
Quadrant B |
|---|---|---|---|
| Quadrant D | 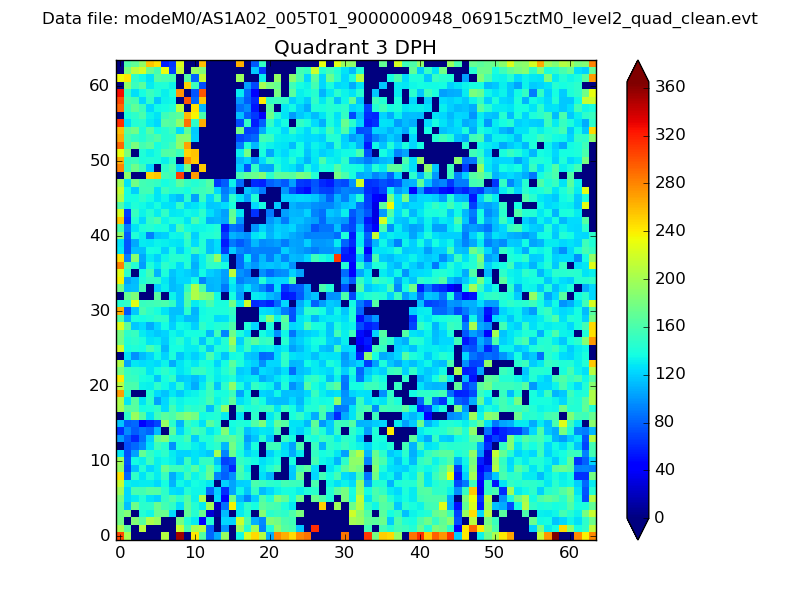 |
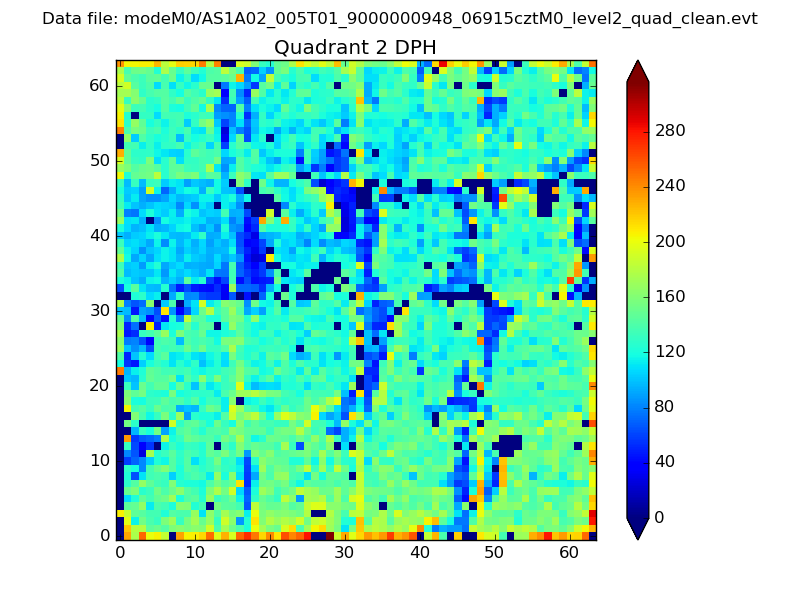 |
Quadrant C |
| Plot type | Count rate plots | Images |
|---|---|---|
| Comparison with Poisson distribution Blue bars denote a histogram of data divided into 1 sec bins. Red curve is a Poisson curve with rate = median count rate of data. |
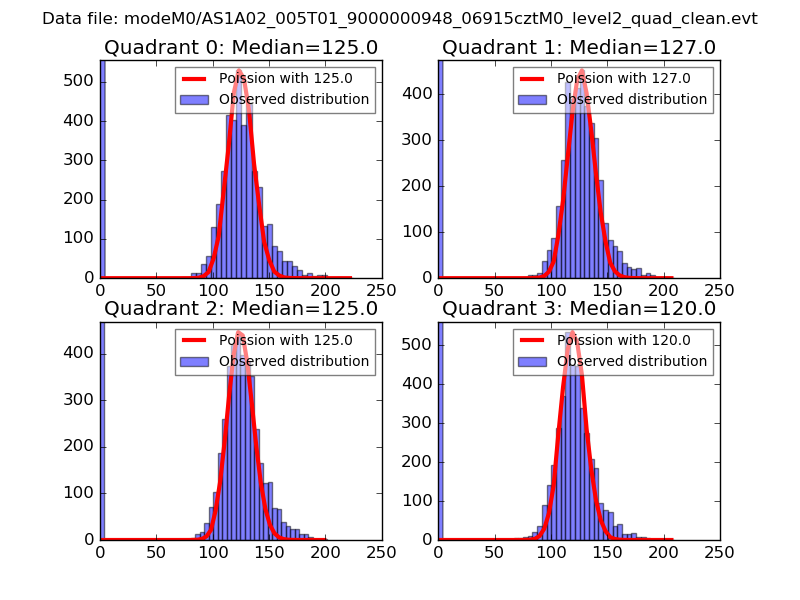 |
 |
| Quadrant-wise count rates Data is divided into 100 sec bins |
 |
|
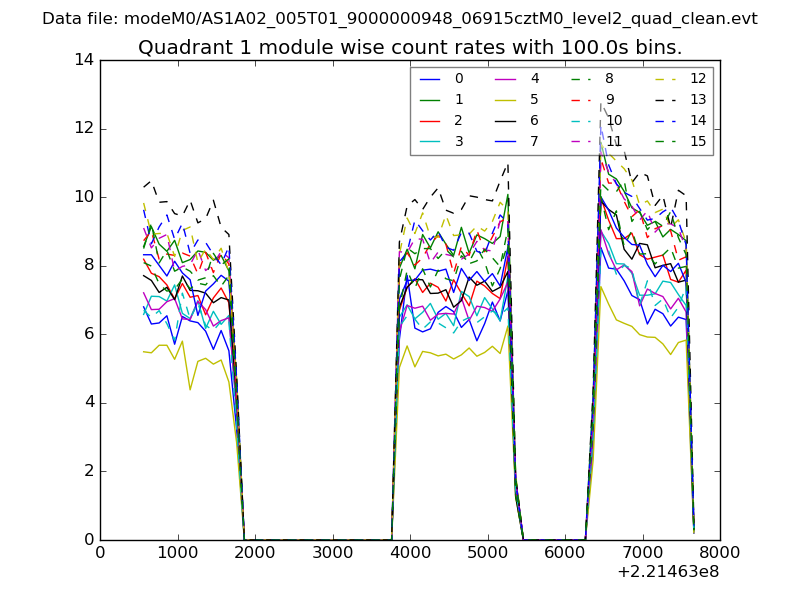
| Module-wise count rates for Quadrant A Data is divided into 100 sec bins |
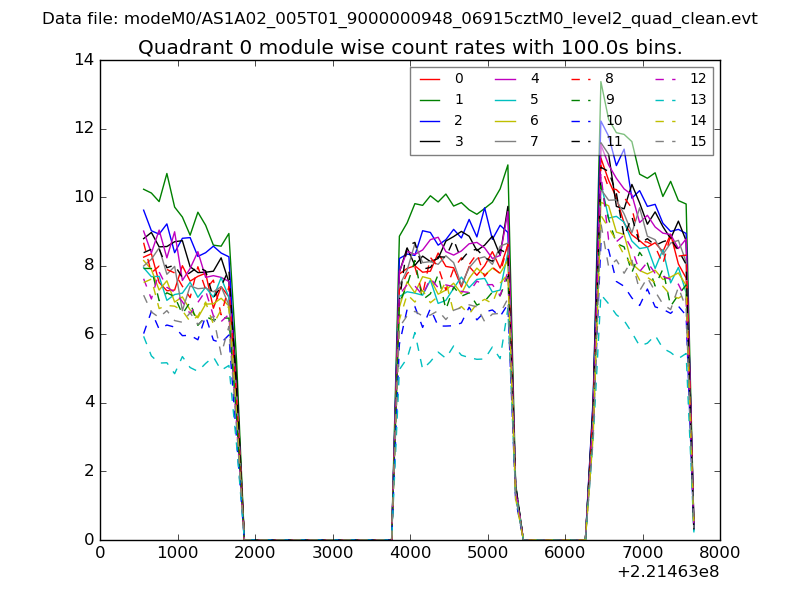 |
 |
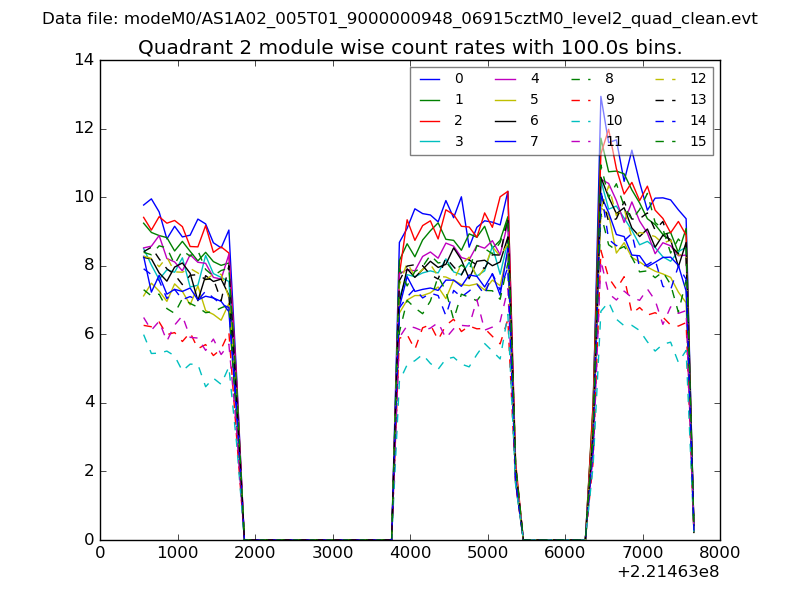
| Module-wise count rates for Quadrant B Data is divided into 100 sec bins |
 |
 |
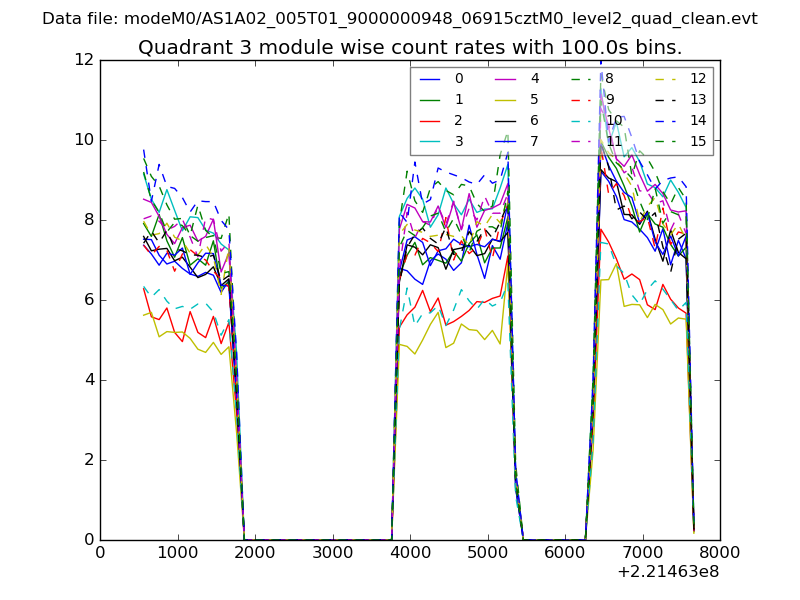
| Module-wise count rates for Quadrant C Data is divided into 100 sec bins |
 |
 |
| Module-wise count rates for Quadrant D Data is divided into 100 sec bins |
 |
 |
| Parameter | Plot |
|---|---|
| CZT HV Monitor | 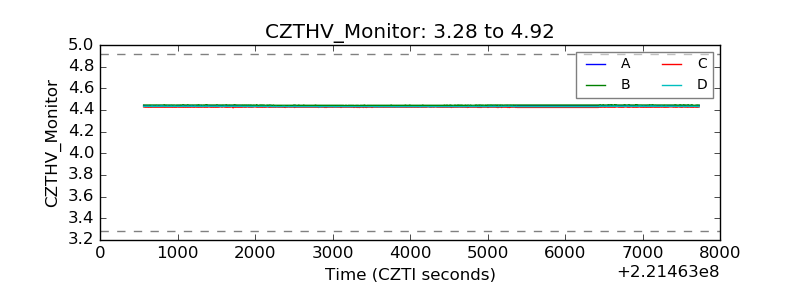 |
| D_VDD | 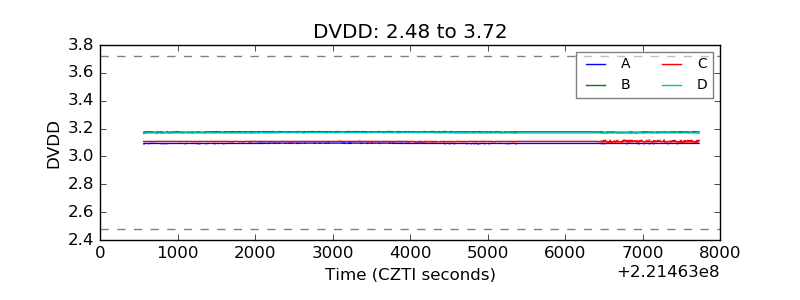 |
| Temperature 1 | 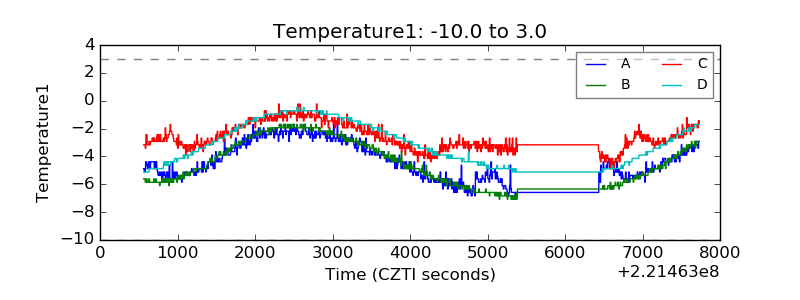 |
| Veto HV Monitor | 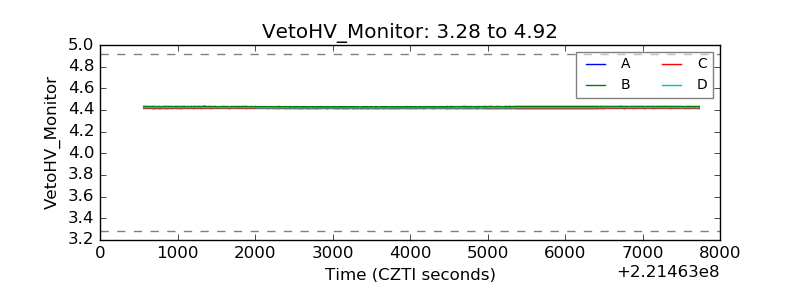 |
| Veto LLD | 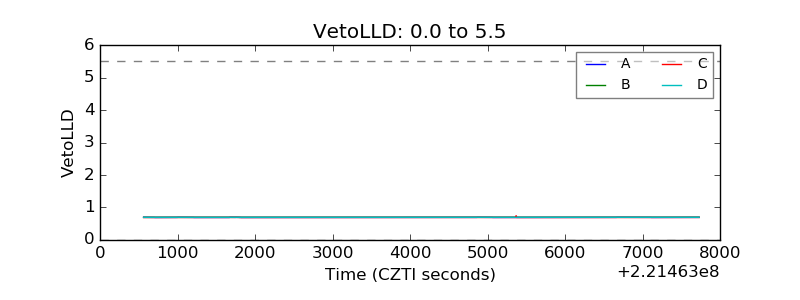 |
| Alpha Counter | 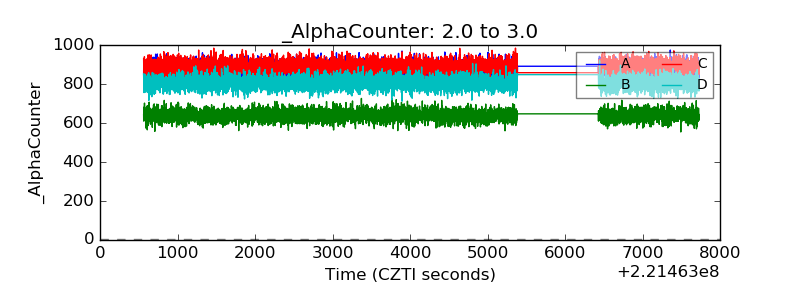 |
| _CPM_Rate | 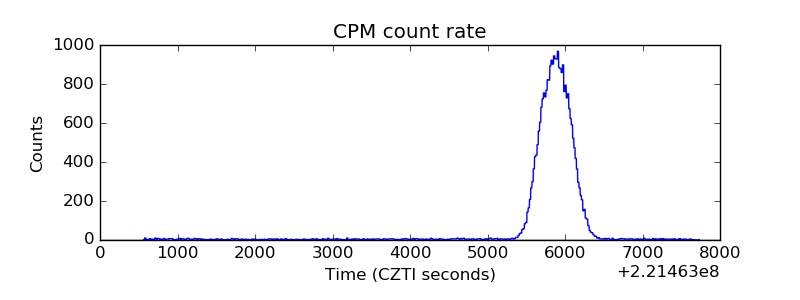 |
| CZT Counter | 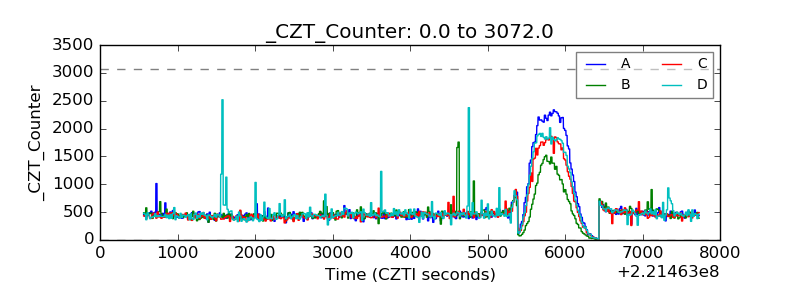 |
| +2.5 Volts monitor | 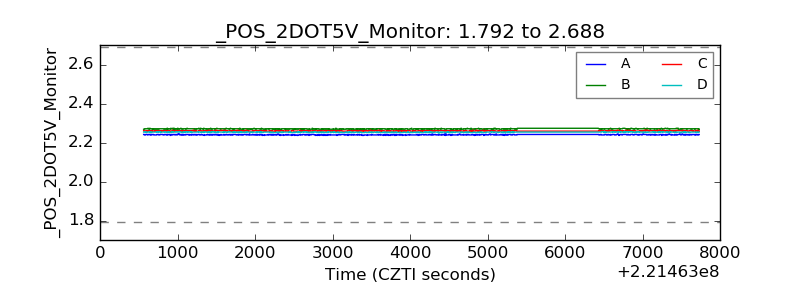 |
| +5 Volts monitor | 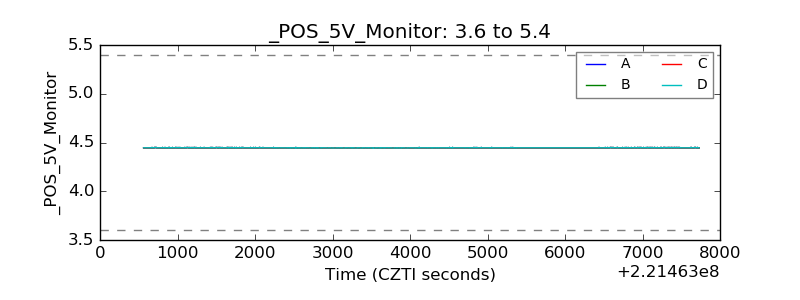 |
| _ROLL_ROT | 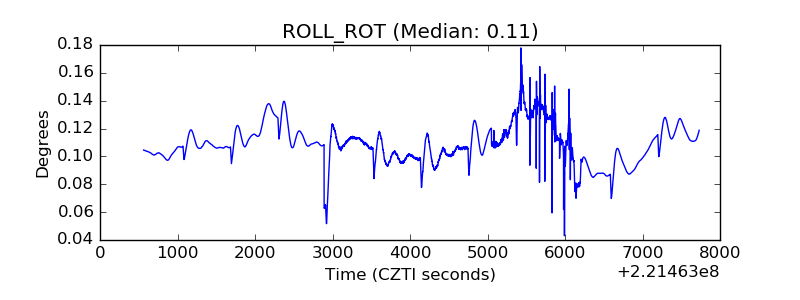 |
| _Roll_DEC | 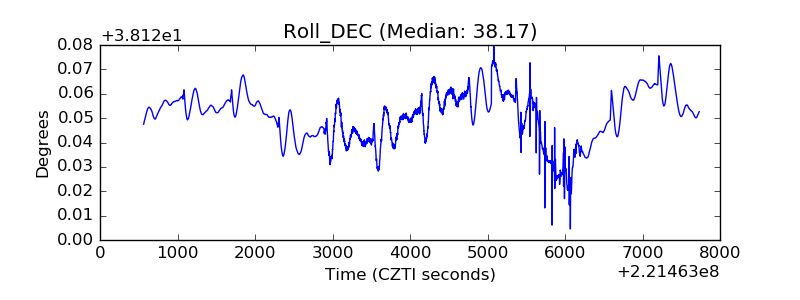 |
| _Roll_RA | 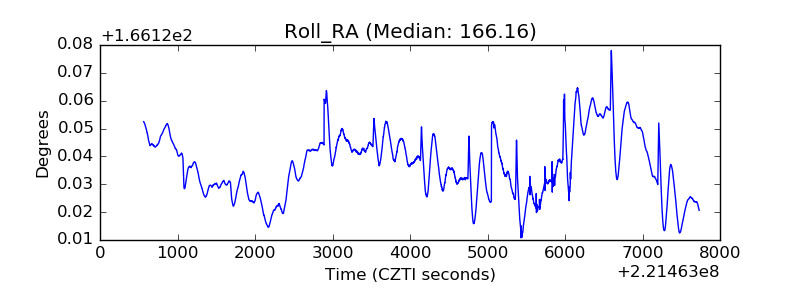 |
| Veto Counter | 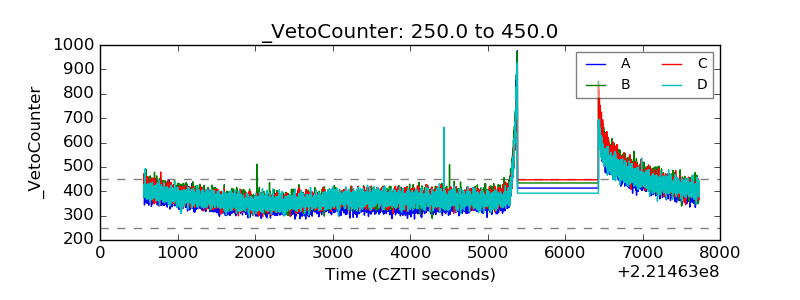 |