| Param | Original file | Final file |
|---|---|---|
| Filename | modeM0/AS1A02_005T01_9000000948_06917cztM0_level2.evt | modeM0/AS1A02_005T01_9000000948_06917cztM0_level2_quad_clean.evt |
| Size (bytes) | 485,864,640 | 78,148,800 |
| Size | 463.4 MB | 74.5 MB |
| Events in quadrant A | 3,316,351 | 480,691 |
| Events in quadrant B | 3,486,154 | 487,986 |
| Events in quadrant C | 3,199,763 | 479,874 |
| Events in quadrant D | 4,267,216 | 460,773 |
| Mode SS | |||
|---|---|---|---|
| Quadrant | BADHDUFLAG | Total packets | Discarded packets |
| A | 0 | 134 | 0 |
| B | 0 | 134 | 0 |
| C | 0 | 134 | 0 |
| D | 0 | 134 | 0 |
| Mode M0 | |||
|---|---|---|---|
| Quadrant | BADHDUFLAG | Total packets | Discarded packets |
| A | 0 | 13968 | 3 |
| B | 0 | 14326 | 2 |
| C | 0 | 13641 | 2 |
| D | 0 | 16915 | 2 |
| Mode M9 | |||
|---|---|---|---|
| Quadrant | BADHDUFLAG | Total packets | Discarded packets |
| A | 0 | 12 | 0 |
| B | 0 | 12 | 0 |
| C | 0 | 12 | 0 |
| D | 0 | 13 | 0 |
| Quadrant | Total seconds | Saturated seconds | Saturation percentage |
|---|---|---|---|
| A | 6552 | 114 | 1.739927% |
| B | 6552 | 102 | 1.556777% |
| C | 6552 | 82 | 1.251526% |
| D | 6552 | 258 | 3.937729% |
Noise dominated data is calculated using 1-second bins in cleaned event files. If a bin has >2000 counts, and if more than 50% of those come from <1% of pixels, then it is considered to be noise-dominated and hence unusable.
| Quadrant | # 1 sec bins | Bins with >0 counts | Bins with >2000 counts | High rate bins dominated by noise | Noise dominated (total time) | Noise dominated (detector-on time) | Marked lightcurve |
|---|---|---|---|---|---|---|---|
| A | 7797 | 6553 | 17 | 17 | 0.22% | 0.26% | 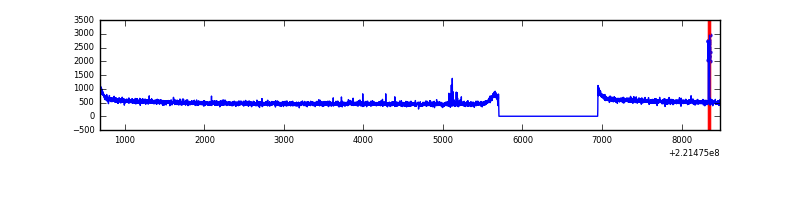 |
| B | 7797 | 6553 | 3 | 3 | 0.04% | 0.05% | 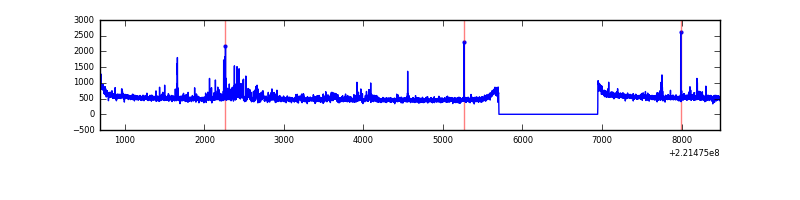 |
| C | 7797 | 6553 | 0 | 0 | 0.00% | 0.00% | 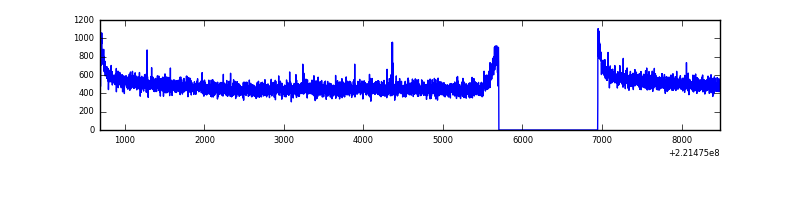 |
| D | 7797 | 6553 | 162 | 162 | 2.08% | 2.47% | 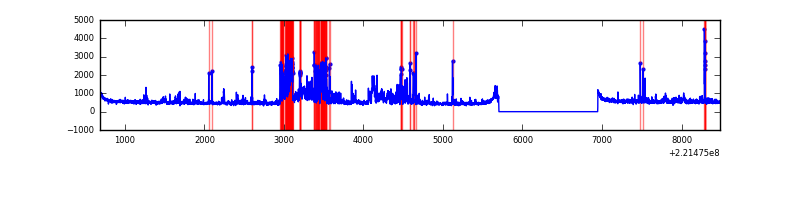 |
Top three noisy pixels from each quadrant. If the there are fewer than three noisy pixels in the level2.evt file, extra rows are filled as -1
| Pixel properties | Quadrant properties | ||||||
|---|---|---|---|---|---|---|---|
| Quadrant | DetID | PixID | Counts | Sigma | Mean | Median | Sigma |
| A | 0 | 128 | 47034 | 271.65 | 846 | 832 | 170.1 |
| A | 0 | 226 | 8297 | 43.89 | 846 | 832 | 170.1 |
| A | 12 | 194 | 7811 | 41.03 | 846 | 832 | 170.1 |
| B | 0 | 228 | 143419 | 902.23 | 841 | 825 | 158.0 |
| B | 0 | 214 | 22950 | 139.99 | 841 | 825 | 158.0 |
| B | 0 | 219 | 17093 | 102.93 | 841 | 825 | 158.0 |
| C | 9 | 247 | 19032 | 97.56 | 813 | 818 | 186.7 |
| C | 13 | 61 | 6602 | 30.98 | 813 | 818 | 186.7 |
| C | 10 | 22 | 3028 | 11.84 | 813 | 818 | 186.7 |
| D | 1 | 20 | 915823 | 4602.6 | 817 | 793 | 198.8 |
| D | 2 | 152 | 80410 | 400.47 | 817 | 793 | 198.8 |
| D | 2 | 136 | 67049 | 333.27 | 817 | 793 | 198.8 |
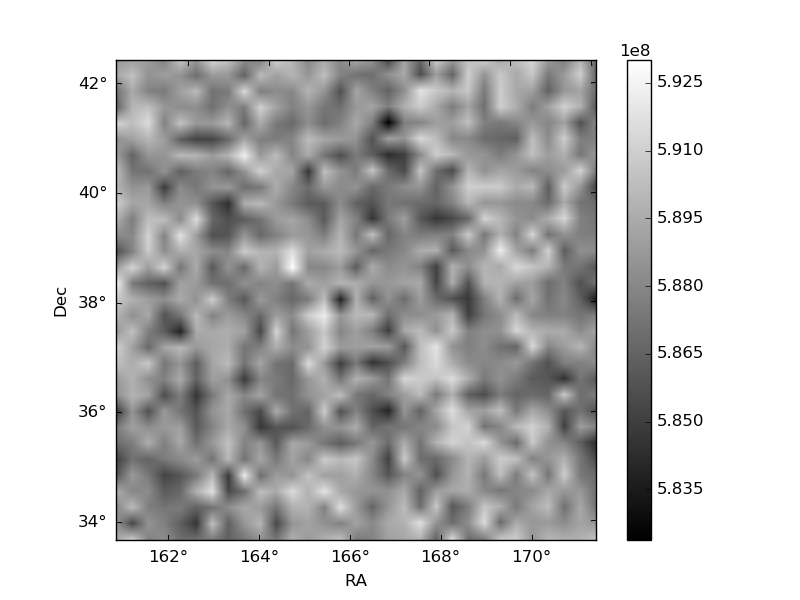
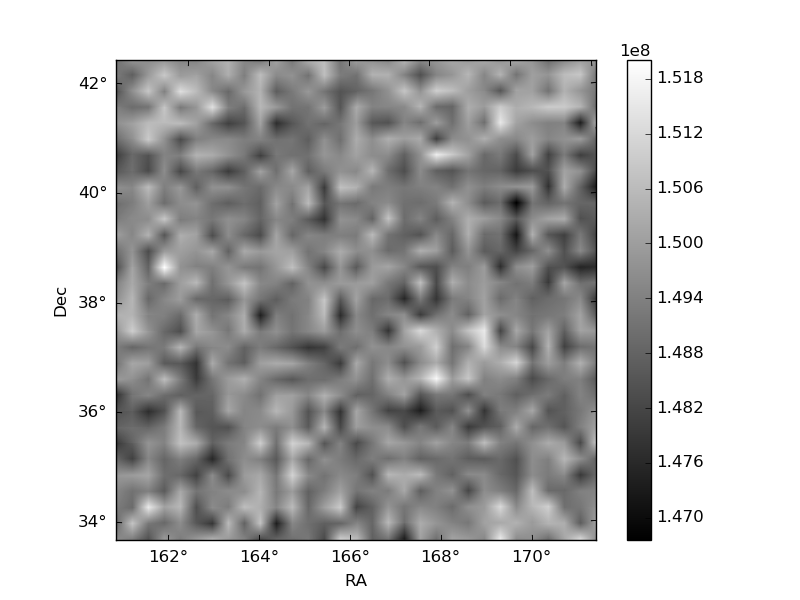
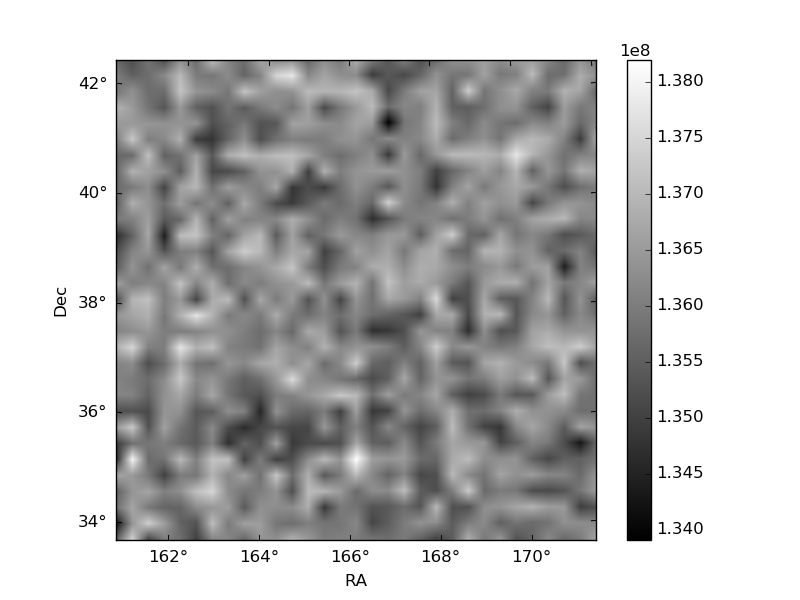
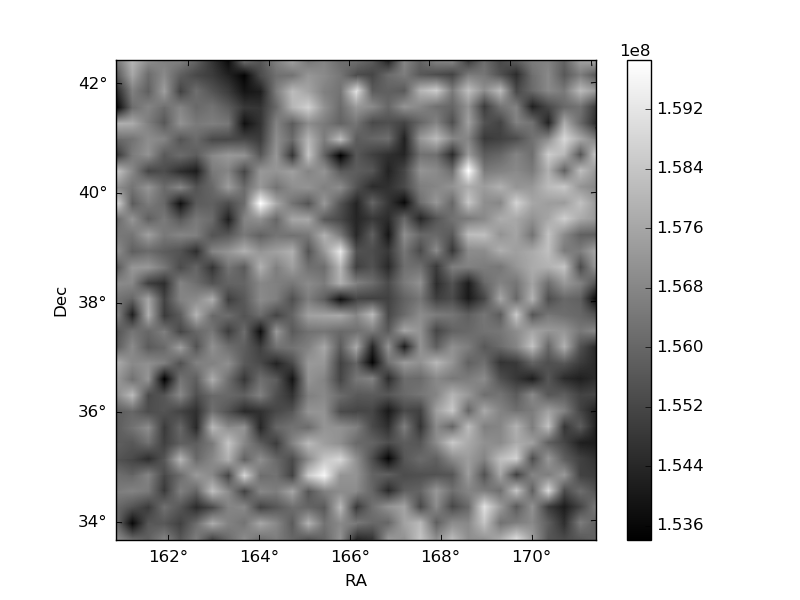
Histogram calculated using DETX and DETY for each event in the final _common_clean file
| Quadrant A | 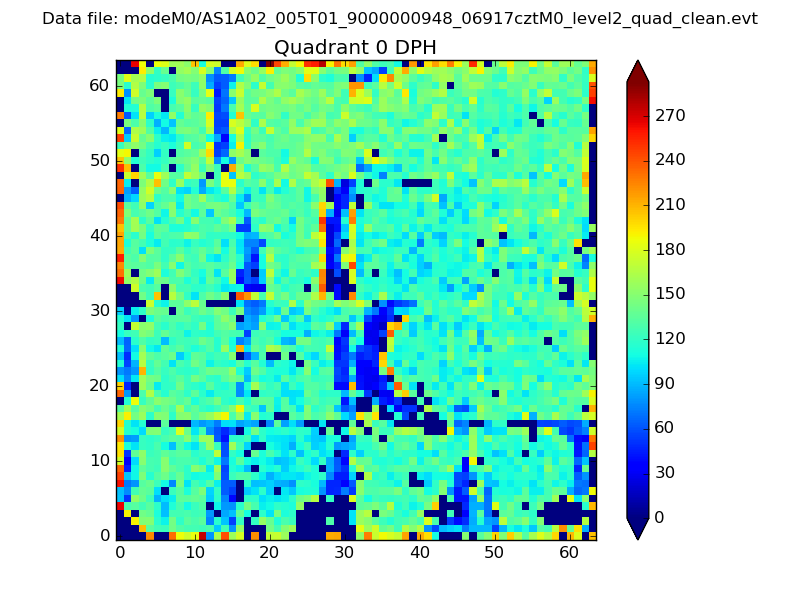 |
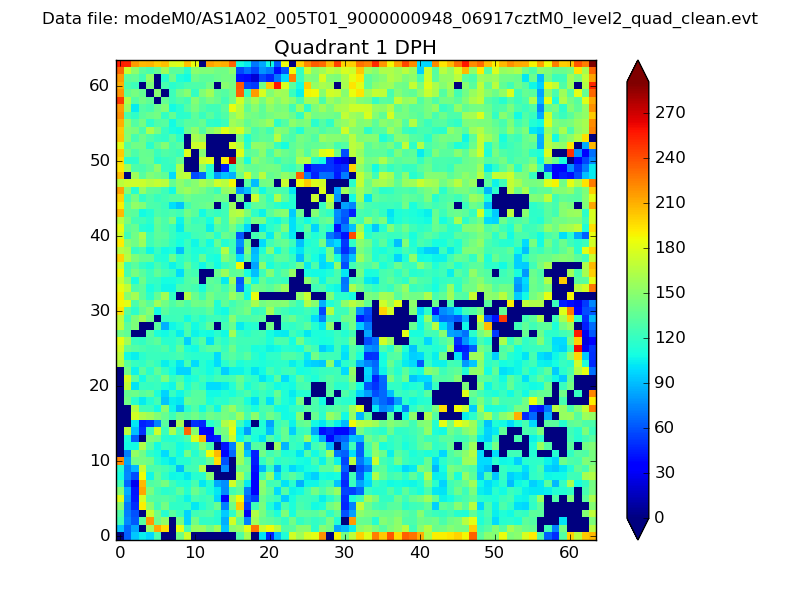 |
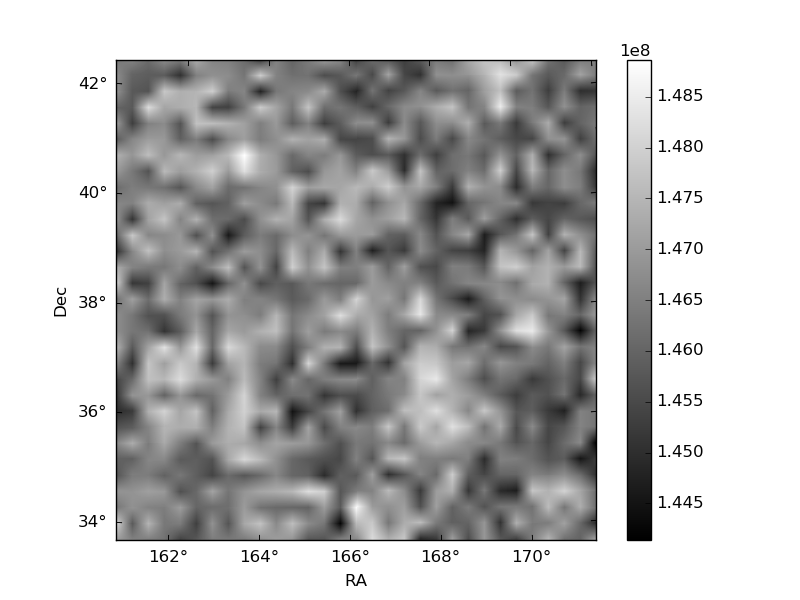
Quadrant B |
|---|---|---|---|
| Quadrant D | 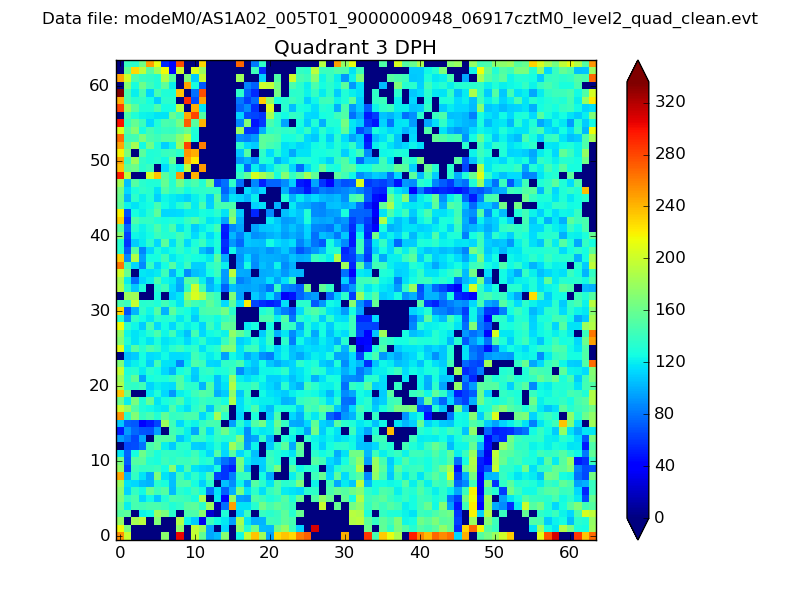 |
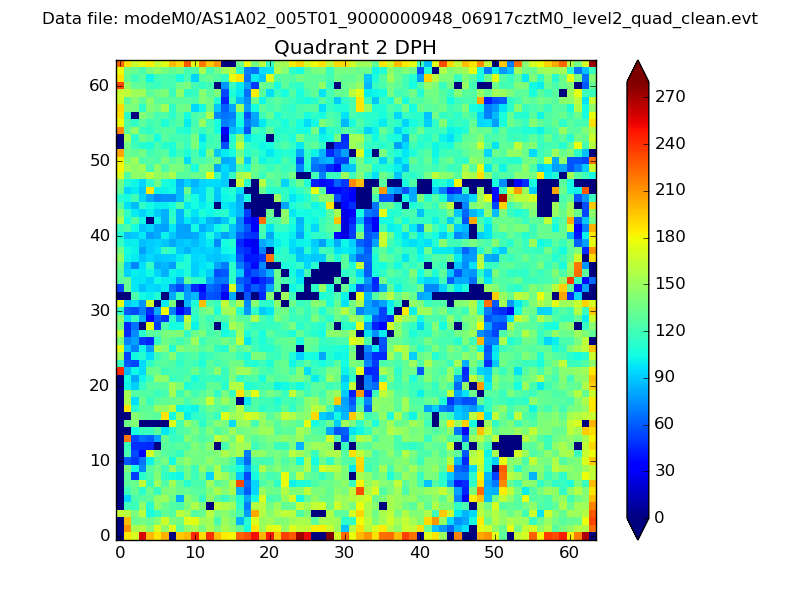 |
Quadrant C |
| Plot type | Count rate plots | Images |
|---|---|---|
| Comparison with Poisson distribution Blue bars denote a histogram of data divided into 1 sec bins. Red curve is a Poisson curve with rate = median count rate of data. |
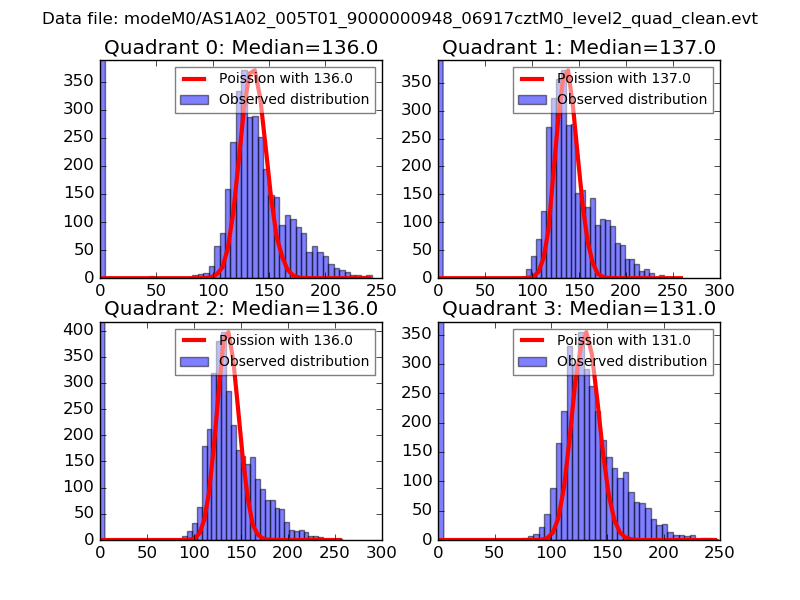 |
 |
| Quadrant-wise count rates Data is divided into 100 sec bins |
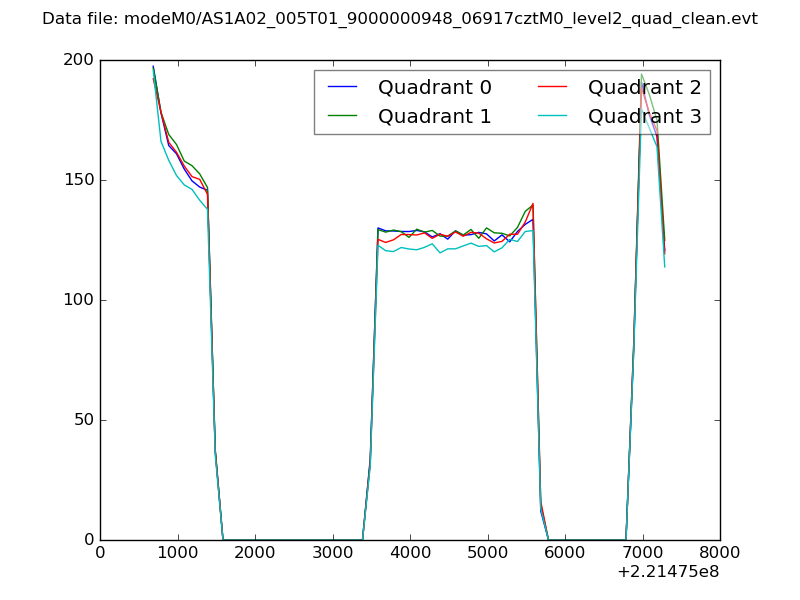 |
|
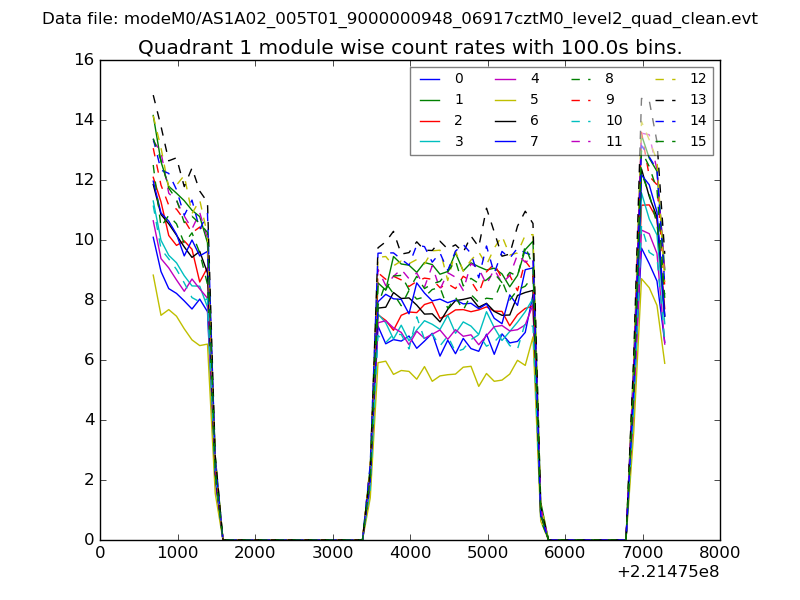
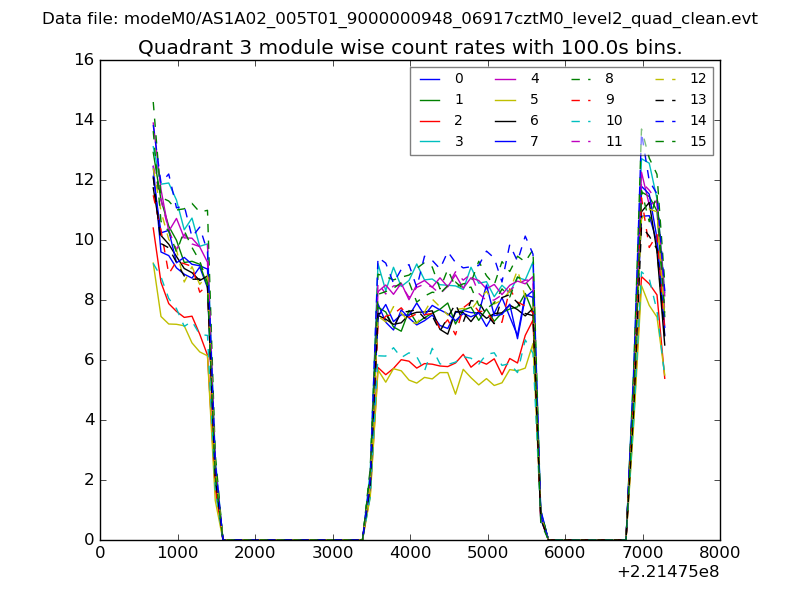
| Module-wise count rates for Quadrant A Data is divided into 100 sec bins |
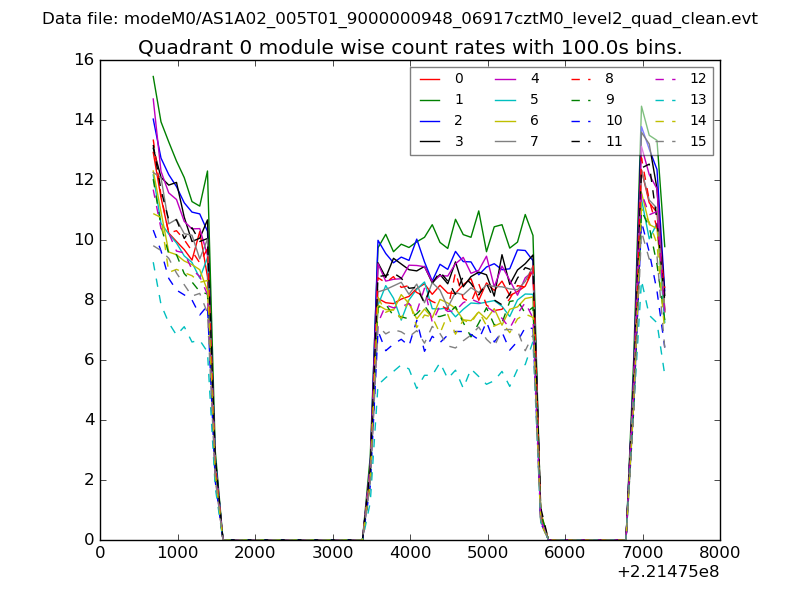 |
 |
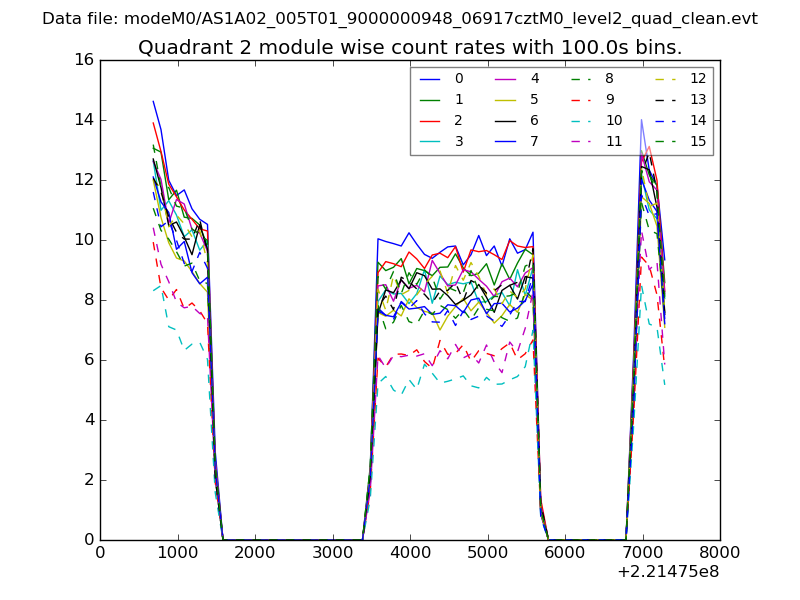
| Module-wise count rates for Quadrant B Data is divided into 100 sec bins |
 |
 |
| Module-wise count rates for Quadrant C Data is divided into 100 sec bins |
 |
 |
| Module-wise count rates for Quadrant D Data is divided into 100 sec bins |
 |
 |
| Parameter | Plot |
|---|---|
| CZT HV Monitor | 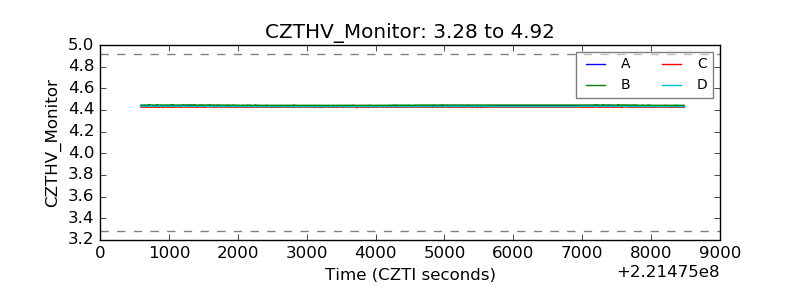 |
| D_VDD | 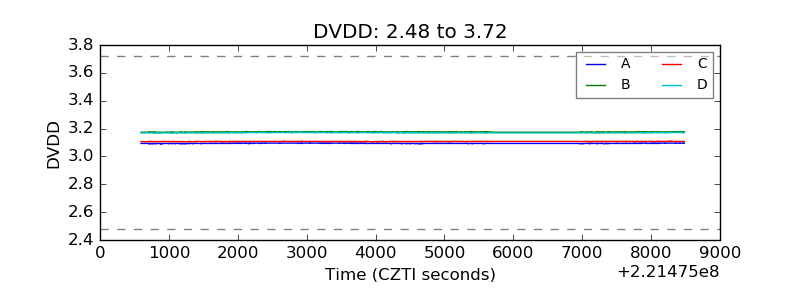 |
| Temperature 1 | 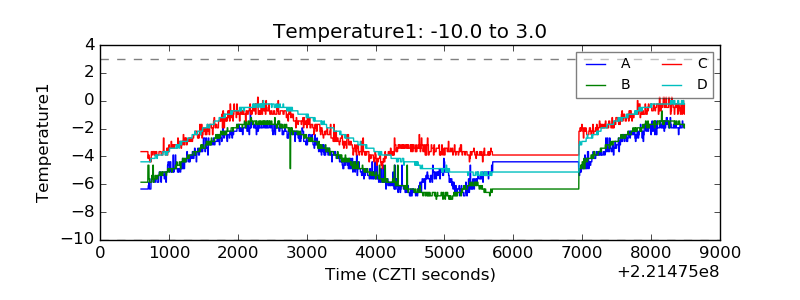 |
| Veto HV Monitor | 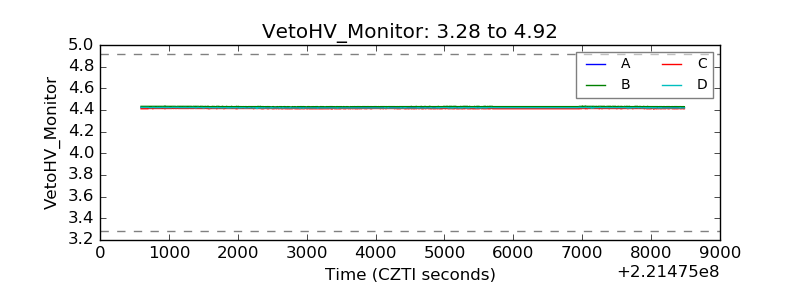 |
| Veto LLD | 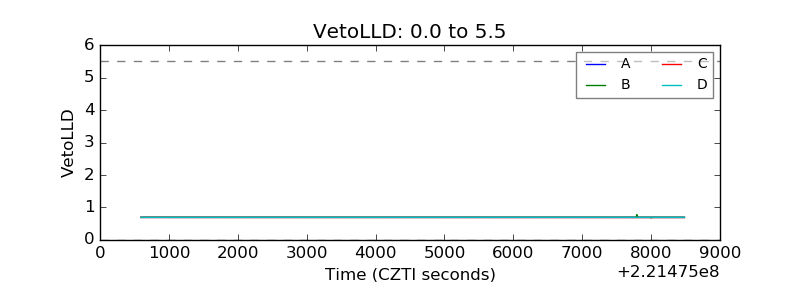 |
| Alpha Counter | 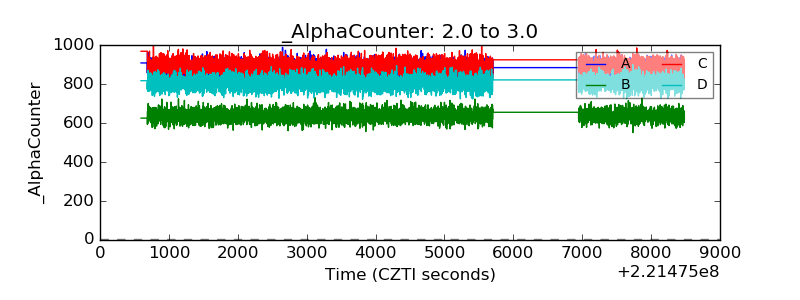 |
| _CPM_Rate | 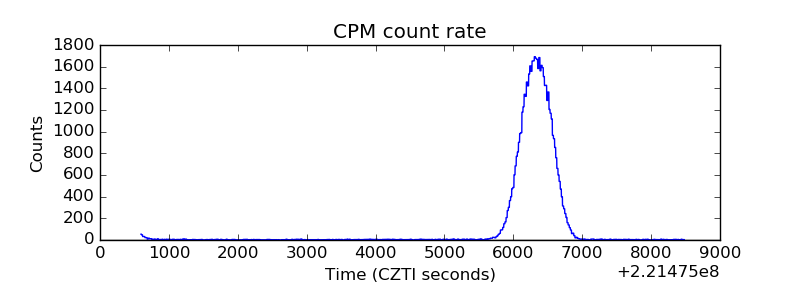 |
| CZT Counter | 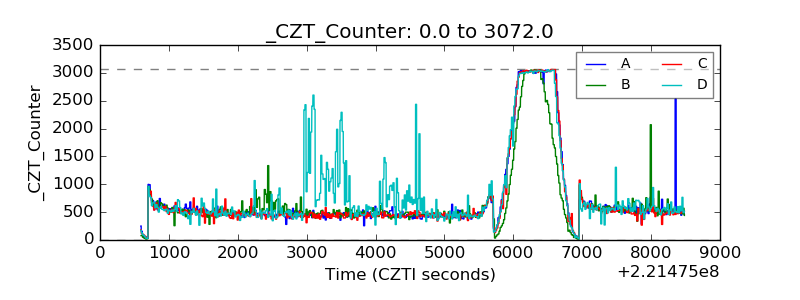 |
| +2.5 Volts monitor | 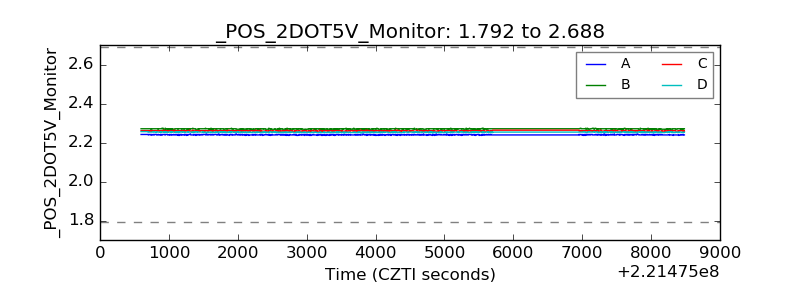 |
| +5 Volts monitor | 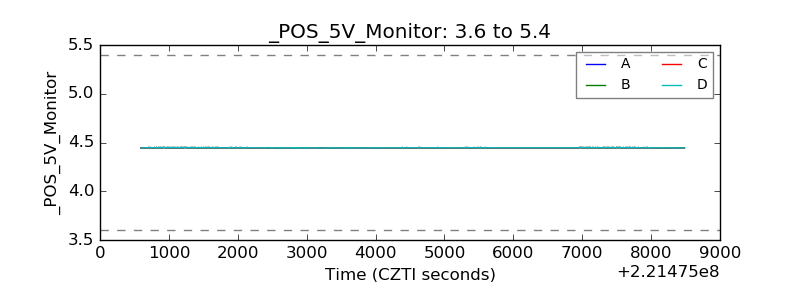 |
| _ROLL_ROT | 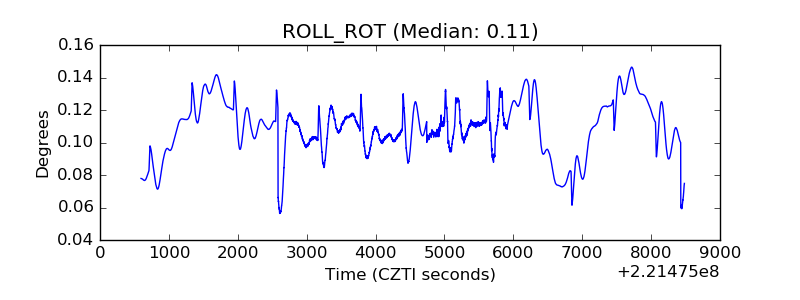 |
| _Roll_DEC | 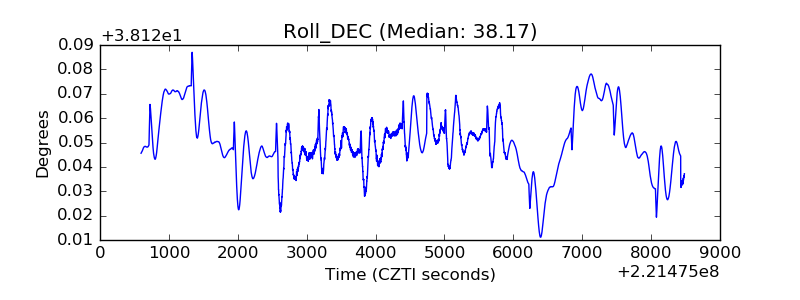 |
| _Roll_RA | 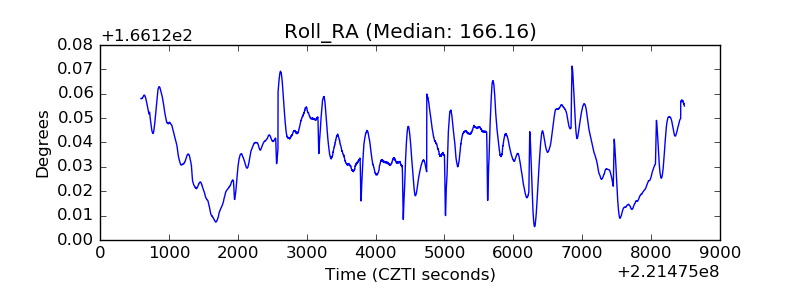 |
| Veto Counter | 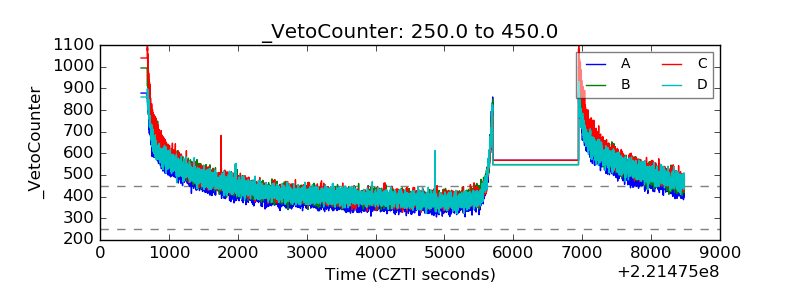 |