| Param | Original file | Final file |
|---|---|---|
| Filename | modeM0/AS1A02_005T01_9000000948_06918cztM0_level2.evt | modeM0/AS1A02_005T01_9000000948_06918cztM0_level2_quad_clean.evt |
| Size (bytes) | 480,553,920 | 67,798,080 |
| Size | 458.3 MB | 64.7 MB |
| Events in quadrant A | 3,498,417 | 401,868 |
| Events in quadrant B | 3,437,008 | 407,176 |
| Events in quadrant C | 3,303,512 | 402,162 |
| Events in quadrant D | 3,872,569 | 387,520 |
| Mode SS | |||
|---|---|---|---|
| Quadrant | BADHDUFLAG | Total packets | Discarded packets |
| A | 0 | 132 | 0 |
| B | 0 | 132 | 0 |
| C | 0 | 132 | 0 |
| D | 0 | 132 | 0 |
| Mode M0 | |||
|---|---|---|---|
| Quadrant | BADHDUFLAG | Total packets | Discarded packets |
| A | 0 | 14430 | 3 |
| B | 0 | 14211 | 2 |
| C | 0 | 13773 | 2 |
| D | 0 | 15623 | 2 |
| Mode M9 | |||
|---|---|---|---|
| Quadrant | BADHDUFLAG | Total packets | Discarded packets |
| A | 0 | 15 | 0 |
| B | 0 | 15 | 0 |
| C | 0 | 15 | 0 |
| D | 0 | 16 | 0 |
| Quadrant | Total seconds | Saturated seconds | Saturation percentage |
|---|---|---|---|
| A | 6509 | 149 | 2.289138% |
| B | 6509 | 108 | 1.659241% |
| C | 6509 | 99 | 1.520971% |
| D | 6509 | 209 | 3.210939% |
Noise dominated data is calculated using 1-second bins in cleaned event files. If a bin has >2000 counts, and if more than 50% of those come from <1% of pixels, then it is considered to be noise-dominated and hence unusable.
| Quadrant | # 1 sec bins | Bins with >0 counts | Bins with >2000 counts | High rate bins dominated by noise | Noise dominated (total time) | Noise dominated (detector-on time) | Marked lightcurve |
|---|---|---|---|---|---|---|---|
| A | 7809 | 6510 | 29 | 29 | 0.37% | 0.45% | 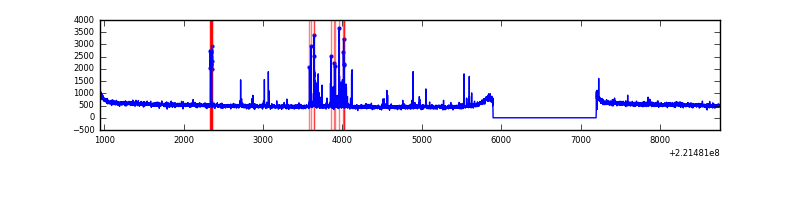 |
| B | 7809 | 6510 | 1 | 1 | 0.01% | 0.02% | 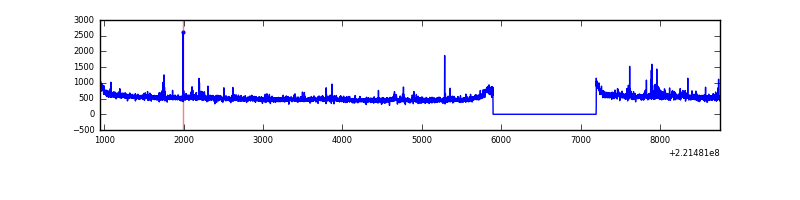 |
| C | 7809 | 6510 | 0 | 0 | 0.00% | 0.00% | 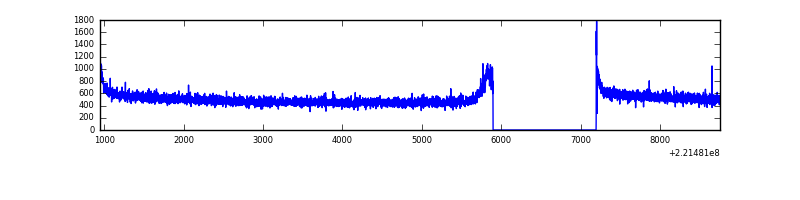 |
| D | 7809 | 6510 | 83 | 83 | 1.06% | 1.27% | 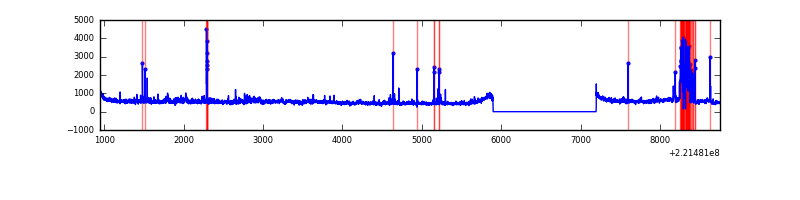 |
Top three noisy pixels from each quadrant. If the there are fewer than three noisy pixels in the level2.evt file, extra rows are filled as -1
| Pixel properties | Quadrant properties | ||||||
|---|---|---|---|---|---|---|---|
| Quadrant | DetID | PixID | Counts | Sigma | Mean | Median | Sigma |
| A | 15 | 223 | 154862 | 897.65 | 857 | 841 | 171.6 |
| A | 0 | 128 | 39343 | 224.39 | 857 | 841 | 171.6 |
| A | 0 | 226 | 8474 | 44.49 | 857 | 841 | 171.6 |
| B | 0 | 214 | 40503 | 246.38 | 856 | 838 | 161.0 |
| B | 0 | 228 | 31167 | 188.39 | 856 | 838 | 161.0 |
| B | 4 | 173 | 18722 | 111.08 | 856 | 838 | 161.0 |
| C | 9 | 247 | 48741 | 253.94 | 829 | 836 | 188.6 |
| C | 13 | 61 | 6645 | 30.79 | 829 | 836 | 188.6 |
| C | 1 | 16 | 5807 | 26.35 | 829 | 836 | 188.6 |
| D | 2 | 33 | 270199 | 1329.23 | 831 | 807 | 202.7 |
| D | 1 | 20 | 205871 | 1011.83 | 831 | 807 | 202.7 |
| D | 8 | 195 | 67390 | 328.53 | 831 | 807 | 202.7 |
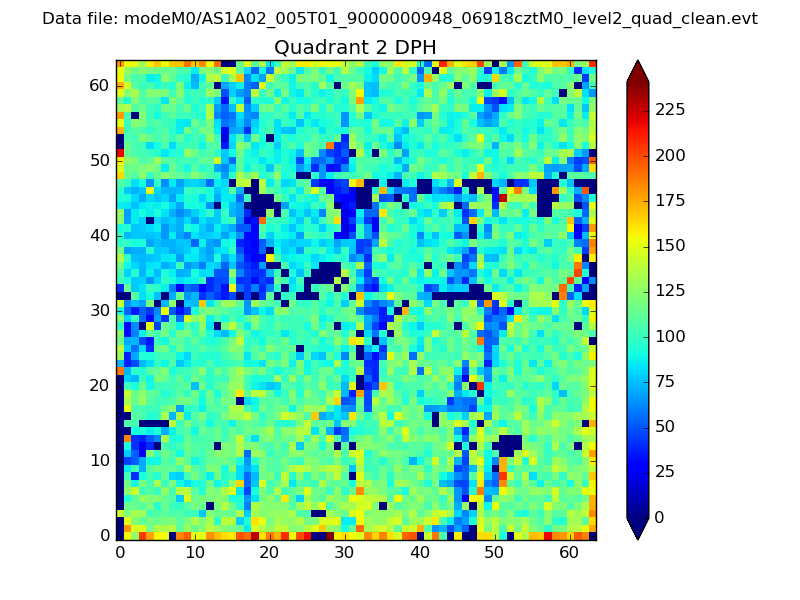
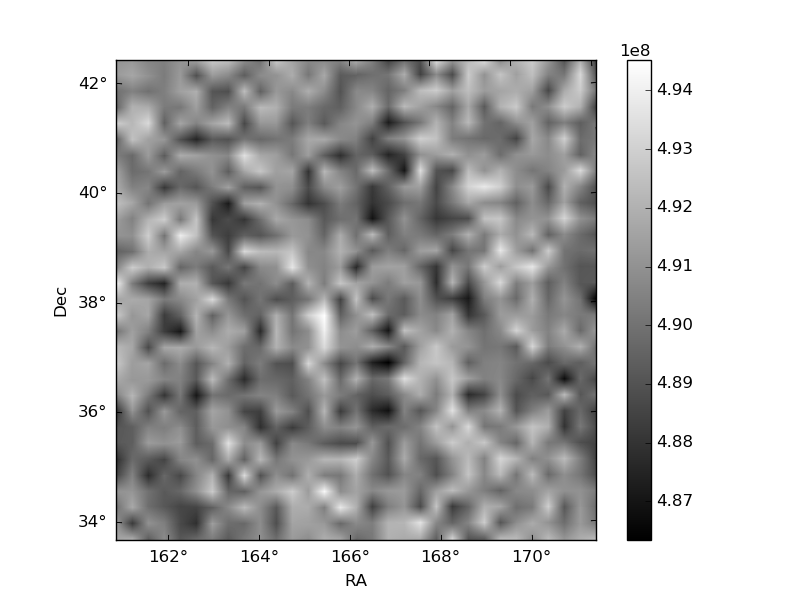
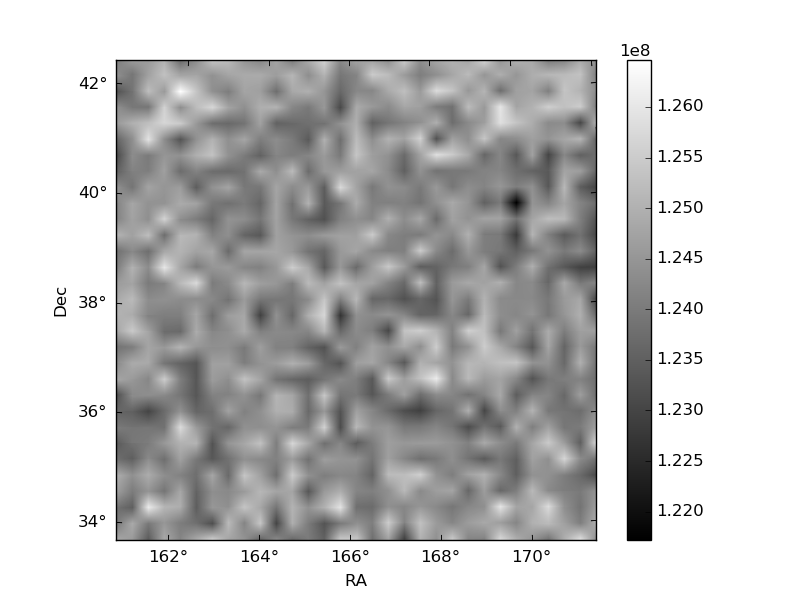
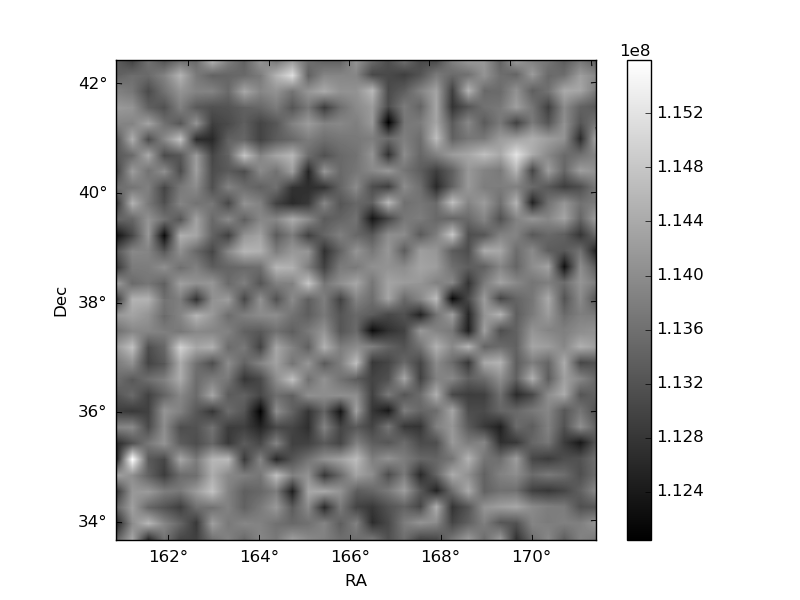
Histogram calculated using DETX and DETY for each event in the final _common_clean file
| Quadrant A | 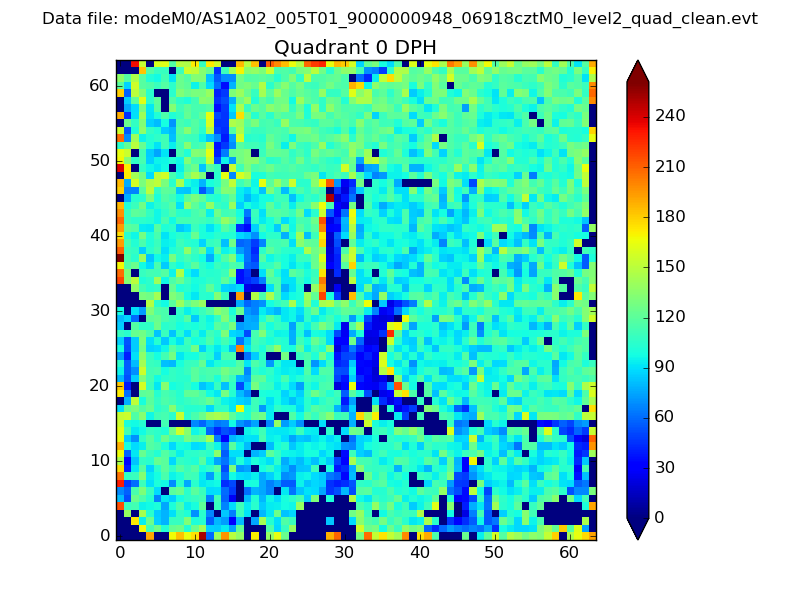 |
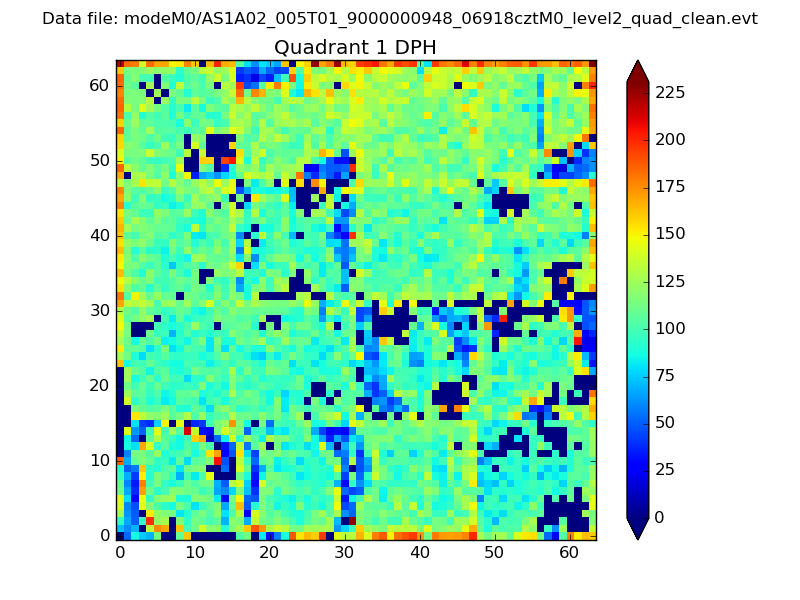 |
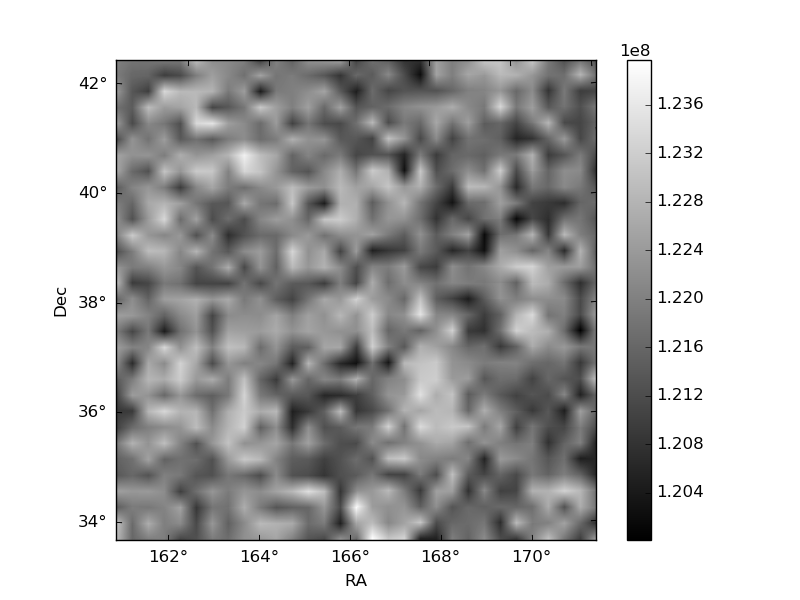
Quadrant B |
|---|---|---|---|
| Quadrant D | 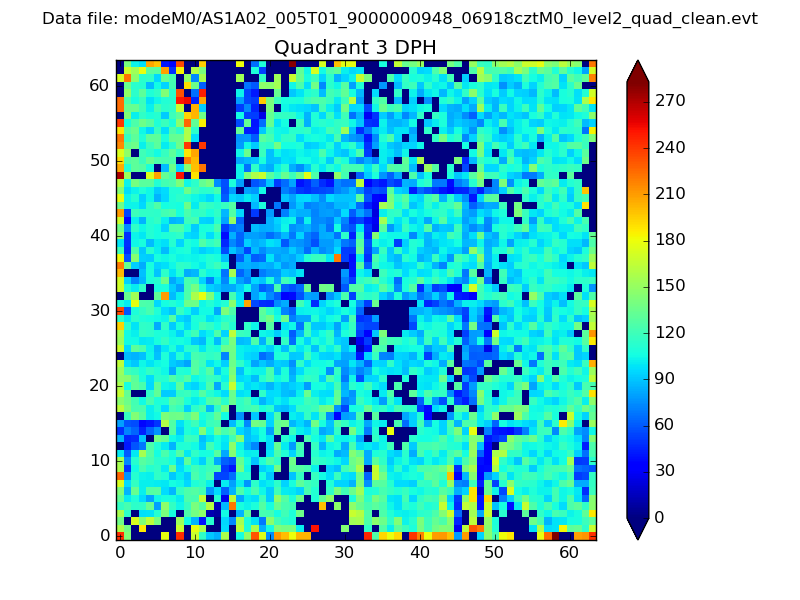 |
 |
Quadrant C |
| Plot type | Count rate plots | Images |
|---|---|---|
| Comparison with Poisson distribution Blue bars denote a histogram of data divided into 1 sec bins. Red curve is a Poisson curve with rate = median count rate of data. |
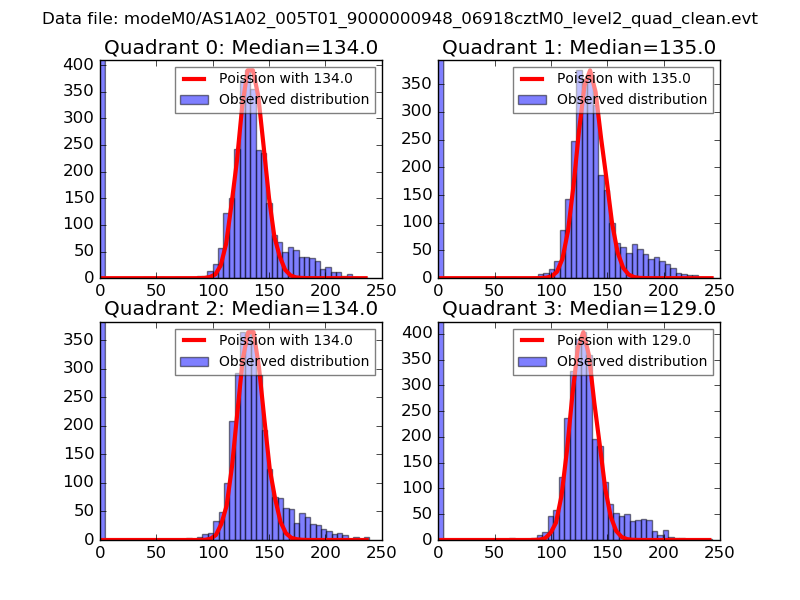 |
 |
| Quadrant-wise count rates Data is divided into 100 sec bins |
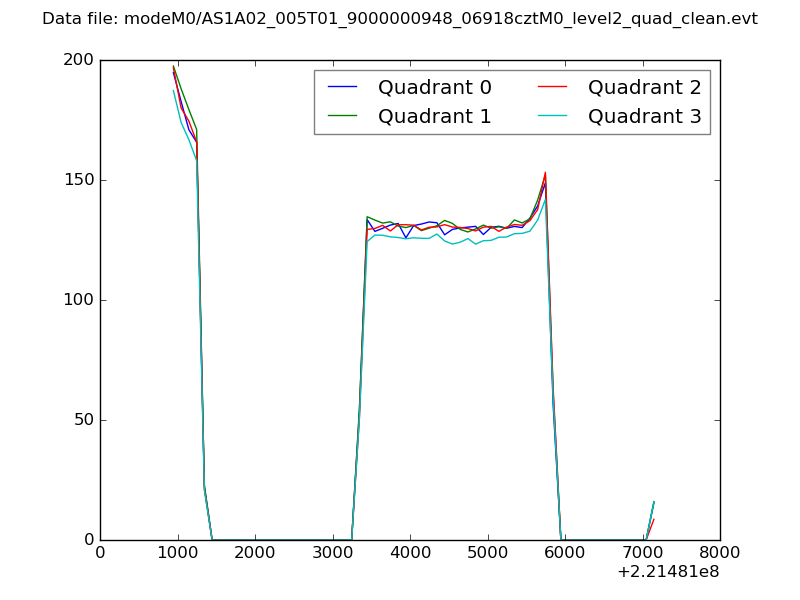 |
|
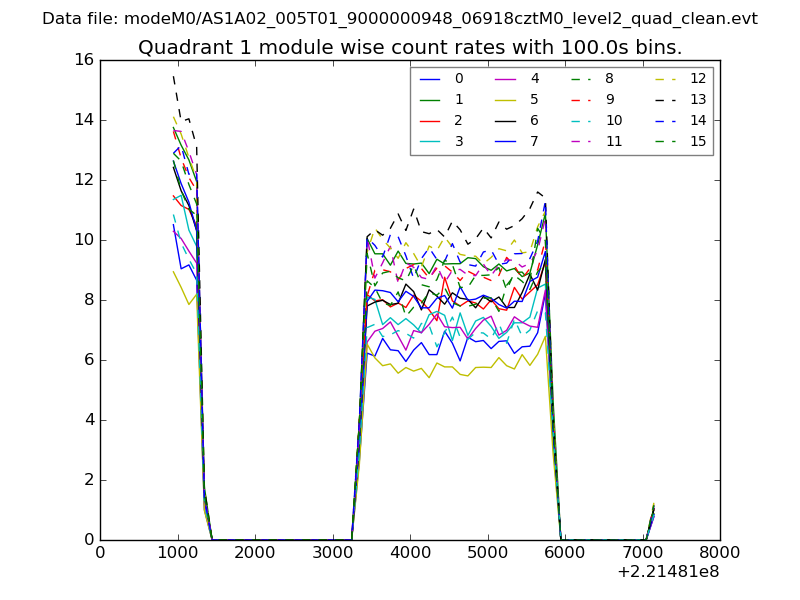
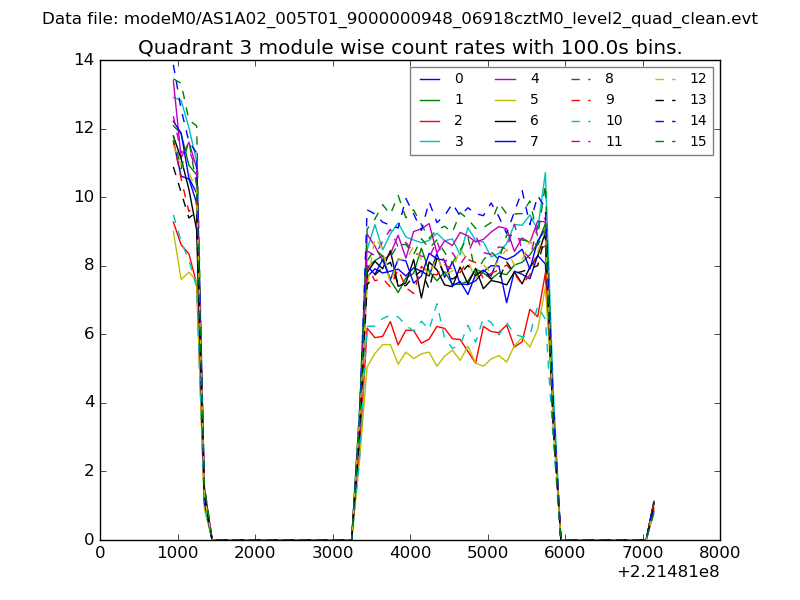
| Module-wise count rates for Quadrant A Data is divided into 100 sec bins |
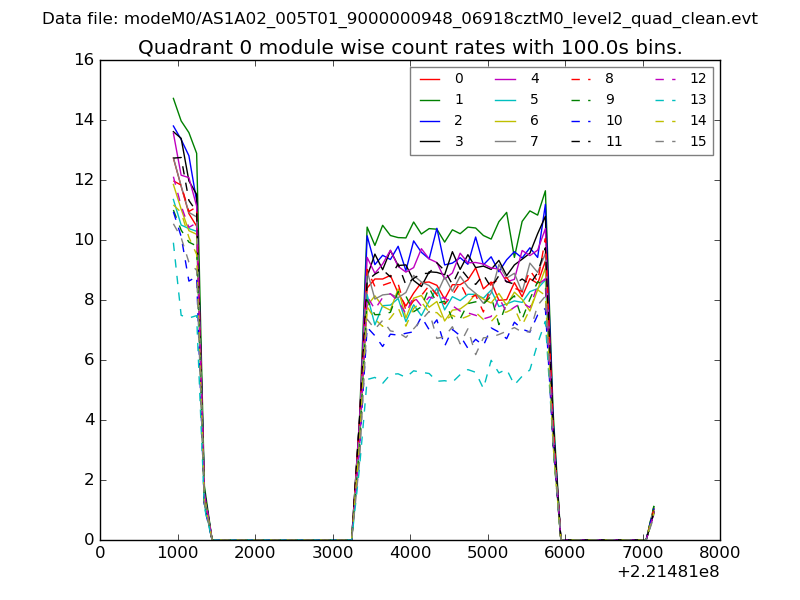 |
 |
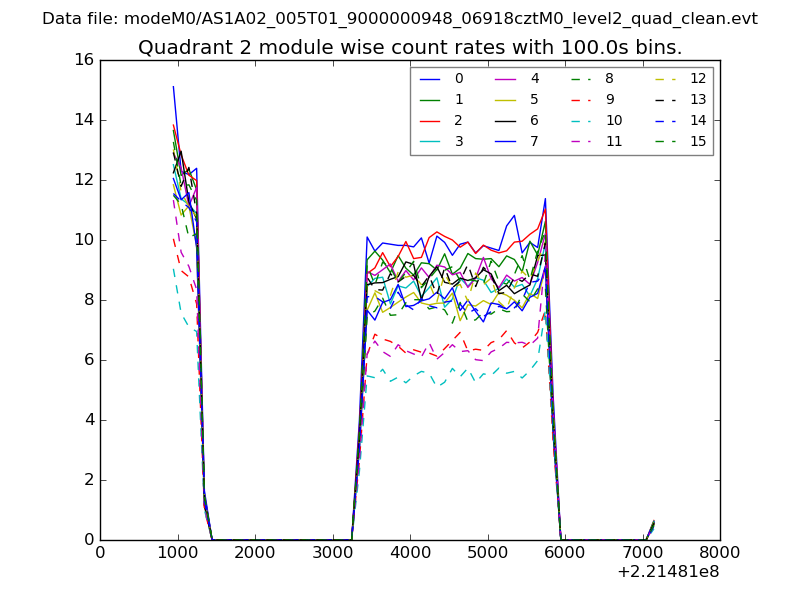
| Module-wise count rates for Quadrant B Data is divided into 100 sec bins |
 |
 |
| Module-wise count rates for Quadrant C Data is divided into 100 sec bins |
 |
 |
| Module-wise count rates for Quadrant D Data is divided into 100 sec bins |
 |
 |
| Parameter | Plot |
|---|---|
| CZT HV Monitor | 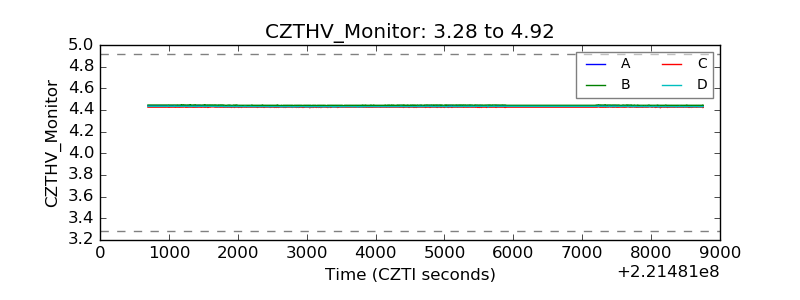 |
| D_VDD | 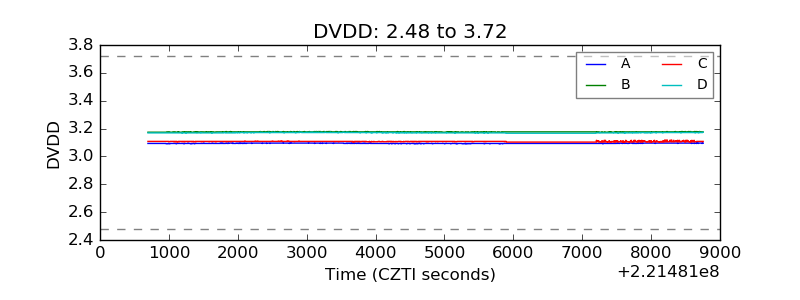 |
| Temperature 1 |  |
| Veto HV Monitor | 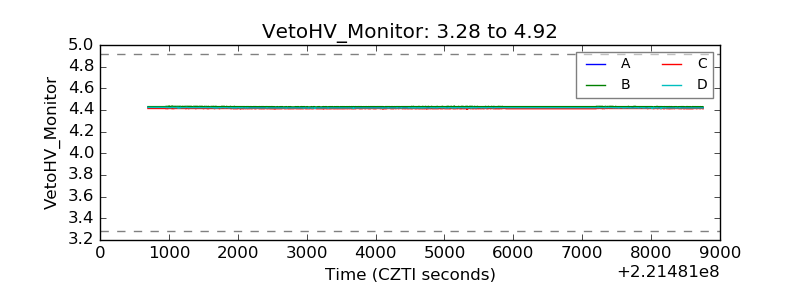 |
| Veto LLD | 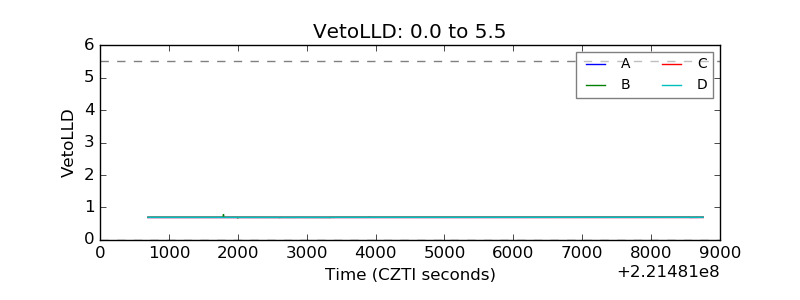 |
| Alpha Counter | 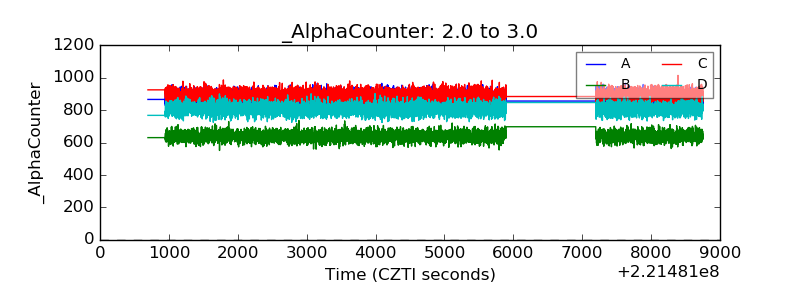 |
| _CPM_Rate | 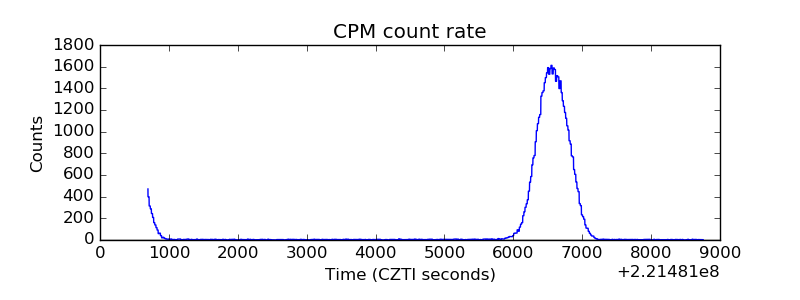 |
| CZT Counter | 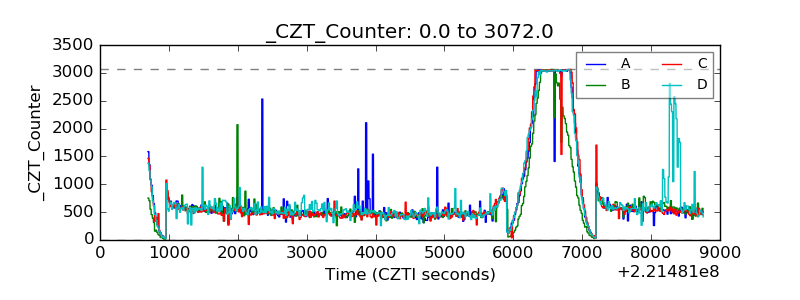 |
| +2.5 Volts monitor |  |
| +5 Volts monitor | 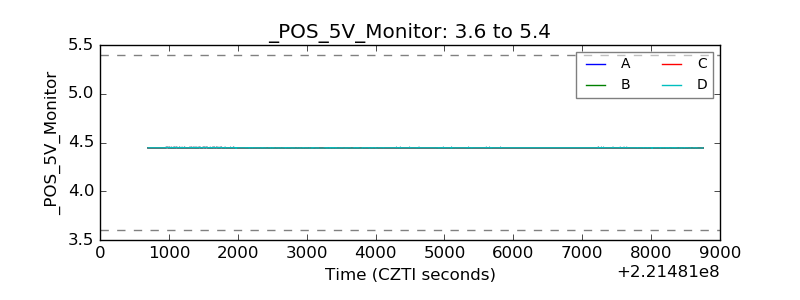 |
| _ROLL_ROT | 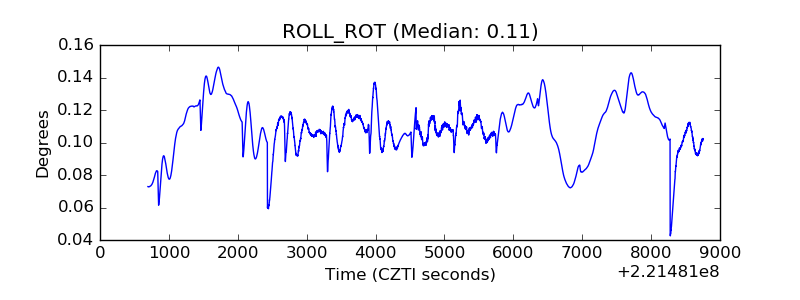 |
| _Roll_DEC | 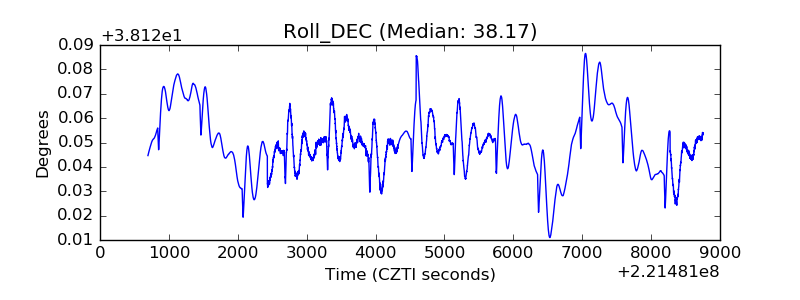 |
| _Roll_RA | 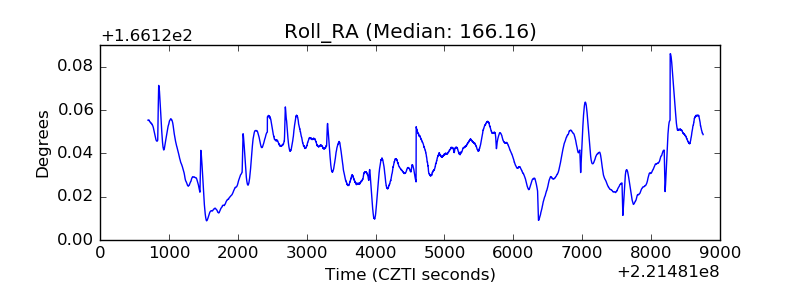 |
| Veto Counter | 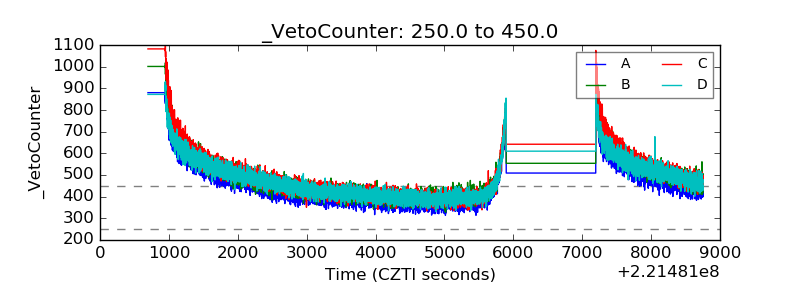 |