| Param | Original file | Final file |
|---|---|---|
| Filename | modeM0/AS1A02_005T01_9000000948_06919cztM0_level2.evt | modeM0/AS1A02_005T01_9000000948_06919cztM0_level2_quad_clean.evt |
| Size (bytes) | 486,875,520 | 65,085,120 |
| Size | 464.3 MB | 62.1 MB |
| Events in quadrant A | 3,239,413 | 384,886 |
| Events in quadrant B | 3,492,472 | 387,016 |
| Events in quadrant C | 3,252,286 | 385,091 |
| Events in quadrant D | 4,326,089 | 366,558 |
| Mode SS | |||
|---|---|---|---|
| Quadrant | BADHDUFLAG | Total packets | Discarded packets |
| A | 0 | 128 | 0 |
| B | 0 | 128 | 0 |
| C | 0 | 128 | 0 |
| D | 0 | 128 | 0 |
| Mode M0 | |||
|---|---|---|---|
| Quadrant | BADHDUFLAG | Total packets | Discarded packets |
| A | 0 | 13647 | 3 |
| B | 0 | 14578 | 2 |
| C | 0 | 13584 | 2 |
| D | 0 | 17197 | 2 |
| Mode M9 | |||
|---|---|---|---|
| Quadrant | BADHDUFLAG | Total packets | Discarded packets |
| A | 0 | 14 | 0 |
| B | 0 | 14 | 0 |
| C | 0 | 14 | 0 |
| D | 0 | 15 | 0 |
| Quadrant | Total seconds | Saturated seconds | Saturation percentage |
|---|---|---|---|
| A | 6412 | 111 | 1.731129% |
| B | 6412 | 110 | 1.715533% |
| C | 6412 | 93 | 1.450405% |
| D | 6412 | 301 | 4.694323% |
Noise dominated data is calculated using 1-second bins in cleaned event files. If a bin has >2000 counts, and if more than 50% of those come from <1% of pixels, then it is considered to be noise-dominated and hence unusable.
| Quadrant | # 1 sec bins | Bins with >0 counts | Bins with >2000 counts | High rate bins dominated by noise | Noise dominated (total time) | Noise dominated (detector-on time) | Marked lightcurve |
|---|---|---|---|---|---|---|---|
| A | 7697 | 6413 | 0 | 0 | 0.00% | 0.00% | 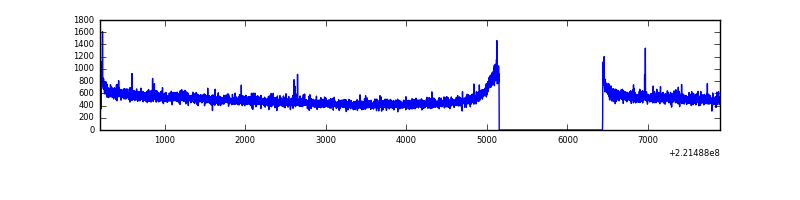 |
| B | 7697 | 6413 | 3 | 3 | 0.04% | 0.05% | 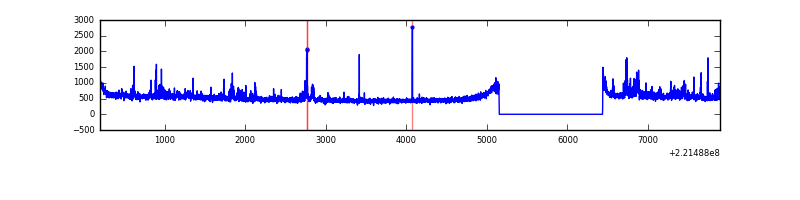 |
| C | 7697 | 6413 | 0 | 0 | 0.00% | 0.00% | 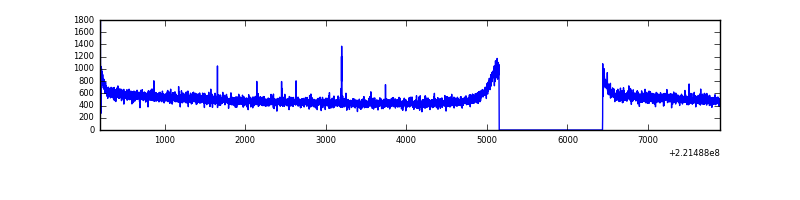 |
| D | 7697 | 6413 | 172 | 172 | 2.23% | 2.68% | 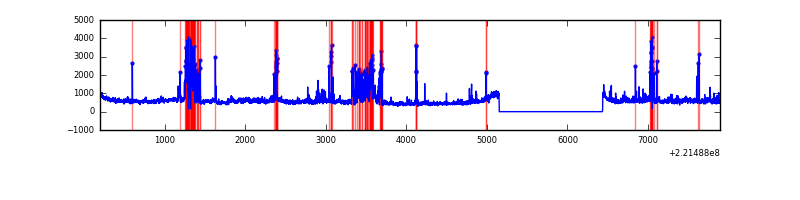 |
Top three noisy pixels from each quadrant. If the there are fewer than three noisy pixels in the level2.evt file, extra rows are filled as -1
| Pixel properties | Quadrant properties | ||||||
|---|---|---|---|---|---|---|---|
| Quadrant | DetID | PixID | Counts | Sigma | Mean | Median | Sigma |
| A | 15 | 223 | 16605 | 93.83 | 833 | 817 | 168.3 |
| A | 0 | 226 | 8089 | 43.22 | 833 | 817 | 168.3 |
| A | 12 | 194 | 7965 | 42.48 | 833 | 817 | 168.3 |
| B | 0 | 228 | 68028 | 431.76 | 833 | 815 | 155.7 |
| B | 4 | 81 | 65028 | 412.49 | 833 | 815 | 155.7 |
| B | 0 | 214 | 48363 | 305.44 | 833 | 815 | 155.7 |
| C | 9 | 247 | 64762 | 344.67 | 810 | 815 | 185.5 |
| C | 1 | 16 | 11416 | 57.14 | 810 | 815 | 185.5 |
| C | 13 | 61 | 6302 | 29.57 | 810 | 815 | 185.5 |
| D | 2 | 14 | 366332 | 1890.49 | 802 | 779 | 193.4 |
| D | 1 | 20 | 361505 | 1865.53 | 802 | 779 | 193.4 |
| D | 2 | 33 | 340629 | 1757.57 | 802 | 779 | 193.4 |
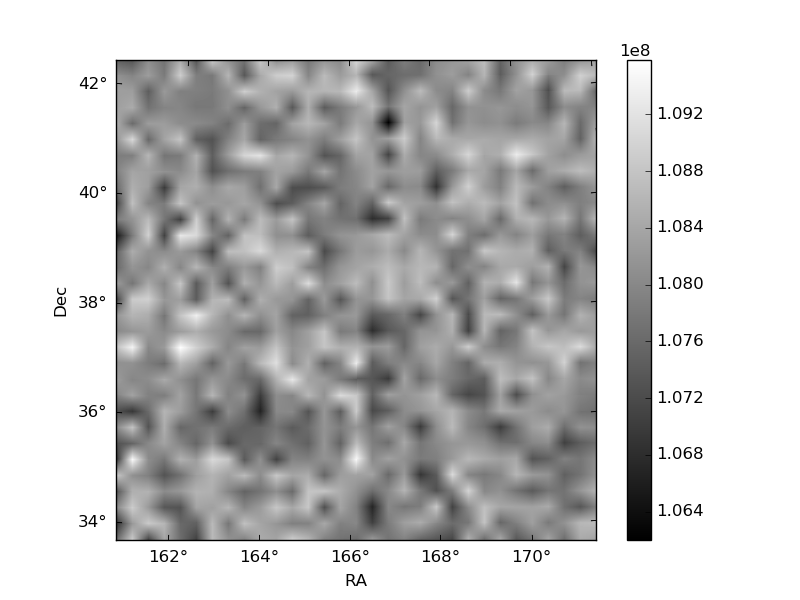
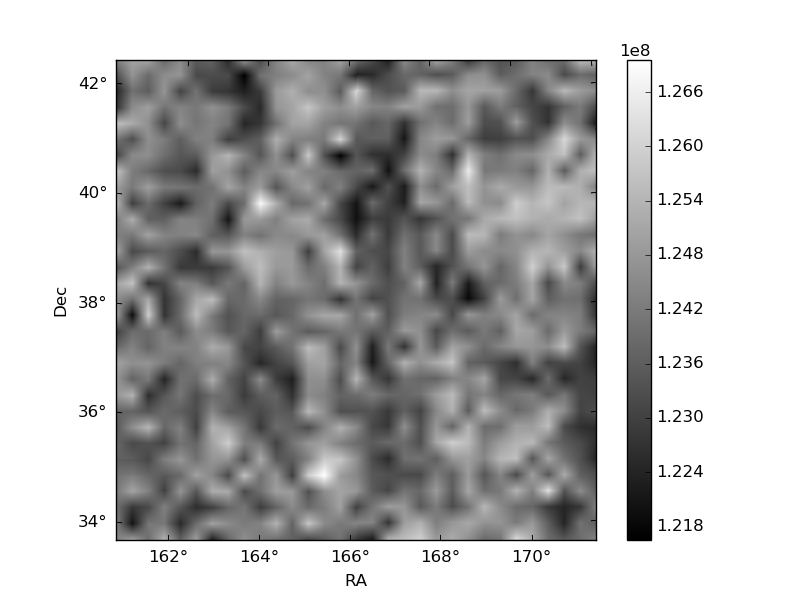
Histogram calculated using DETX and DETY for each event in the final _common_clean file
| Quadrant A | 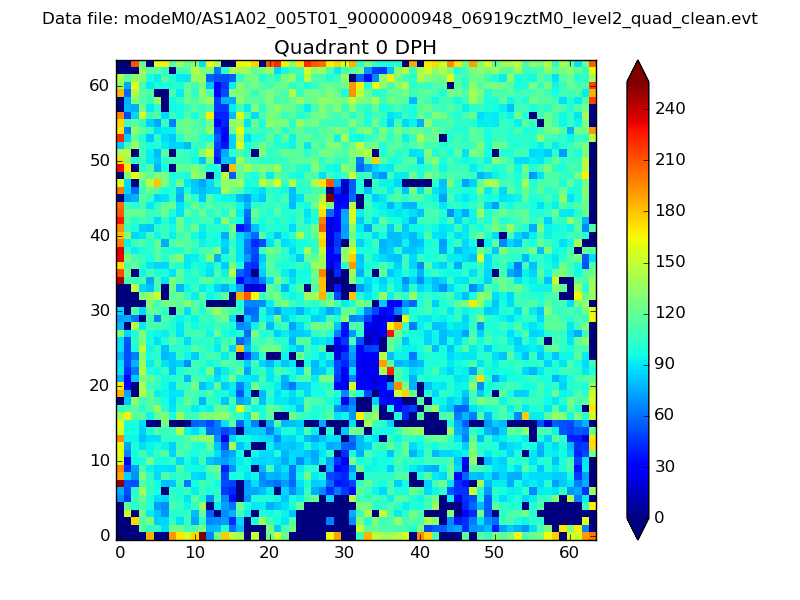 |
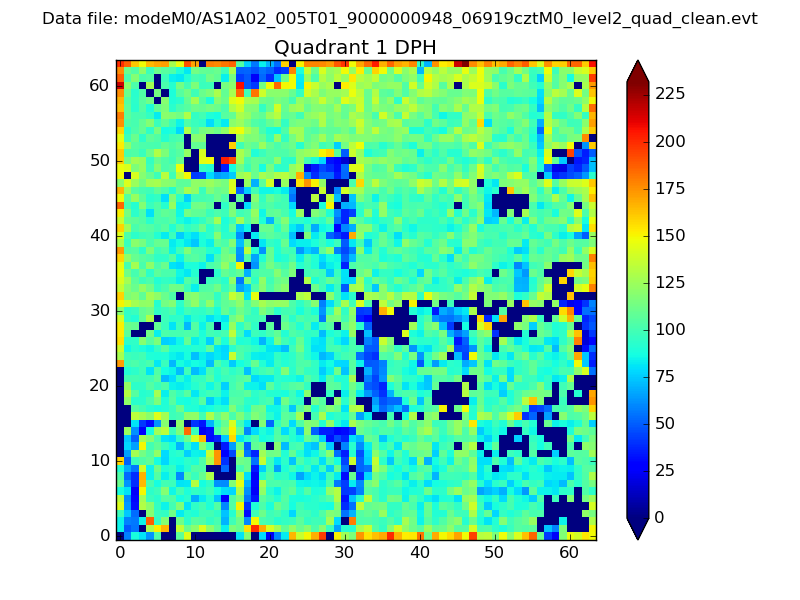 |
Quadrant B |
|---|---|---|---|
| Quadrant D | 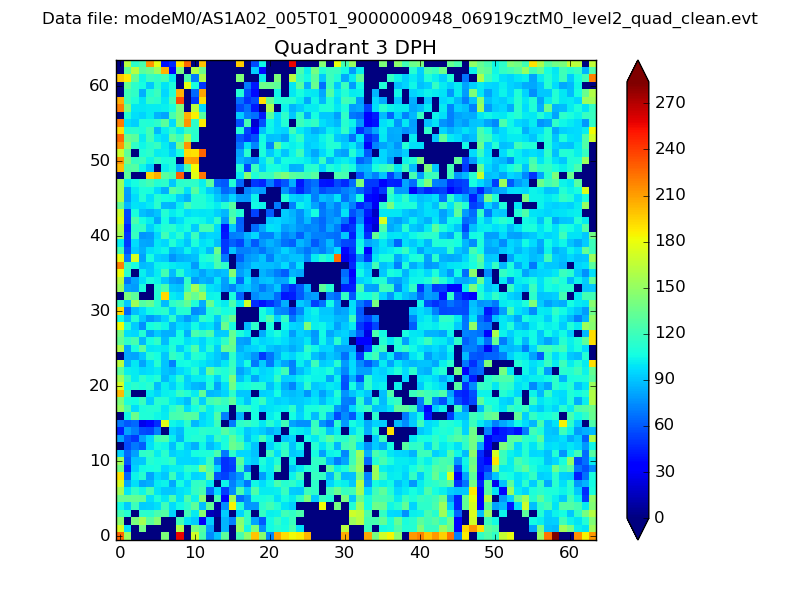 |
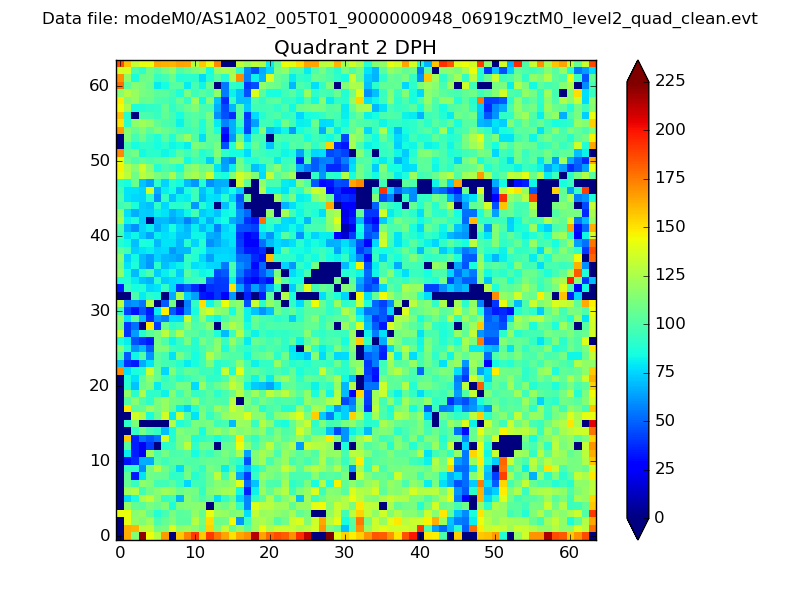 |
Quadrant C |
| Plot type | Count rate plots | Images |
|---|---|---|
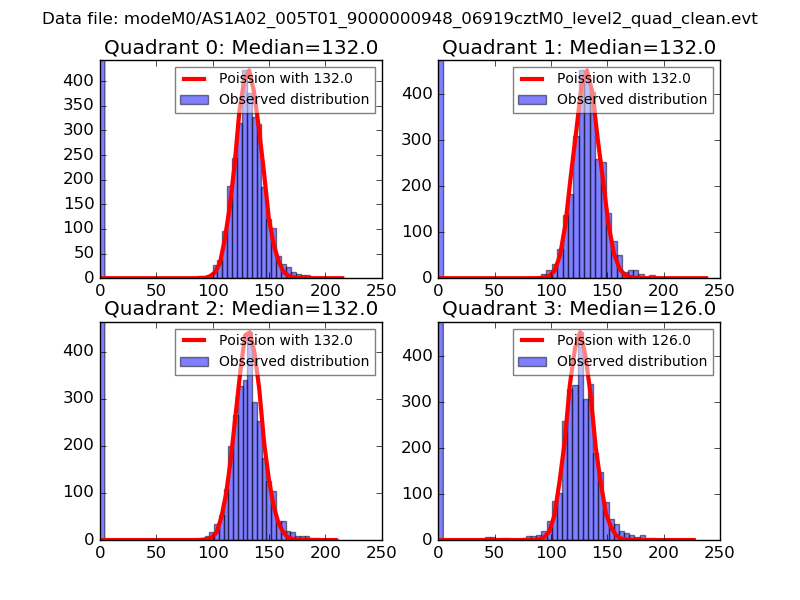
| Comparison with Poisson distribution Blue bars denote a histogram of data divided into 1 sec bins. Red curve is a Poisson curve with rate = median count rate of data. |
 |
 |
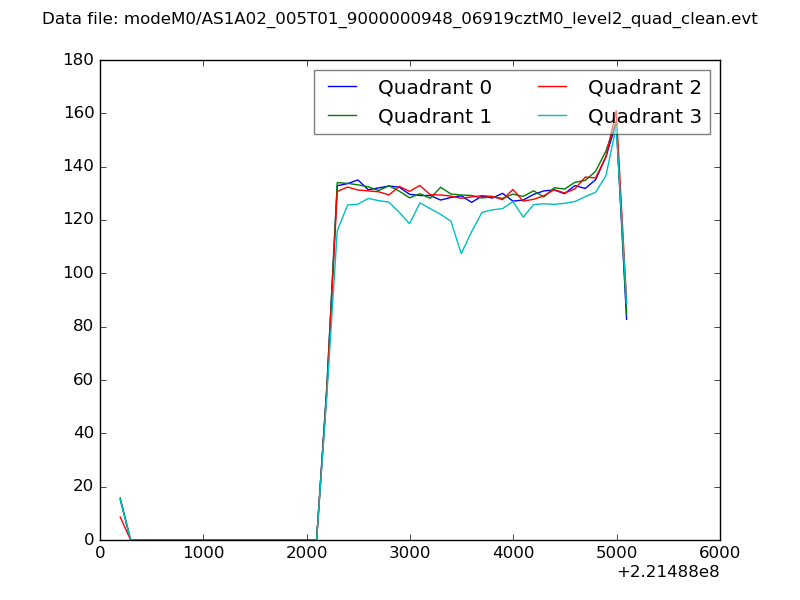
| Quadrant-wise count rates Data is divided into 100 sec bins |
 |
|
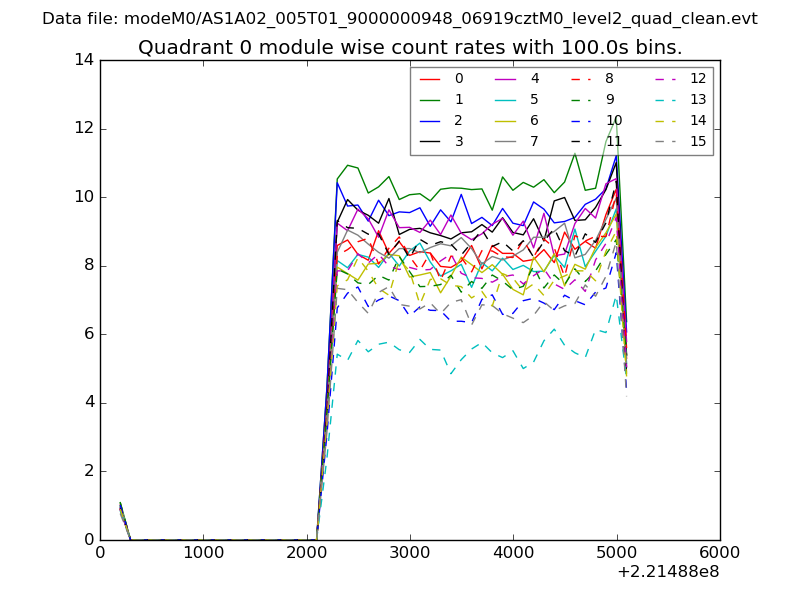
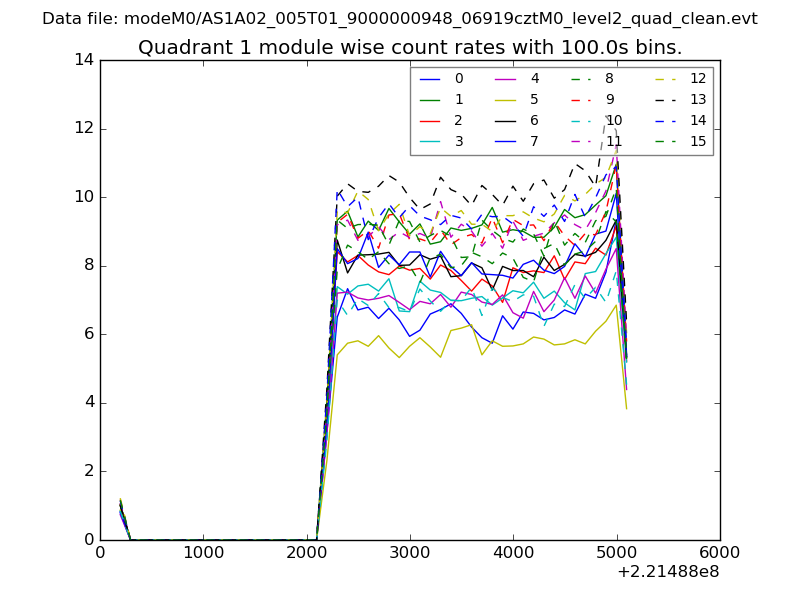
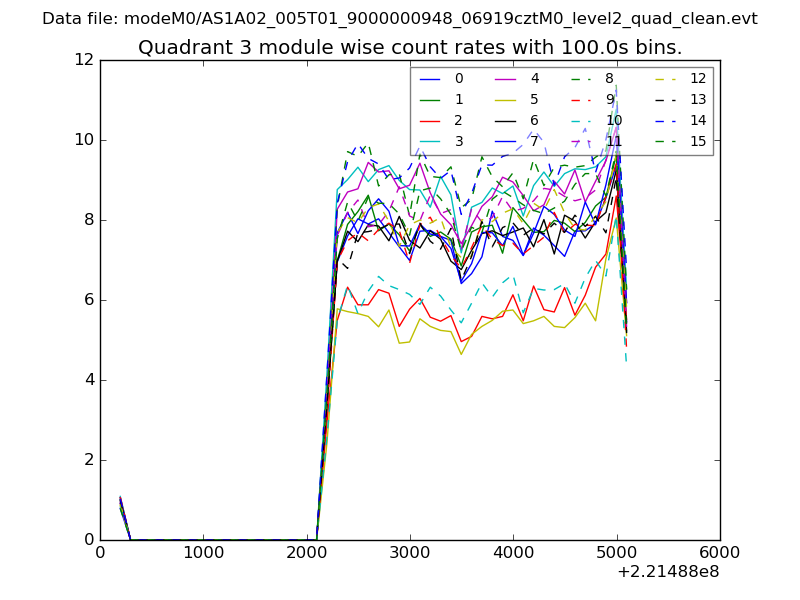
| Module-wise count rates for Quadrant A Data is divided into 100 sec bins |
 |
 |
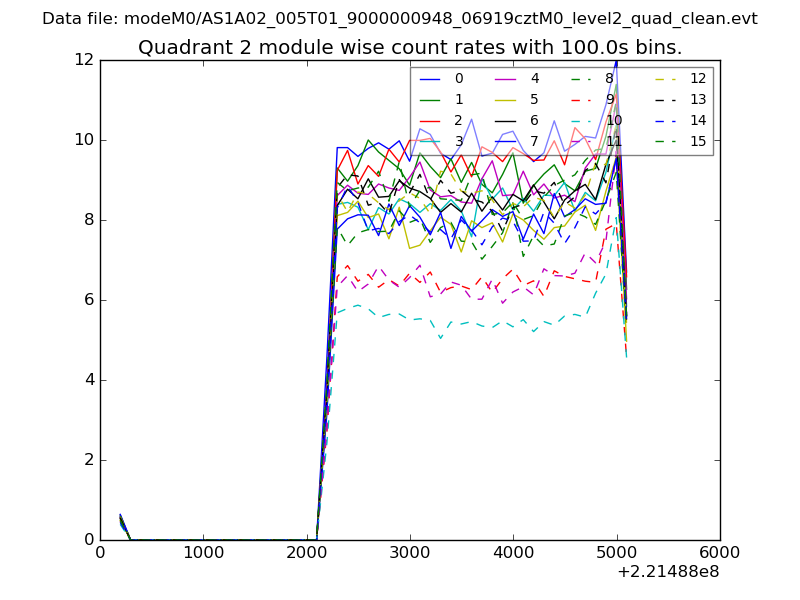
| Module-wise count rates for Quadrant B Data is divided into 100 sec bins |
 |
 |
| Module-wise count rates for Quadrant C Data is divided into 100 sec bins |
 |
 |
| Module-wise count rates for Quadrant D Data is divided into 100 sec bins |
 |
 |
| Parameter | Plot |
|---|---|
| CZT HV Monitor | 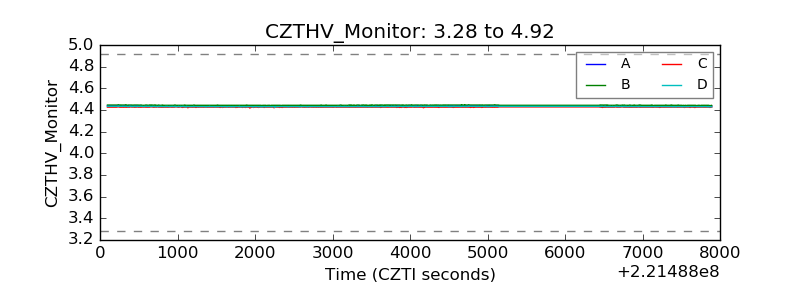 |
| D_VDD | 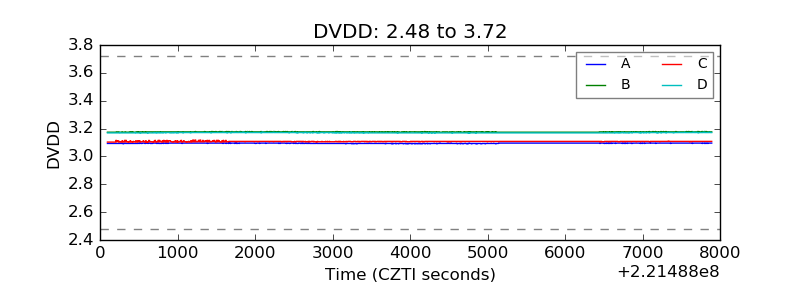 |
| Temperature 1 | 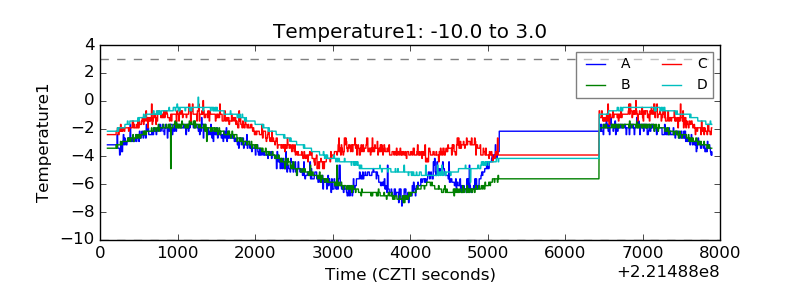 |
| Veto HV Monitor | 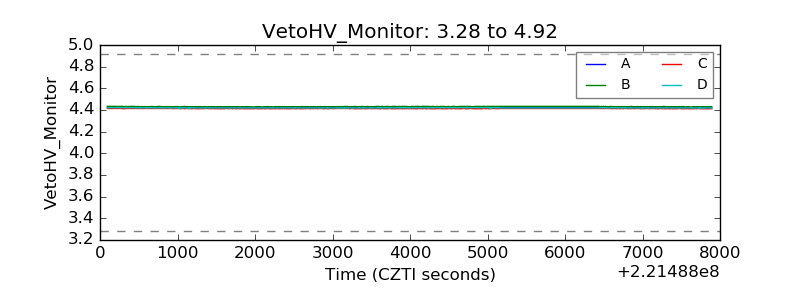 |
| Veto LLD | 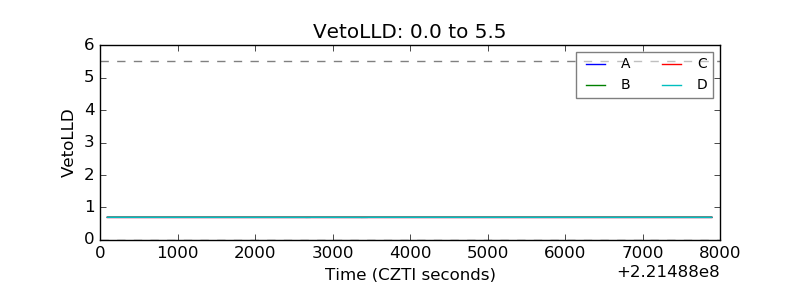 |
| Alpha Counter | 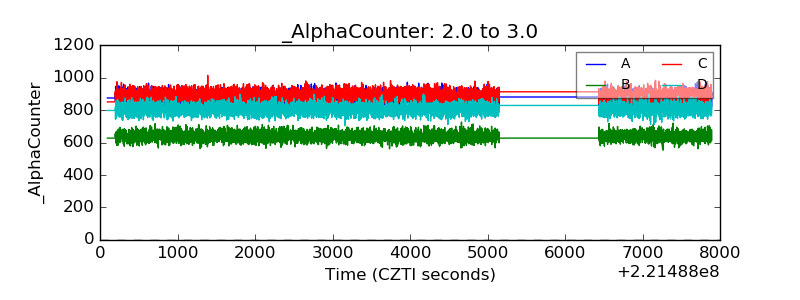 |
| _CPM_Rate | 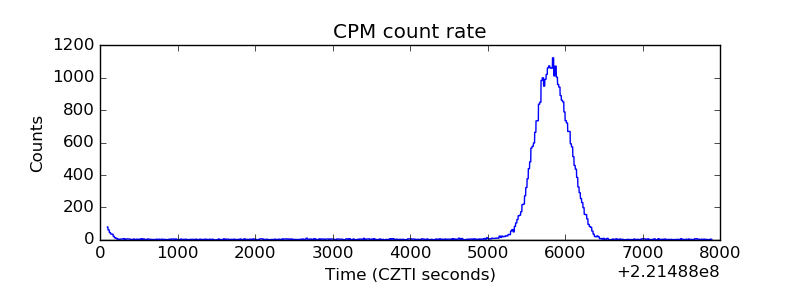 |
| CZT Counter | 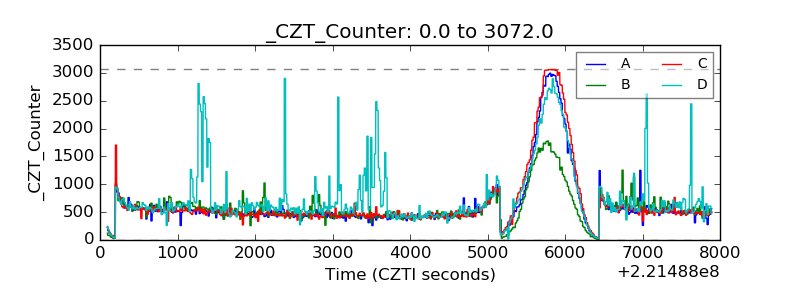 |
| +2.5 Volts monitor |  |
| +5 Volts monitor | 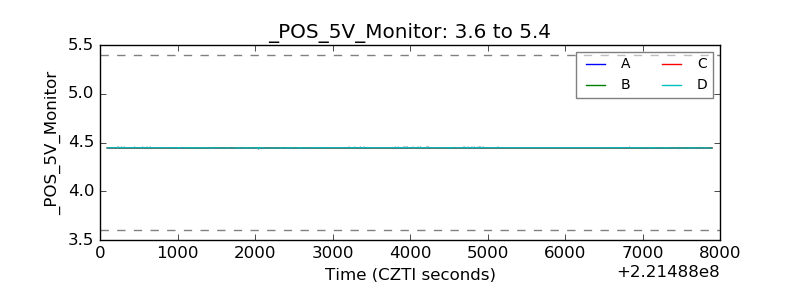 |
| _ROLL_ROT | 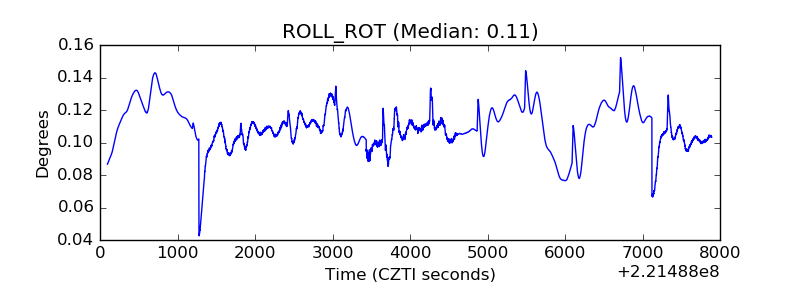 |
| _Roll_DEC | 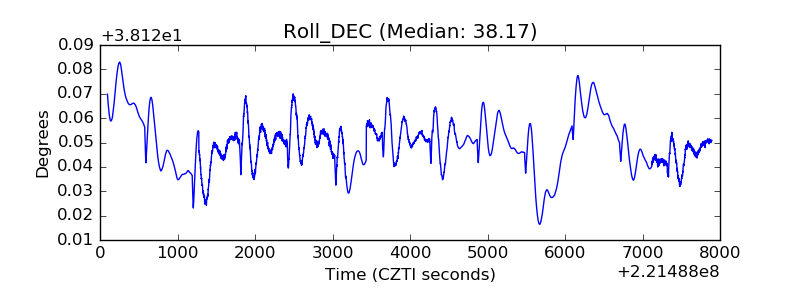 |
| _Roll_RA | 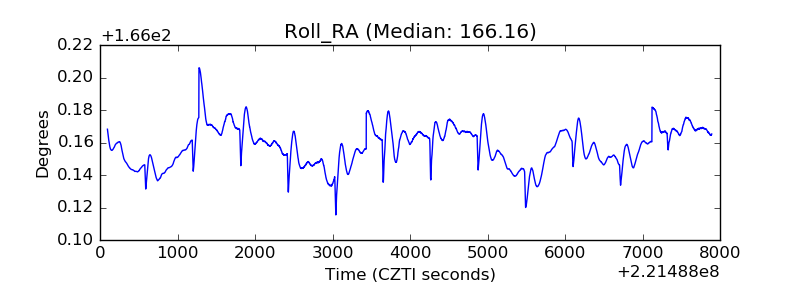 |
| Veto Counter | 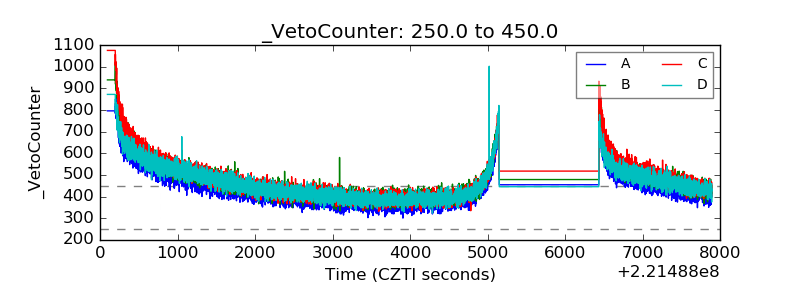 |