| Param | Original file | Final file |
|---|---|---|
| Filename | modeM0/AS1A02_005T01_9000000948_06921cztM0_level2.evt | modeM0/AS1A02_005T01_9000000948_06921cztM0_level2_quad_clean.evt |
| Size (bytes) | 462,703,680 | 85,245,120 |
| Size | 441.3 MB | 81.3 MB |
| Events in quadrant A | 3,256,828 | 528,725 |
| Events in quadrant B | 3,448,456 | 532,157 |
| Events in quadrant C | 3,215,047 | 531,355 |
| Events in quadrant D | 3,628,800 | 513,570 |
| Mode SS | |||
|---|---|---|---|
| Quadrant | BADHDUFLAG | Total packets | Discarded packets |
| A | 0 | 142 | 0 |
| B | 0 | 142 | 0 |
| C | 0 | 142 | 0 |
| D | 0 | 142 | 0 |
| Mode M0 | |||
|---|---|---|---|
| Quadrant | BADHDUFLAG | Total packets | Discarded packets |
| A | 0 | 14338 | 3 |
| B | 0 | 14814 | 2 |
| C | 0 | 14132 | 2 |
| D | 0 | 15416 | 2 |
| Mode M9 | |||
|---|---|---|---|
| Quadrant | BADHDUFLAG | Total packets | Discarded packets |
| A | 0 | 20 | 0 |
| B | 0 | 20 | 0 |
| C | 0 | 20 | 0 |
| D | 0 | 20 | 0 |
| Quadrant | Total seconds | Saturated seconds | Saturation percentage |
|---|---|---|---|
| A | 6820 | 107 | 1.568915% |
| B | 6820 | 143 | 2.096774% |
| C | 6820 | 97 | 1.422287% |
| D | 6820 | 159 | 2.331378% |
Noise dominated data is calculated using 1-second bins in cleaned event files. If a bin has >2000 counts, and if more than 50% of those come from <1% of pixels, then it is considered to be noise-dominated and hence unusable.
| Quadrant | # 1 sec bins | Bins with >0 counts | Bins with >2000 counts | High rate bins dominated by noise | Noise dominated (total time) | Noise dominated (detector-on time) | Marked lightcurve |
|---|---|---|---|---|---|---|---|
| A | 8840 | 6822 | 4 | 4 | 0.05% | 0.06% | 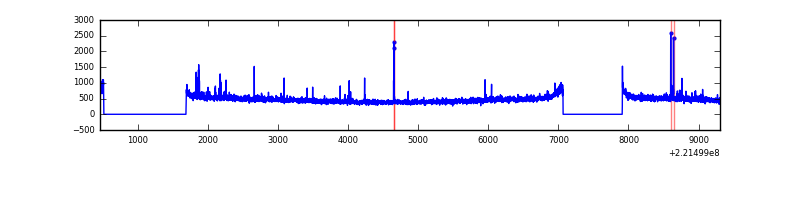 |
| B | 8840 | 6822 | 13 | 13 | 0.15% | 0.19% | 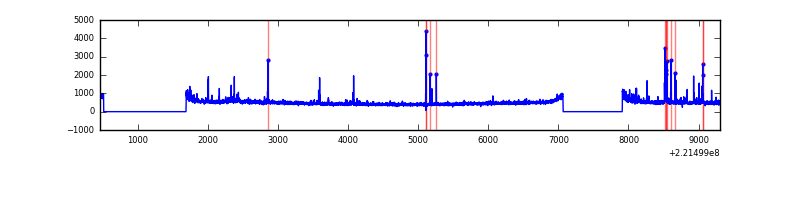 |
| C | 8840 | 6822 | 0 | 0 | 0.00% | 0.00% | 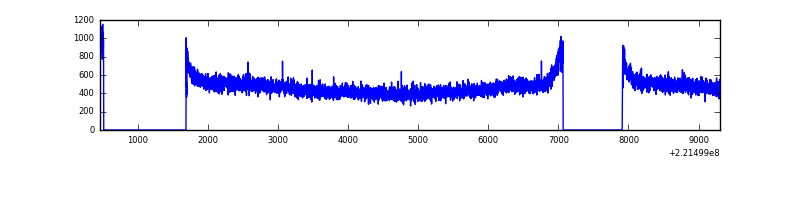 |
| D | 8840 | 6822 | 43 | 43 | 0.49% | 0.63% | 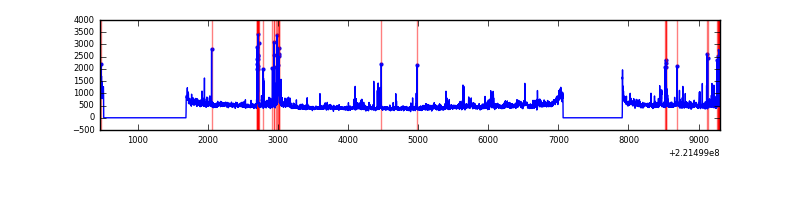 |
Top three noisy pixels from each quadrant. If the there are fewer than three noisy pixels in the level2.evt file, extra rows are filled as -1
| Pixel properties | Quadrant properties | ||||||
|---|---|---|---|---|---|---|---|
| Quadrant | DetID | PixID | Counts | Sigma | Mean | Median | Sigma |
| A | 8 | 15 | 66630 | 391.37 | 820 | 803 | 168.2 |
| A | 15 | 223 | 17749 | 100.75 | 820 | 803 | 168.2 |
| A | 0 | 226 | 8035 | 43.0 | 820 | 803 | 168.2 |
| B | 4 | 81 | 89451 | 563.38 | 823 | 804 | 157.3 |
| B | 4 | 173 | 46013 | 287.32 | 823 | 804 | 157.3 |
| B | 4 | 48 | 29052 | 179.52 | 823 | 804 | 157.3 |
| C | 9 | 247 | 71930 | 387.29 | 799 | 804 | 183.7 |
| C | 1 | 16 | 15021 | 77.41 | 799 | 804 | 183.7 |
| C | 13 | 61 | 6445 | 30.72 | 799 | 804 | 183.7 |
| D | 1 | 20 | 253534 | 1282.56 | 801 | 774 | 197.1 |
| D | 2 | 14 | 114805 | 578.62 | 801 | 774 | 197.1 |
| D | 2 | 136 | 73098 | 366.99 | 801 | 774 | 197.1 |
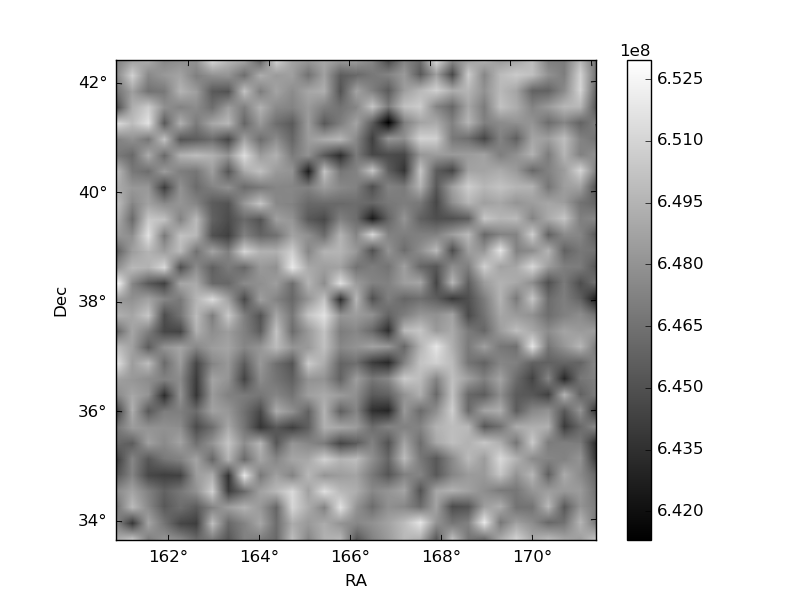
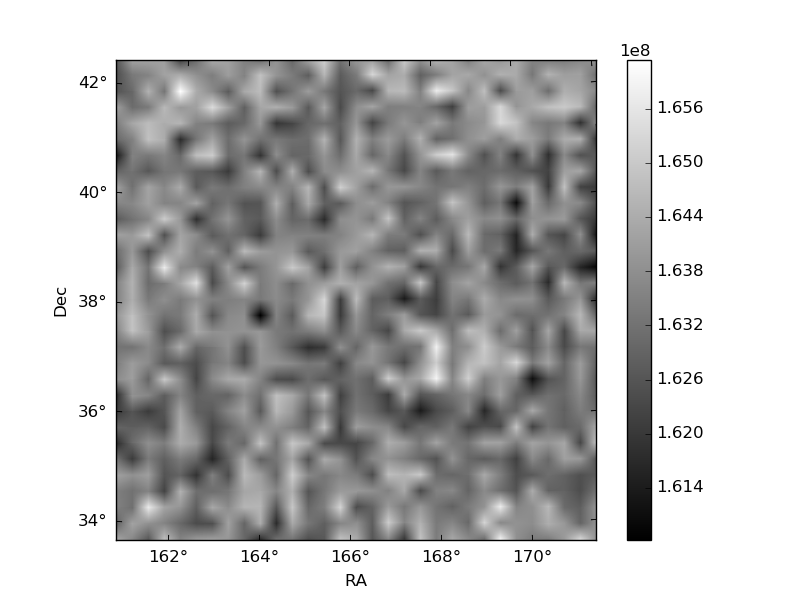
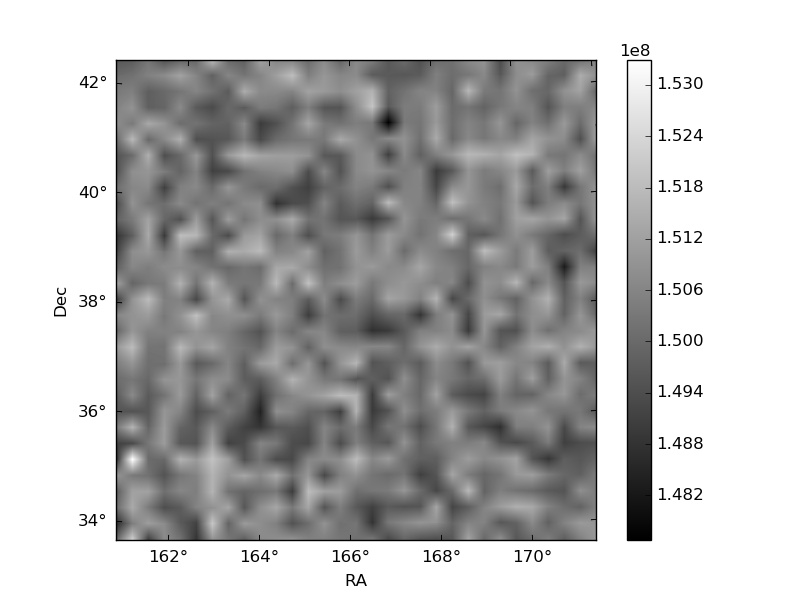
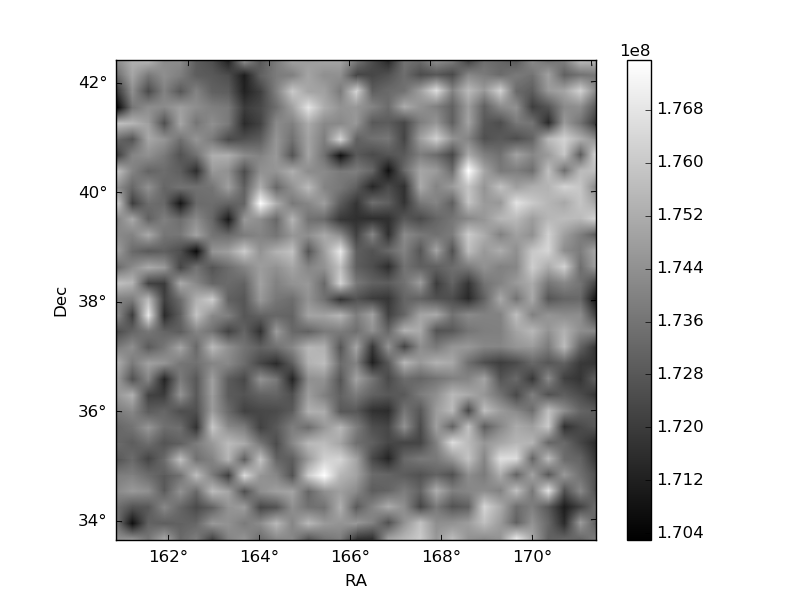
Histogram calculated using DETX and DETY for each event in the final _common_clean file
| Quadrant A | 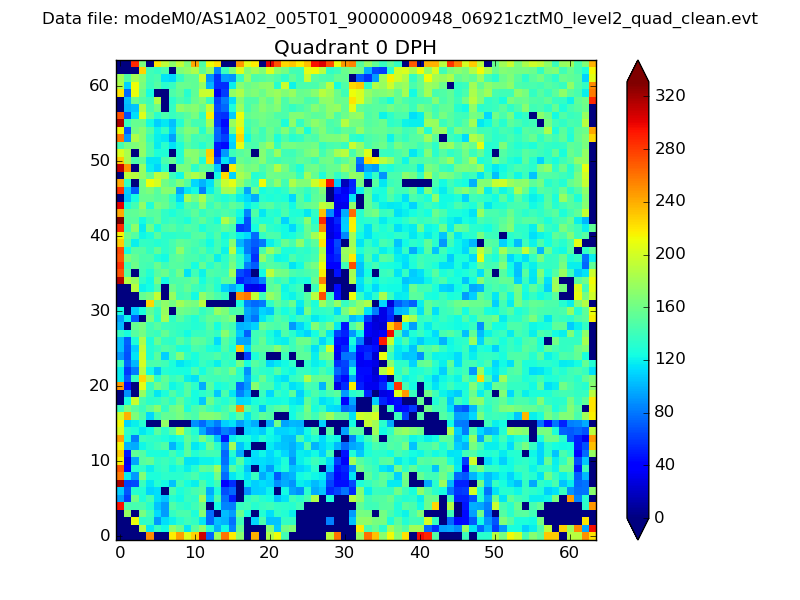 |
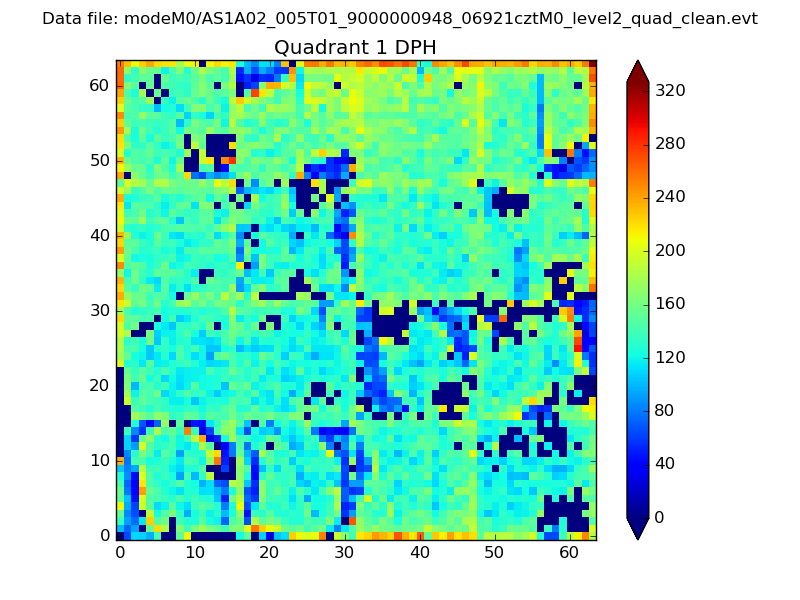 |
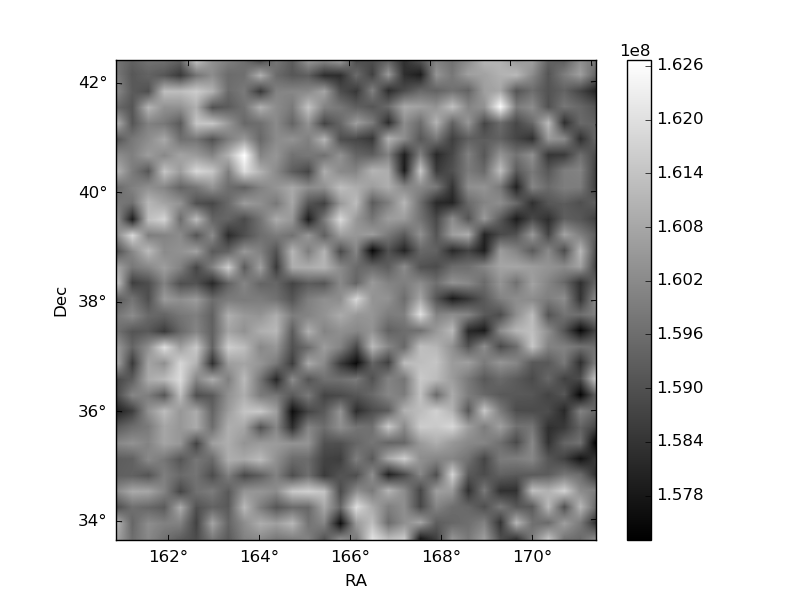
Quadrant B |
|---|---|---|---|
| Quadrant D | 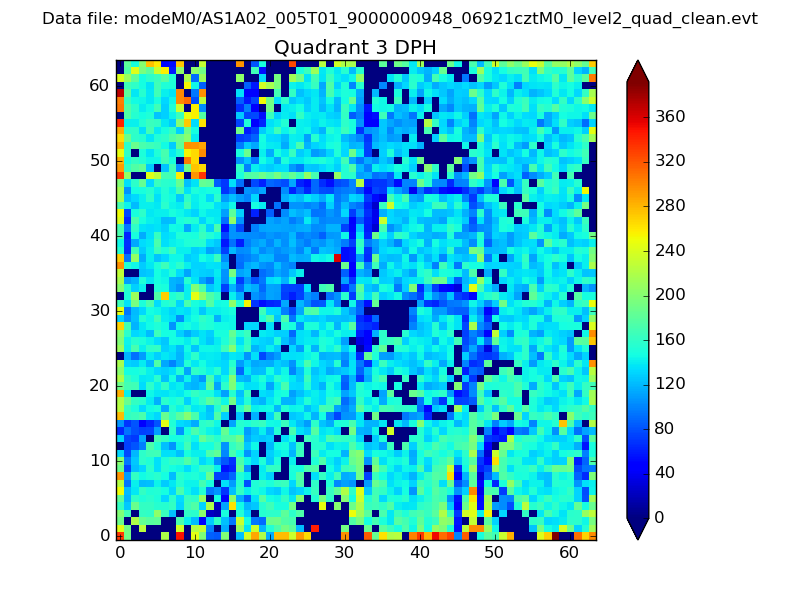 |
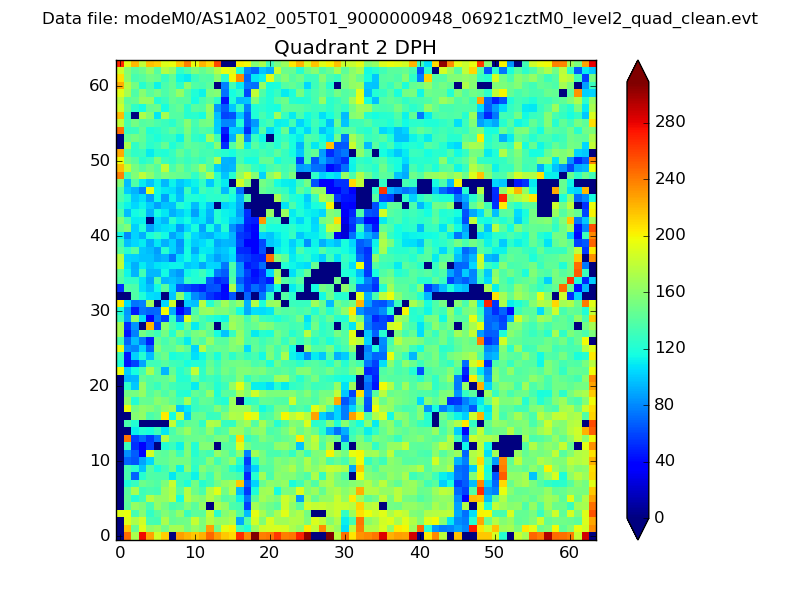 |
Quadrant C |
| Plot type | Count rate plots | Images |
|---|---|---|
| Comparison with Poisson distribution Blue bars denote a histogram of data divided into 1 sec bins. Red curve is a Poisson curve with rate = median count rate of data. |
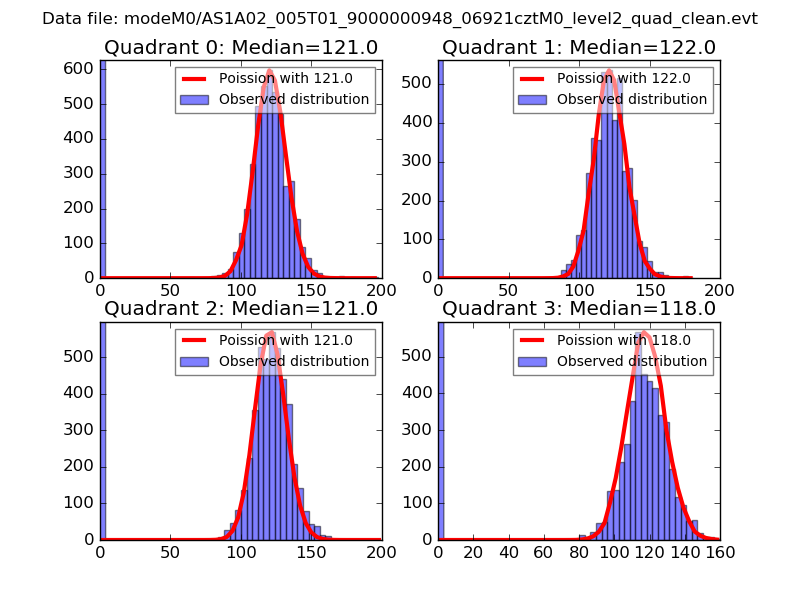 |
 |
| Quadrant-wise count rates Data is divided into 100 sec bins |
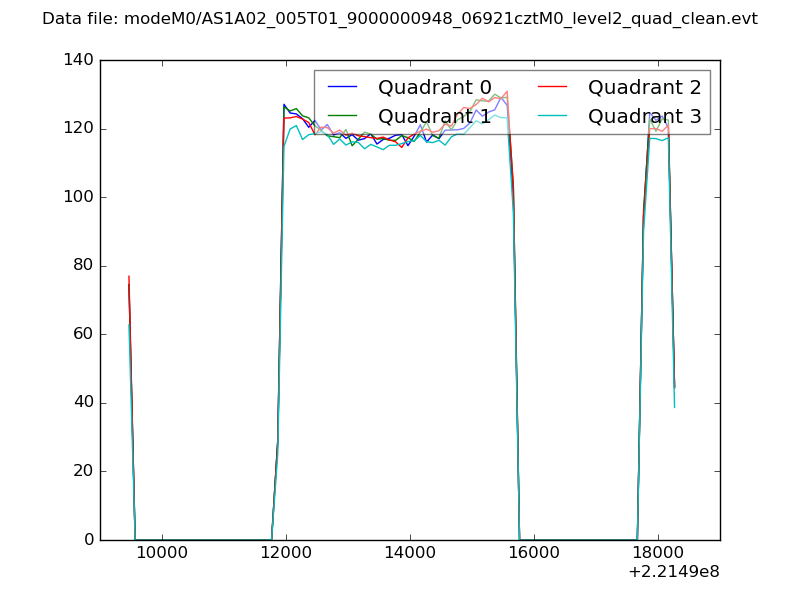 |
|
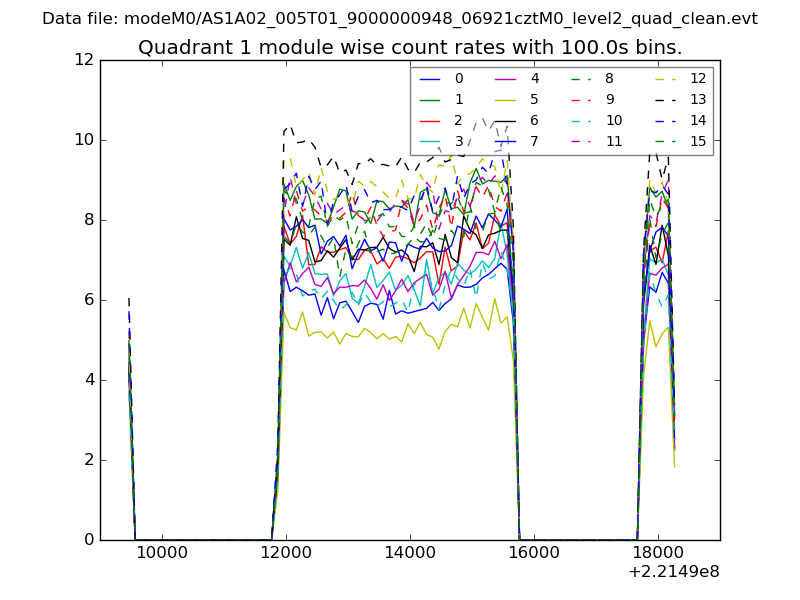
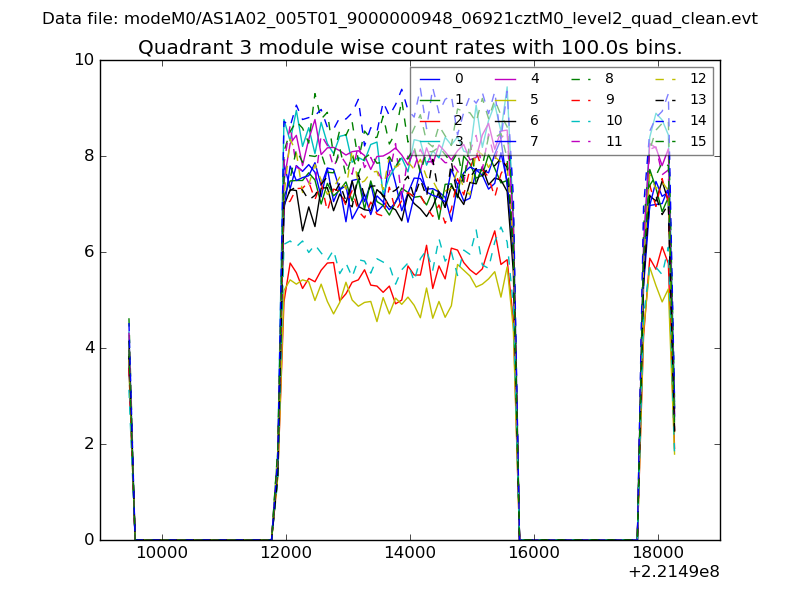
| Module-wise count rates for Quadrant A Data is divided into 100 sec bins |
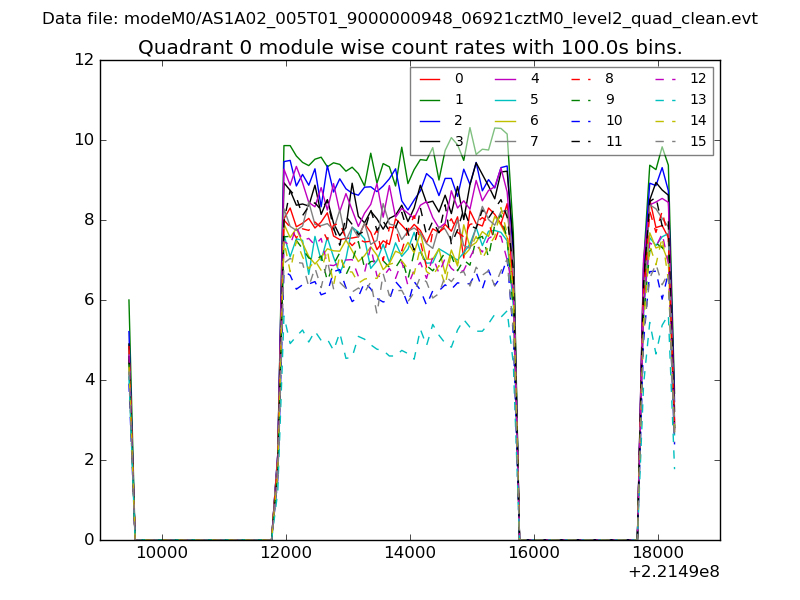 |
 |
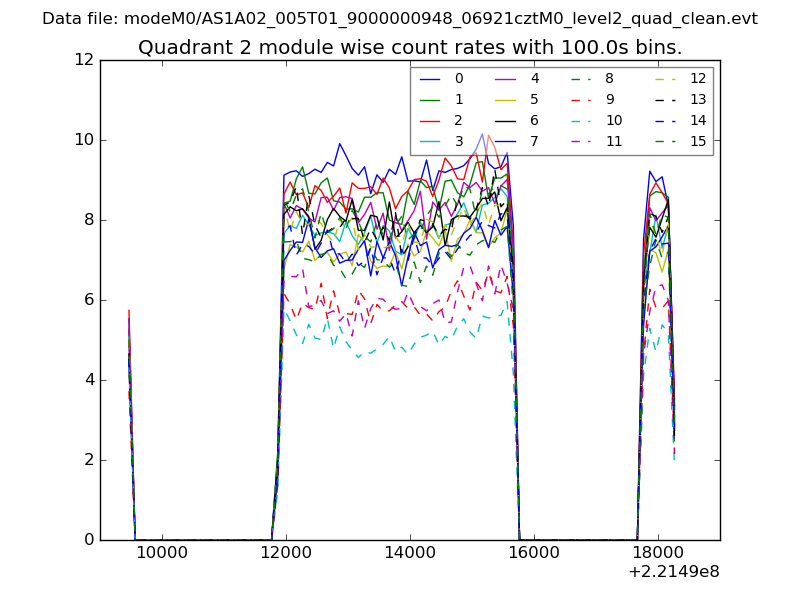
| Module-wise count rates for Quadrant B Data is divided into 100 sec bins |
 |
 |
| Module-wise count rates for Quadrant C Data is divided into 100 sec bins |
 |
 |
| Module-wise count rates for Quadrant D Data is divided into 100 sec bins |
 |
 |
| Parameter | Plot |
|---|---|
| CZT HV Monitor | 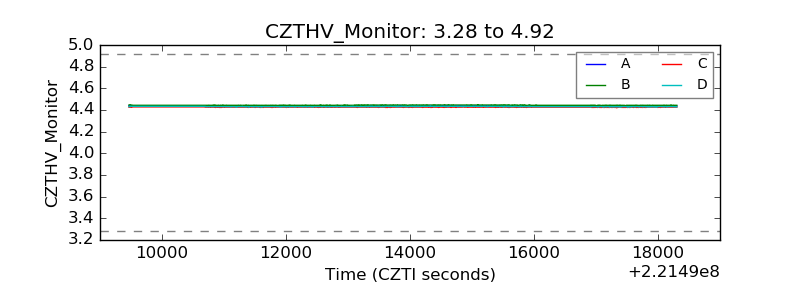 |
| D_VDD | 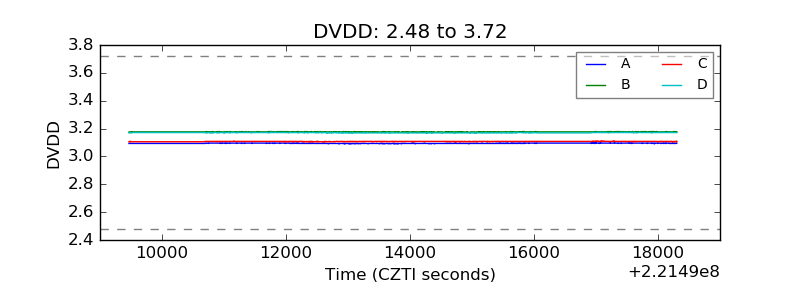 |
| Temperature 1 | 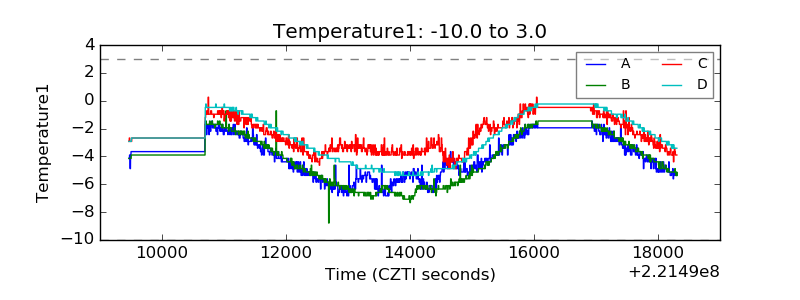 |
| Veto HV Monitor | 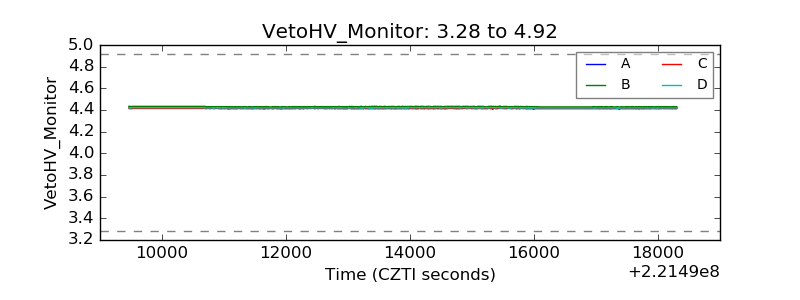 |
| Veto LLD | 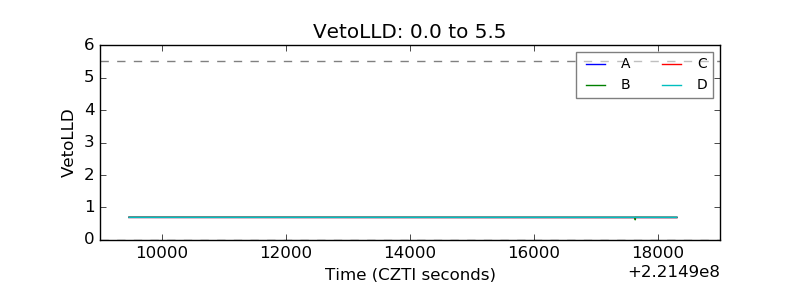 |
| Alpha Counter | 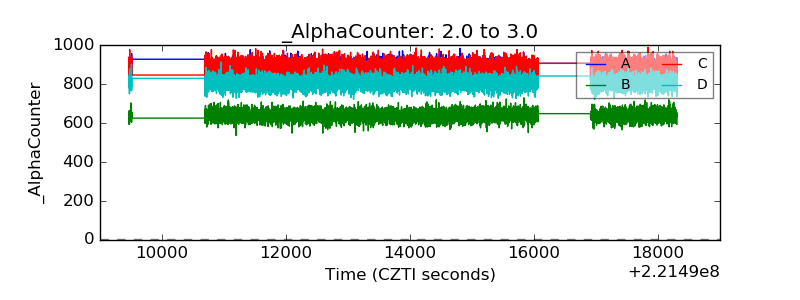 |
| _CPM_Rate | 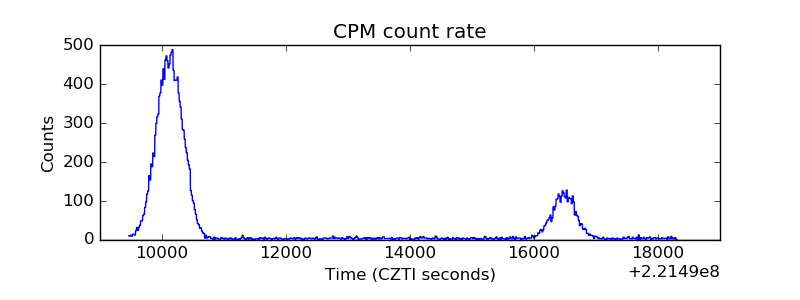 |
| CZT Counter | 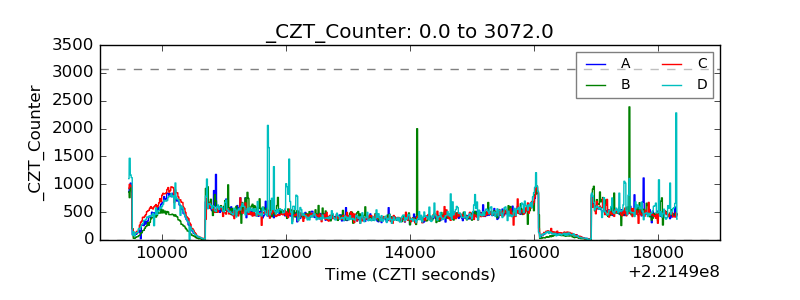 |
| +2.5 Volts monitor | 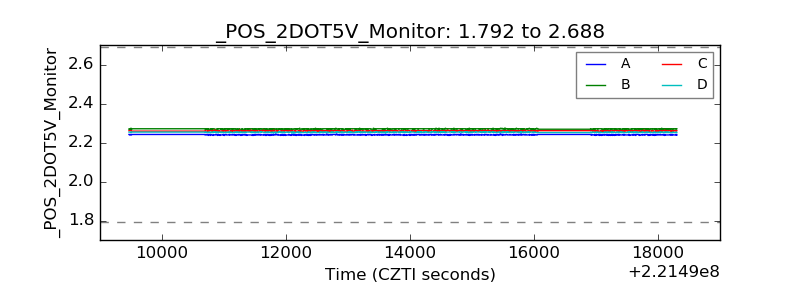 |
| +5 Volts monitor |  |
| _ROLL_ROT | 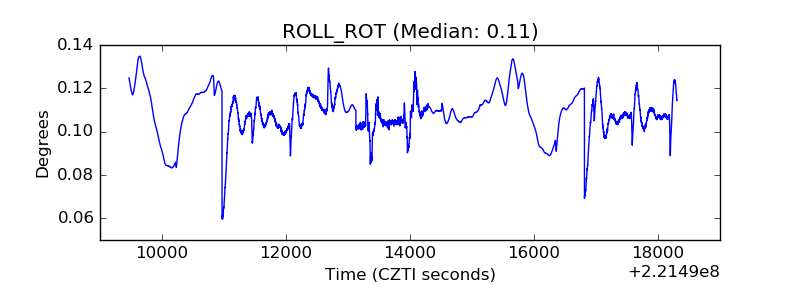 |
| _Roll_DEC | 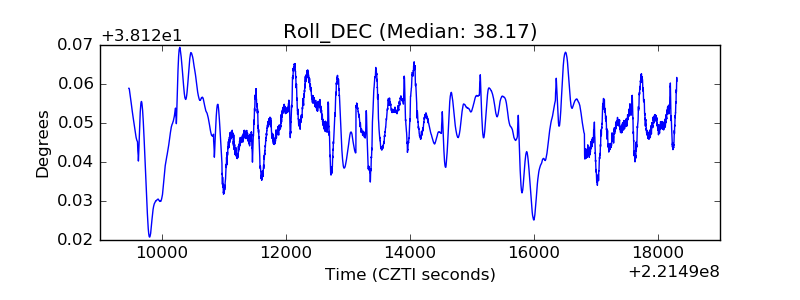 |
| _Roll_RA | 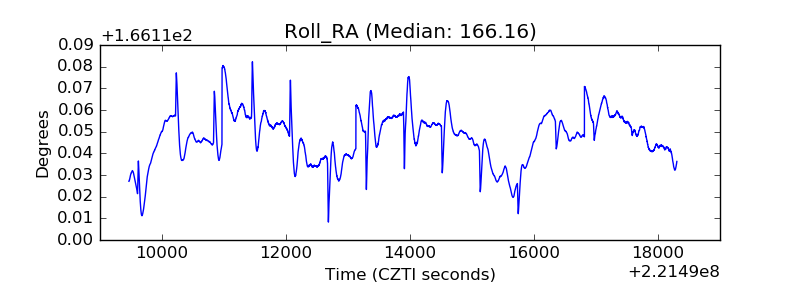 |
| Veto Counter | 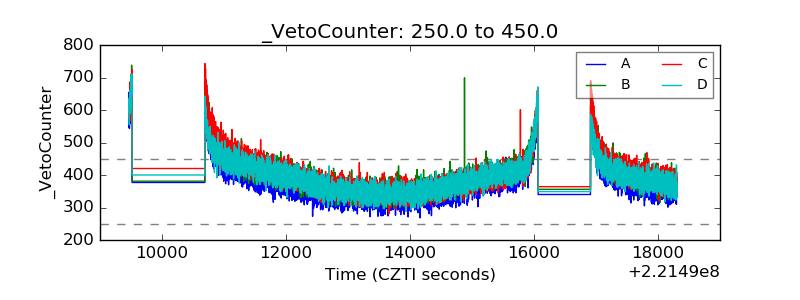 |