| Param | Original file | Final file |
|---|---|---|
| Filename | modeM0/AS1A02_005T01_9000000948_06928cztM0_level2.evt | modeM0/AS1A02_005T01_9000000948_06928cztM0_level2_quad_clean.evt |
| Size (bytes) | 481,838,400 | 77,474,880 |
| Size | 459.5 MB | 73.9 MB |
| Events in quadrant A | 2,722,806 | 494,962 |
| Events in quadrant B | 3,359,969 | 500,882 |
| Events in quadrant C | 4,589,689 | 453,042 |
| Events in quadrant D | 3,505,727 | 470,905 |
| Mode SS | |||
|---|---|---|---|
| Quadrant | BADHDUFLAG | Total packets | Discarded packets |
| A | 0 | 124 | 0 |
| B | 0 | 124 | 0 |
| C | 0 | 124 | 0 |
| D | 0 | 124 | 0 |
| Mode M0 | |||
|---|---|---|---|
| Quadrant | BADHDUFLAG | Total packets | Discarded packets |
| A | 0 | 12350 | 2 |
| B | 0 | 14085 | 1 |
| C | 0 | 17973 | 1 |
| D | 0 | 14558 | 1 |
| Mode M9 | |||
|---|---|---|---|
| Quadrant | BADHDUFLAG | Total packets | Discarded packets |
| A | 0 | 10 | 0 |
| B | 0 | 10 | 0 |
| C | 0 | 10 | 0 |
| D | 0 | 10 | 0 |
| Quadrant | Total seconds | Saturated seconds | Saturation percentage |
|---|---|---|---|
| A | 6098 | 50 | 0.819941% |
| B | 6098 | 81 | 1.328304% |
| C | 6098 | 690 | 11.315185% |
| D | 6098 | 176 | 2.886192% |
Noise dominated data is calculated using 1-second bins in cleaned event files. If a bin has >2000 counts, and if more than 50% of those come from <1% of pixels, then it is considered to be noise-dominated and hence unusable.
| Quadrant | # 1 sec bins | Bins with >0 counts | Bins with >2000 counts | High rate bins dominated by noise | Noise dominated (total time) | Noise dominated (detector-on time) | Marked lightcurve |
|---|---|---|---|---|---|---|---|
| A | 7063 | 6099 | 0 | 0 | 0.00% | 0.00% |  |
| B | 7063 | 6099 | 14 | 14 | 0.20% | 0.23% | 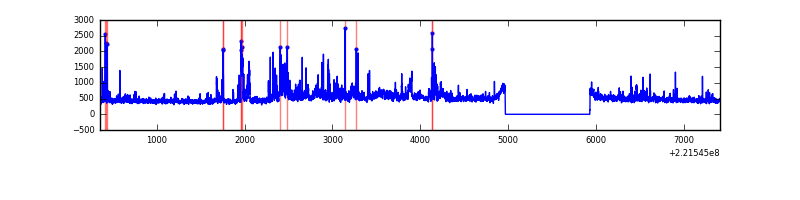 |
| C | 7063 | 6099 | 612 | 612 | 8.66% | 10.03% | 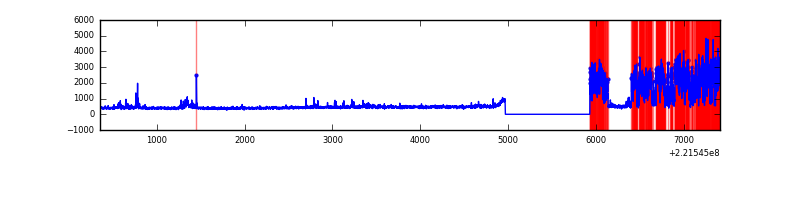 |
| D | 7063 | 6099 | 118 | 118 | 1.67% | 1.93% | 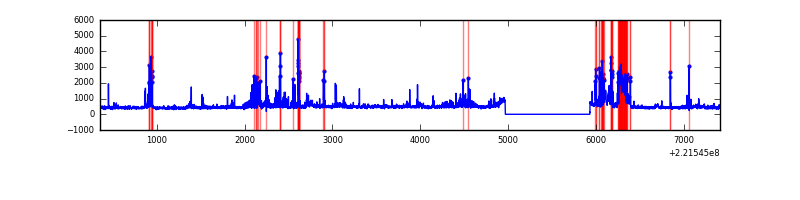 |
Top three noisy pixels from each quadrant. If the there are fewer than three noisy pixels in the level2.evt file, extra rows are filled as -1
| Pixel properties | Quadrant properties | ||||||
|---|---|---|---|---|---|---|---|
| Quadrant | DetID | PixID | Counts | Sigma | Mean | Median | Sigma |
| A | 0 | 226 | 6829 | 42.39 | 704 | 689 | 144.8 |
| A | 12 | 194 | 6593 | 40.76 | 704 | 689 | 144.8 |
| A | 0 | 128 | 5897 | 35.95 | 704 | 689 | 144.8 |
| B | 0 | 228 | 431735 | 3173.35 | 704 | 686 | 135.8 |
| B | 4 | 48 | 81473 | 594.75 | 704 | 686 | 135.8 |
| B | 4 | 81 | 34412 | 248.29 | 704 | 686 | 135.8 |
| C | 9 | 247 | 2058298 | 13673.0 | 646 | 649 | 150.5 |
| C | 12 | 4 | 5765 | 34.0 | 646 | 649 | 150.5 |
| C | 13 | 61 | 5169 | 30.04 | 646 | 649 | 150.5 |
| D | 5 | 239 | 313721 | 1886.62 | 677 | 656 | 165.9 |
| D | 2 | 136 | 268411 | 1613.57 | 677 | 656 | 165.9 |
| D | 8 | 195 | 134684 | 807.69 | 677 | 656 | 165.9 |
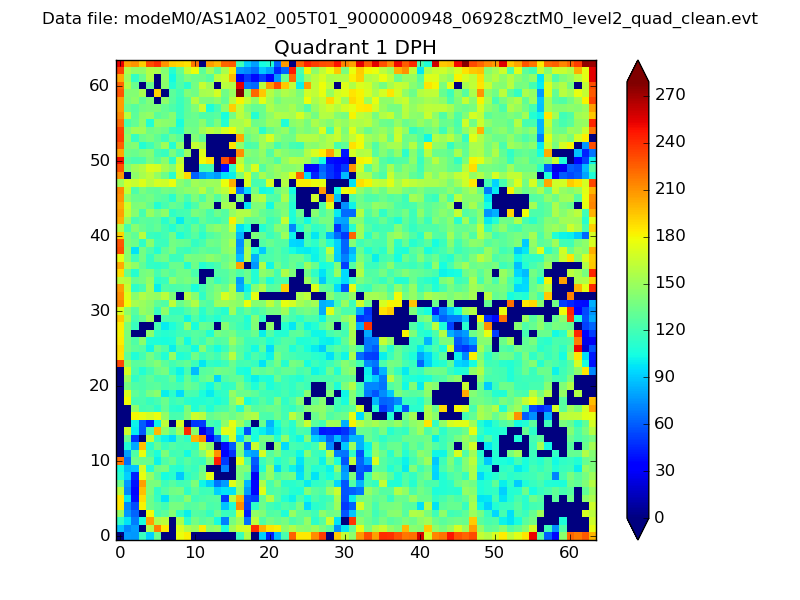
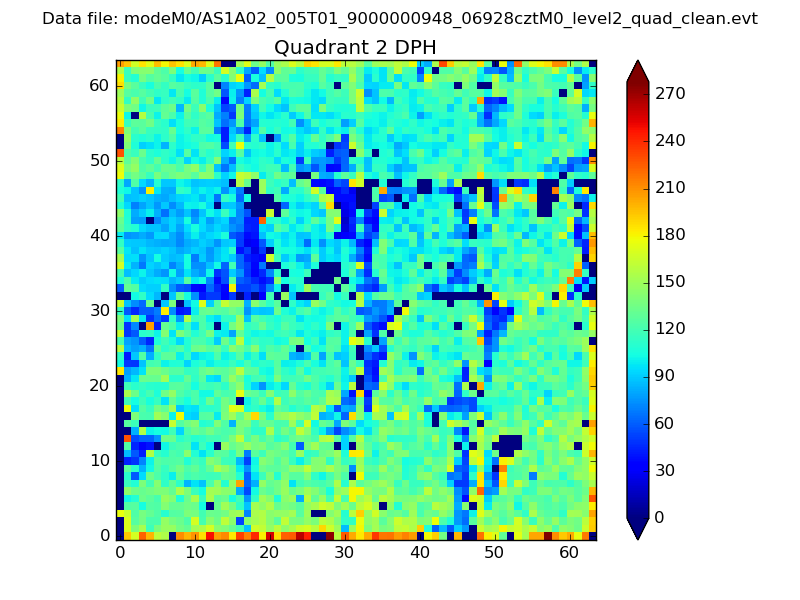
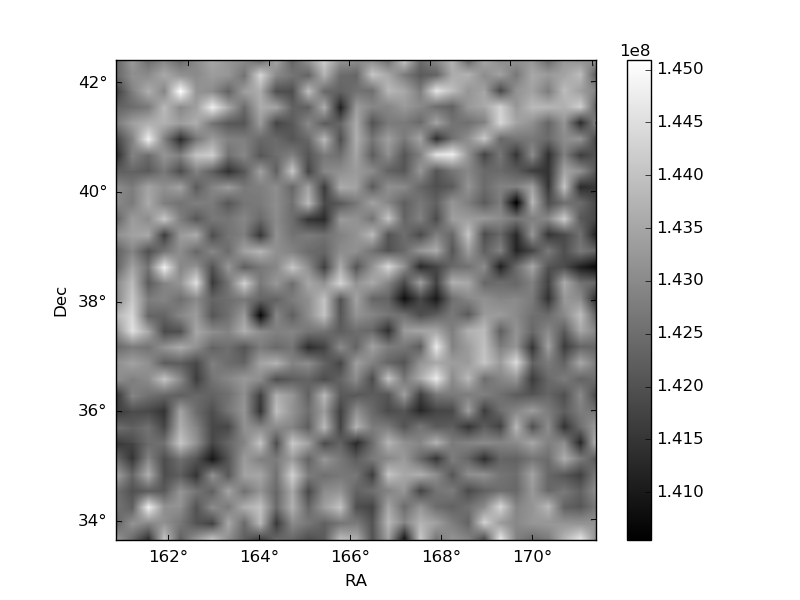
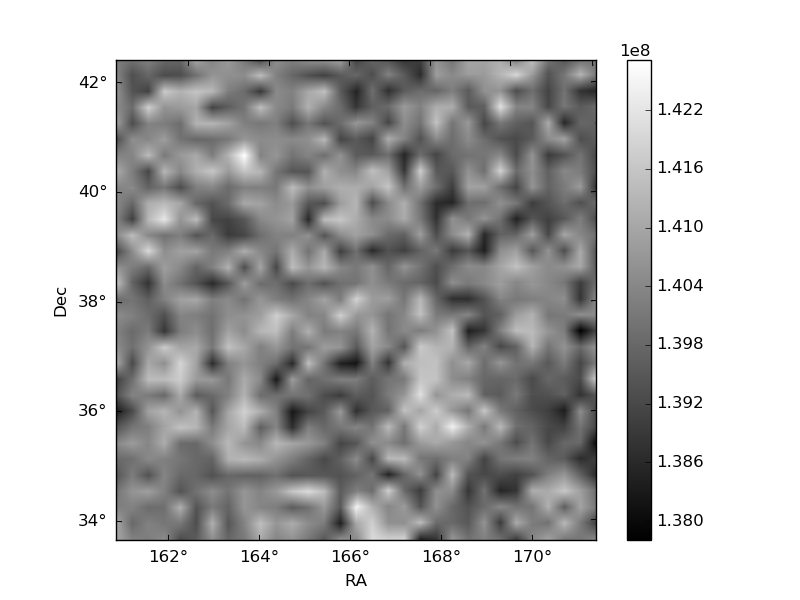
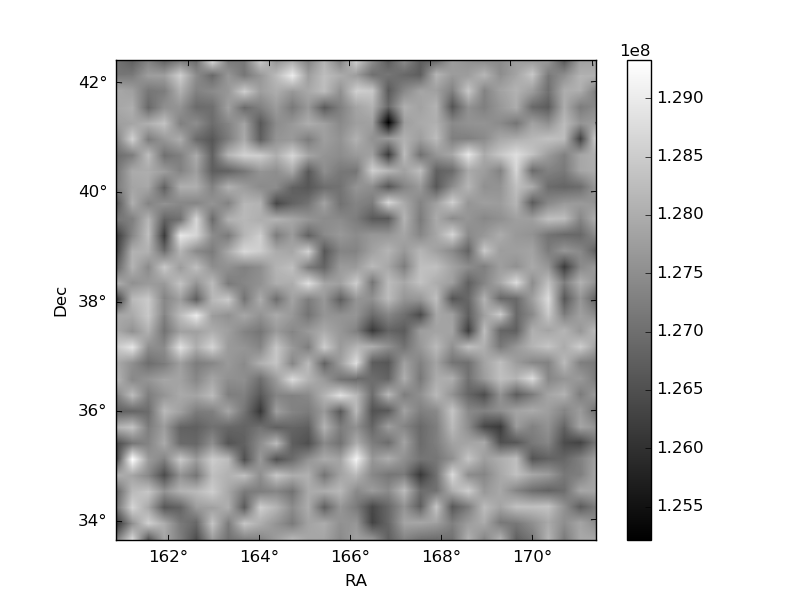
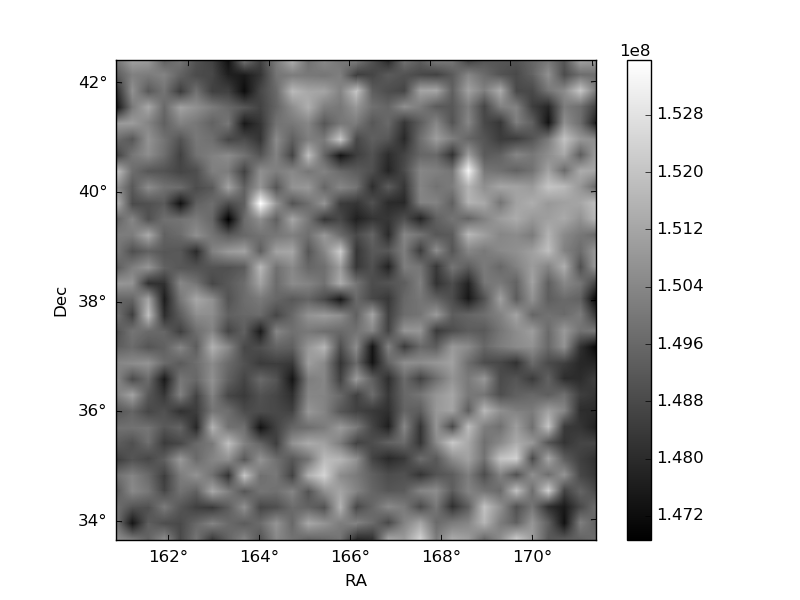
Histogram calculated using DETX and DETY for each event in the final _common_clean file
| Quadrant A | 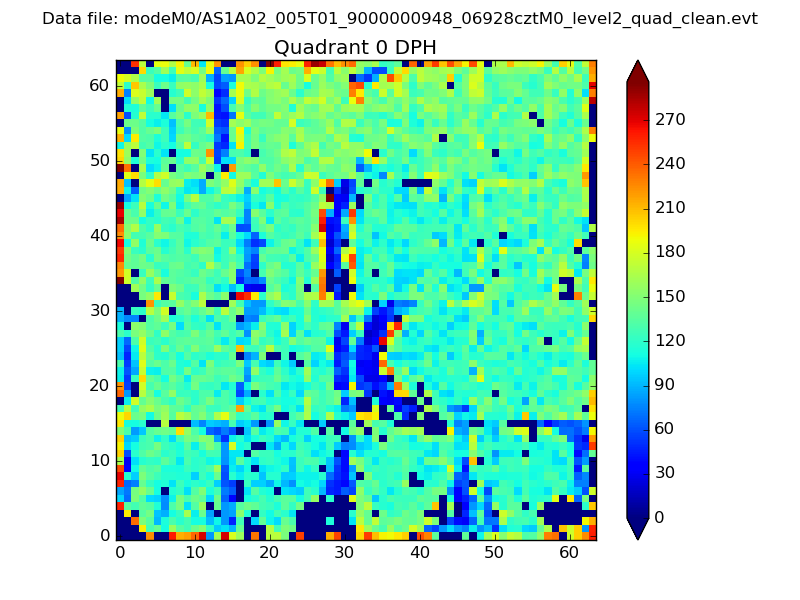 |
 |
Quadrant B |
|---|---|---|---|
| Quadrant D |  |
 |
Quadrant C |
| Plot type | Count rate plots | Images |
|---|---|---|
| Comparison with Poisson distribution Blue bars denote a histogram of data divided into 1 sec bins. Red curve is a Poisson curve with rate = median count rate of data. |
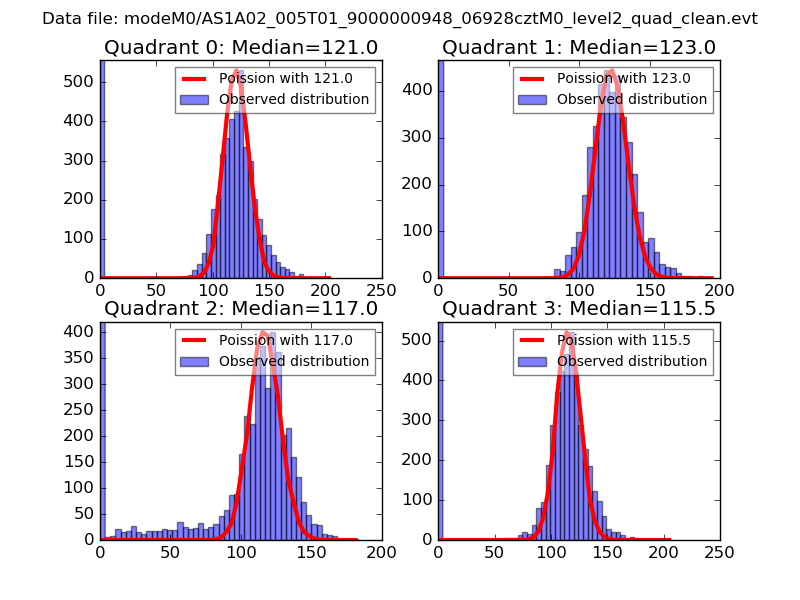 |
 |
| Quadrant-wise count rates Data is divided into 100 sec bins |
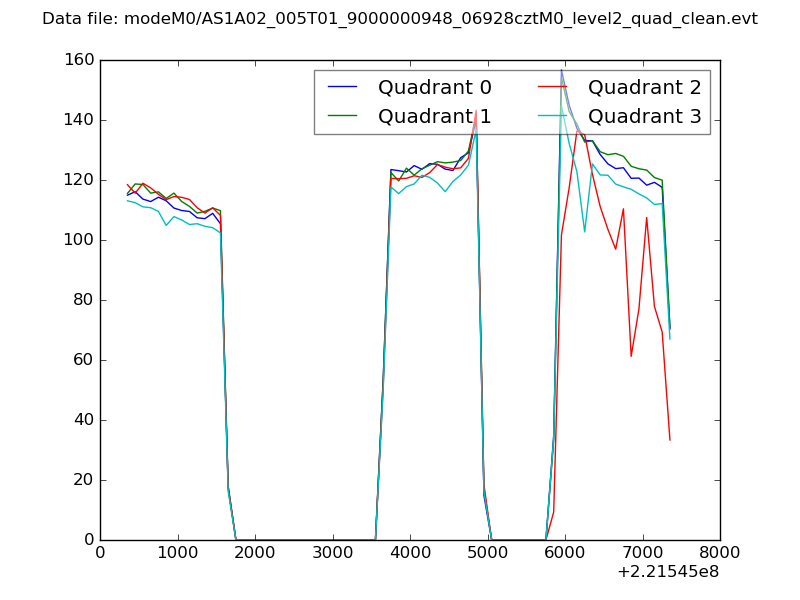 |
|
| Module-wise count rates for Quadrant A Data is divided into 100 sec bins |
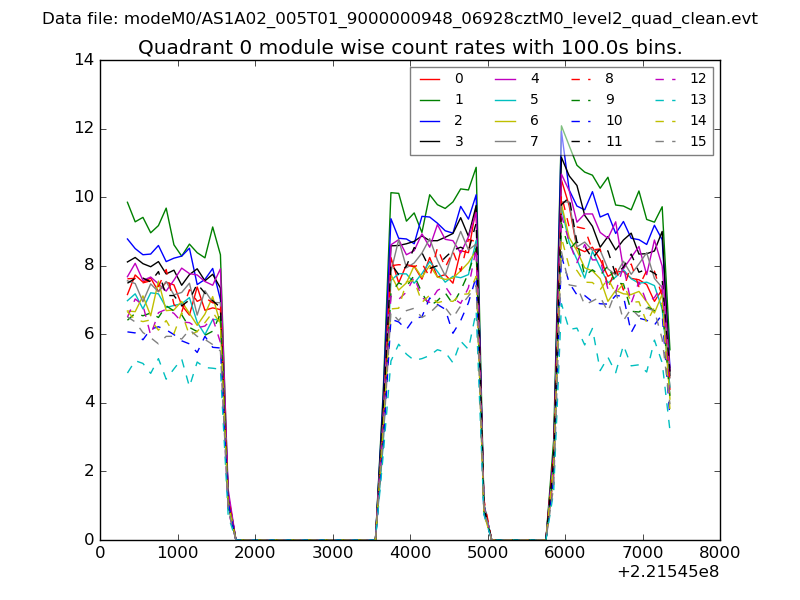 |
 |
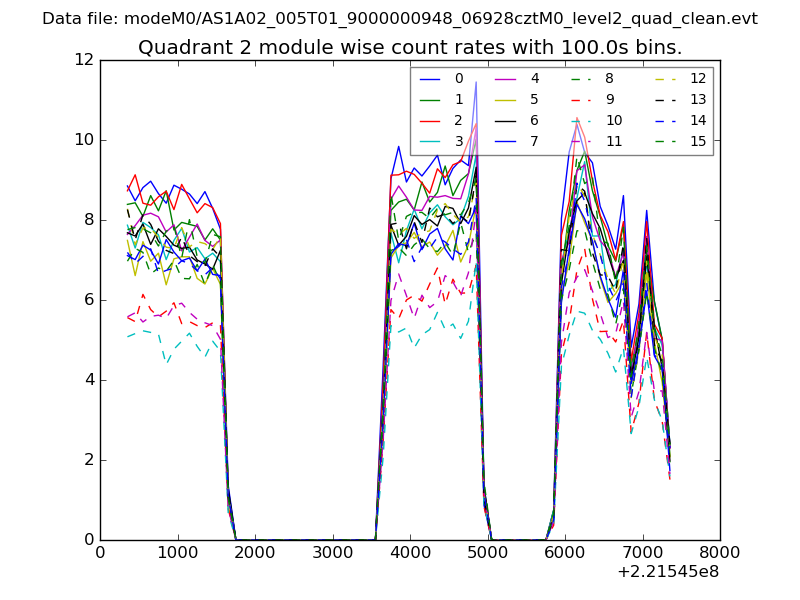
| Module-wise count rates for Quadrant B Data is divided into 100 sec bins |
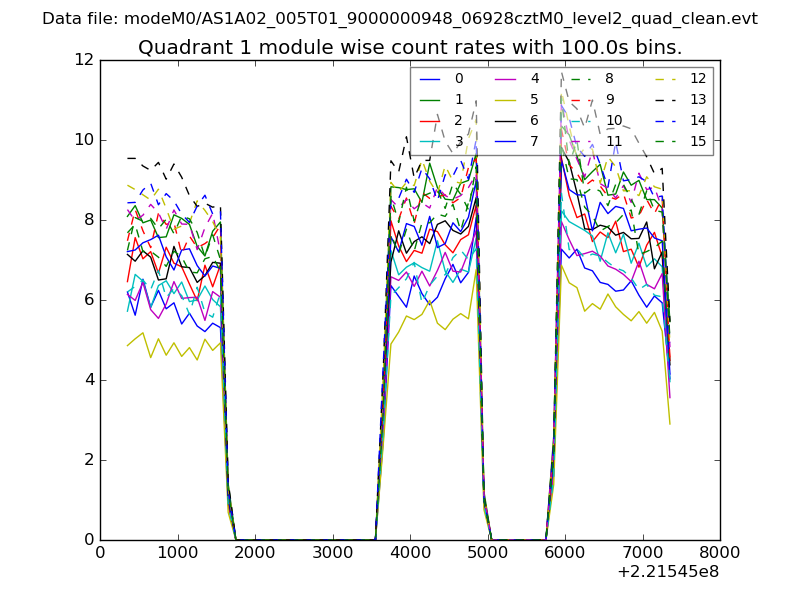 |
 |
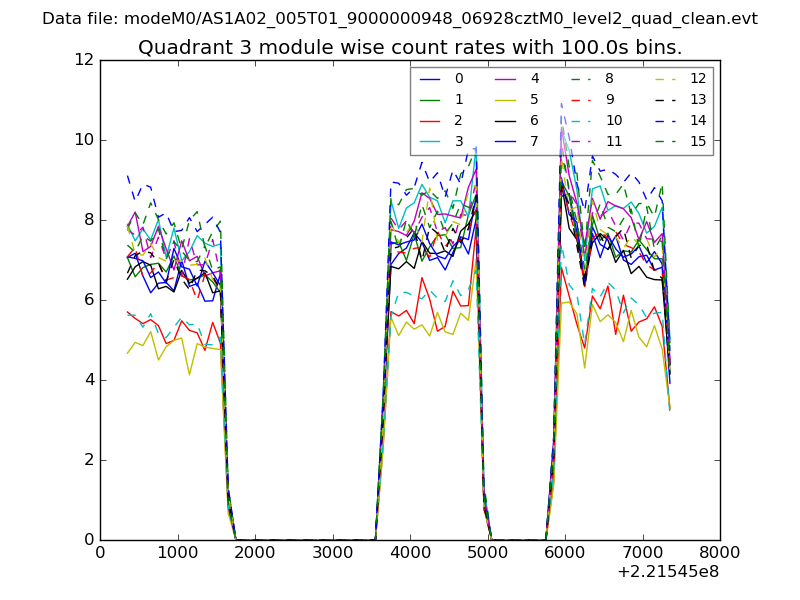
| Module-wise count rates for Quadrant C Data is divided into 100 sec bins |
 |
 |
| Module-wise count rates for Quadrant D Data is divided into 100 sec bins |
 |
 |
| Parameter | Plot |
|---|---|
| CZT HV Monitor | 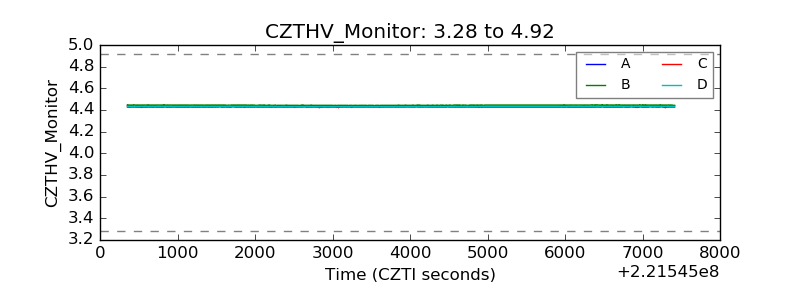 |
| D_VDD | 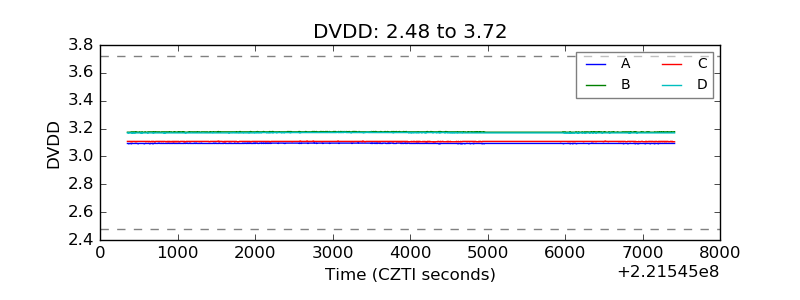 |
| Temperature 1 | 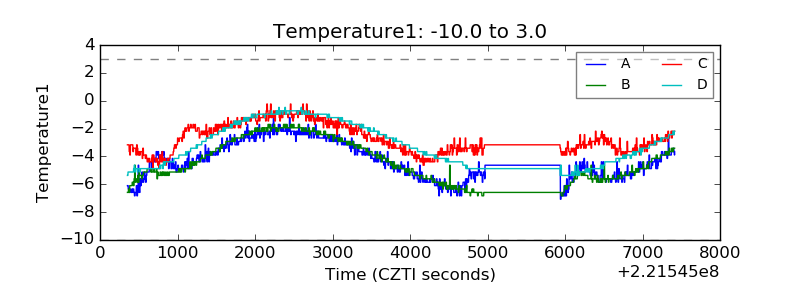 |
| Veto HV Monitor | 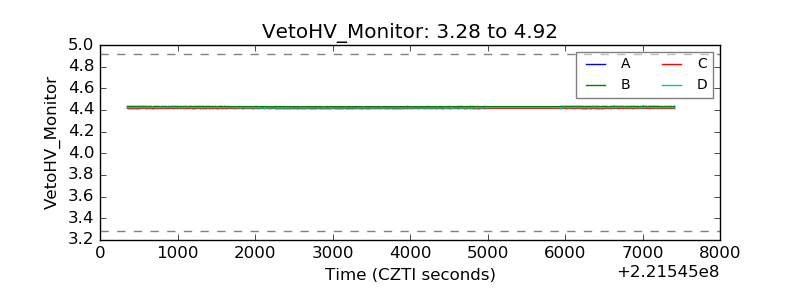 |
| Veto LLD | 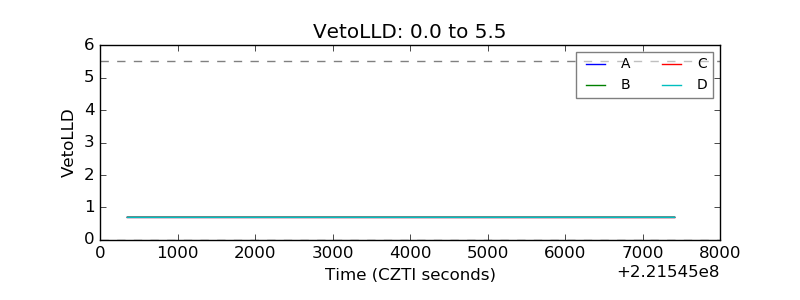 |
| Alpha Counter | 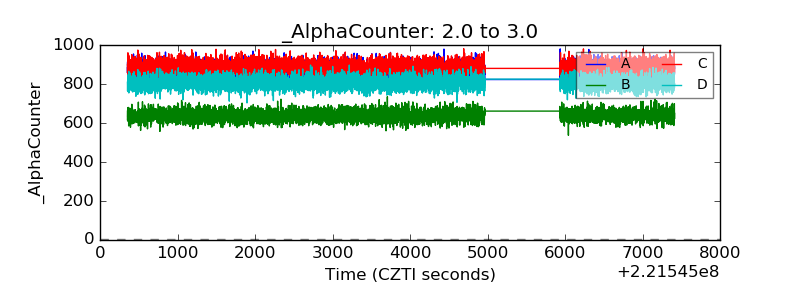 |
| _CPM_Rate |  |
| CZT Counter | 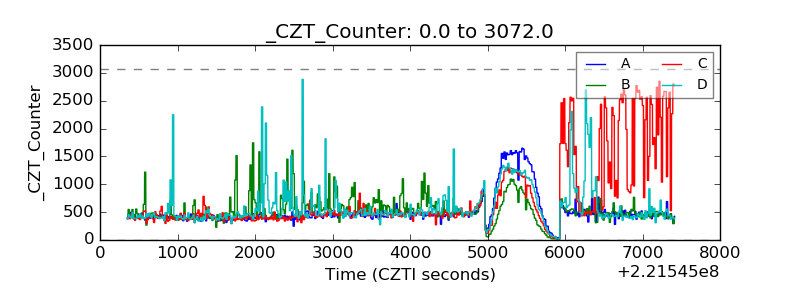 |
| +2.5 Volts monitor | 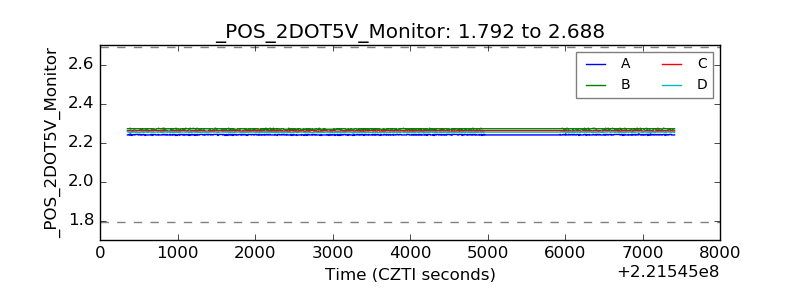 |
| +5 Volts monitor |  |
| _ROLL_ROT | 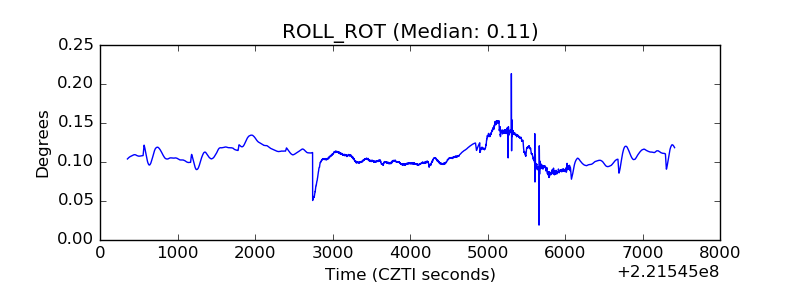 |
| _Roll_DEC | 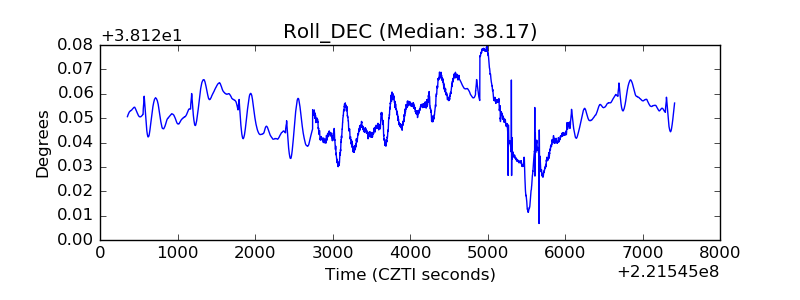 |
| _Roll_RA | 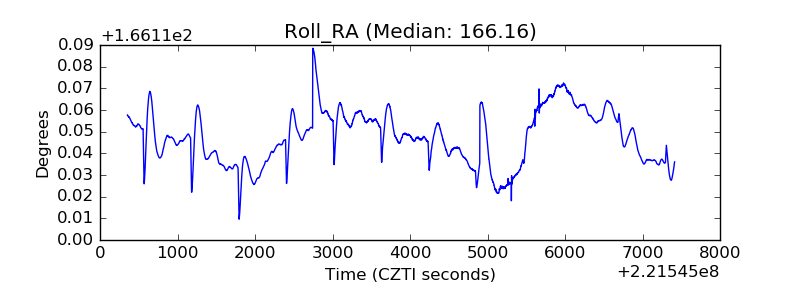 |
| Veto Counter | 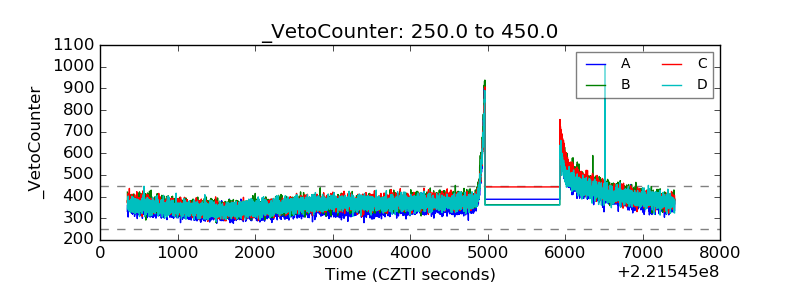 |