| Param | Original file | Final file |
|---|---|---|
| Filename | modeM0/AS1A02_005T01_9000000948_06930cztM0_level2.evt | modeM0/AS1A02_005T01_9000000948_06930cztM0_level2_quad_clean.evt |
| Size (bytes) | 666,380,160 | 74,986,560 |
| Size | 635.5 MB | 71.5 MB |
| Events in quadrant A | 2,804,202 | 499,137 |
| Events in quadrant B | 3,196,104 | 503,500 |
| Events in quadrant C | 10,590,615 | 367,194 |
| Events in quadrant D | 3,179,552 | 476,514 |
| Mode SS | |||
|---|---|---|---|
| Quadrant | BADHDUFLAG | Total packets | Discarded packets |
| A | 0 | 124 | 0 |
| B | 0 | 124 | 0 |
| C | 0 | 124 | 0 |
| D | 0 | 124 | 0 |
| Mode M0 | |||
|---|---|---|---|
| Quadrant | BADHDUFLAG | Total packets | Discarded packets |
| A | 0 | 12357 | 2 |
| B | 0 | 13316 | 1 |
| C | 0 | 35549 | 1 |
| D | 0 | 13427 | 1 |
| Mode M9 | |||
|---|---|---|---|
| Quadrant | BADHDUFLAG | Total packets | Discarded packets |
| A | 0 | 11 | 0 |
| B | 0 | 11 | 0 |
| C | 0 | 11 | 0 |
| D | 0 | 11 | 0 |
| Quadrant | Total seconds | Saturated seconds | Saturation percentage |
|---|---|---|---|
| A | 6060 | 47 | 0.775578% |
| B | 6060 | 97 | 1.600660% |
| C | 6060 | 3214 | 53.036304% |
| D | 6060 | 52 | 0.858086% |
Noise dominated data is calculated using 1-second bins in cleaned event files. If a bin has >2000 counts, and if more than 50% of those come from <1% of pixels, then it is considered to be noise-dominated and hence unusable.
| Quadrant | # 1 sec bins | Bins with >0 counts | Bins with >2000 counts | High rate bins dominated by noise | Noise dominated (total time) | Noise dominated (detector-on time) | Marked lightcurve |
|---|---|---|---|---|---|---|---|
| A | 7175 | 6061 | 0 | 0 | 0.00% | 0.00% | 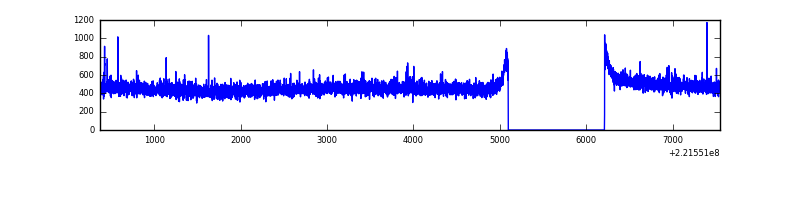 |
| B | 7175 | 6061 | 36 | 36 | 0.50% | 0.59% | 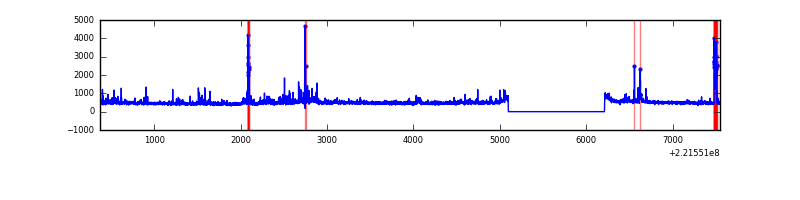 |
| C | 7175 | 6061 | 2667 | 2667 | 37.17% | 44.00% | 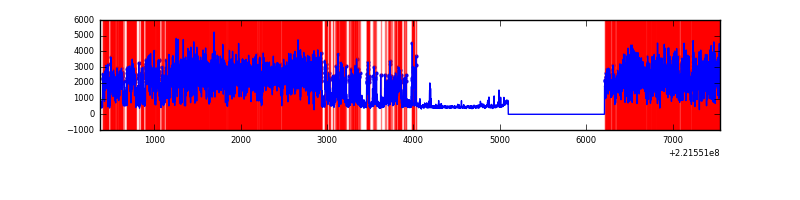 |
| D | 7175 | 6061 | 13 | 13 | 0.18% | 0.21% | 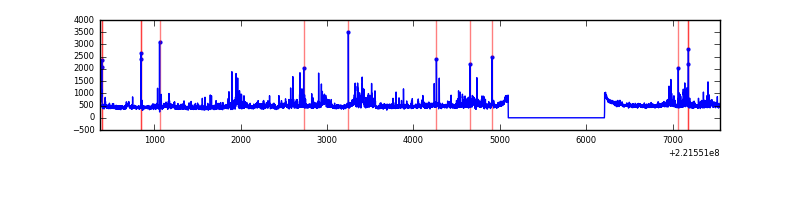 |
Top three noisy pixels from each quadrant. If the there are fewer than three noisy pixels in the level2.evt file, extra rows are filled as -1
| Pixel properties | Quadrant properties | ||||||
|---|---|---|---|---|---|---|---|
| Quadrant | DetID | PixID | Counts | Sigma | Mean | Median | Sigma |
| A | 13 | 14 | 7717 | 47.55 | 723 | 708 | 147.4 |
| A | 0 | 226 | 6939 | 42.28 | 723 | 708 | 147.4 |
| A | 12 | 194 | 6758 | 41.05 | 723 | 708 | 147.4 |
| B | 4 | 48 | 152875 | 1107.86 | 716 | 700 | 137.4 |
| B | 0 | 228 | 118151 | 855.07 | 716 | 700 | 137.4 |
| B | 4 | 81 | 96438 | 696.99 | 716 | 700 | 137.4 |
| C | 9 | 247 | 8589983 | 72419.88 | 509 | 511 | 118.6 |
| C | 14 | 67 | 4929 | 37.25 | 509 | 511 | 118.6 |
| C | 12 | 4 | 4701 | 35.33 | 509 | 511 | 118.6 |
| D | 2 | 136 | 213440 | 1234.56 | 699 | 678 | 172.3 |
| D | 8 | 195 | 85411 | 491.67 | 699 | 678 | 172.3 |
| D | 12 | 233 | 76732 | 441.31 | 699 | 678 | 172.3 |
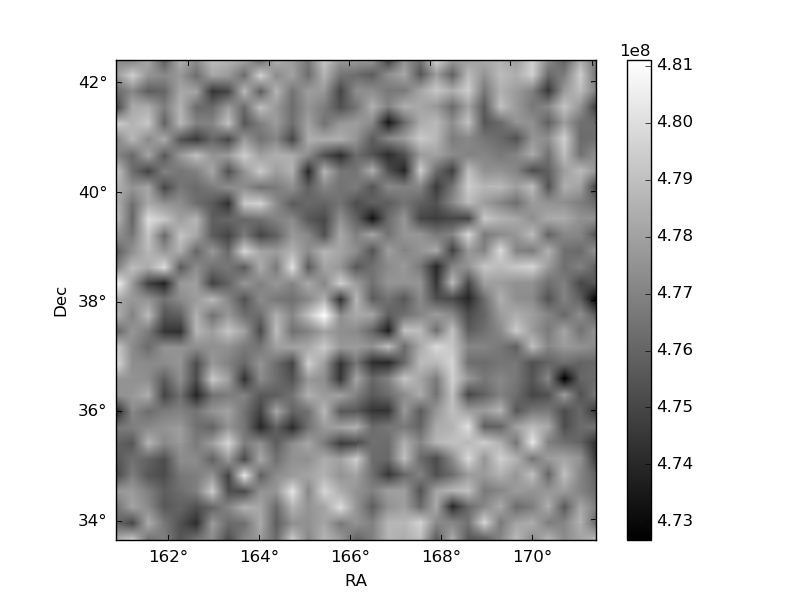
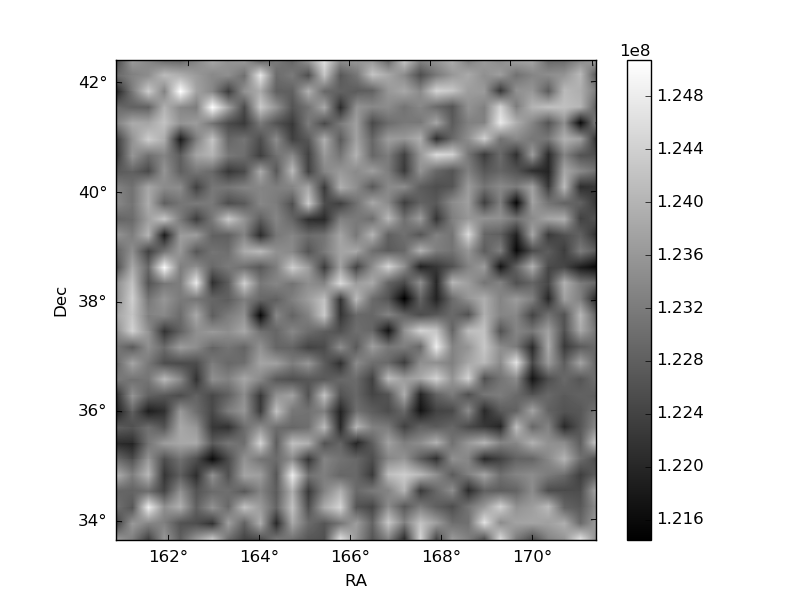
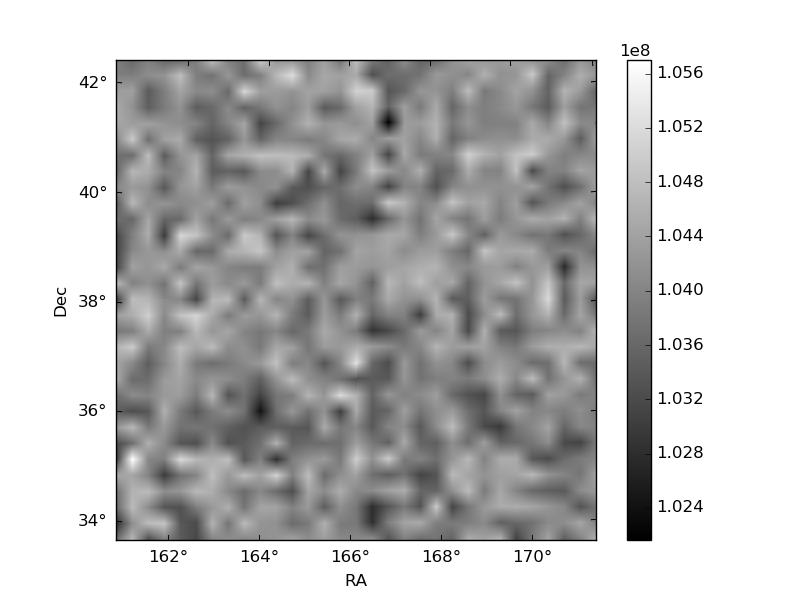
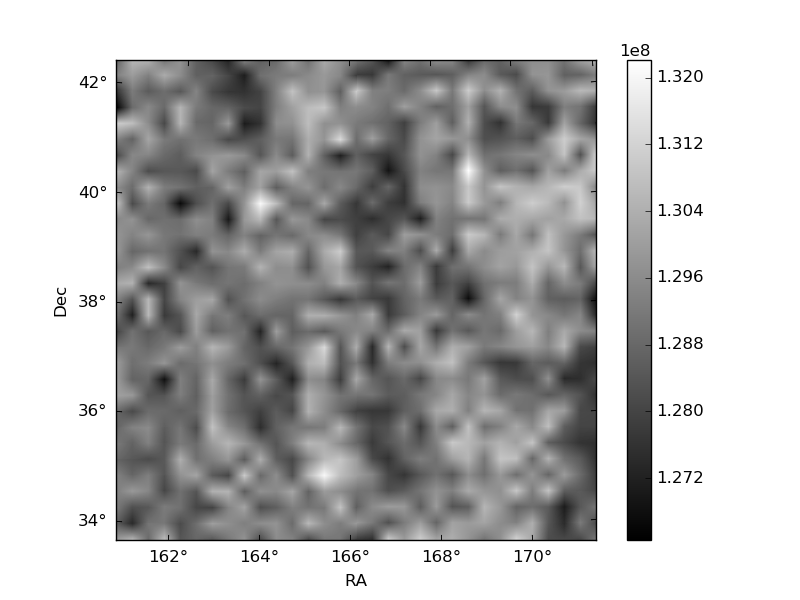
Histogram calculated using DETX and DETY for each event in the final _common_clean file
| Quadrant A | 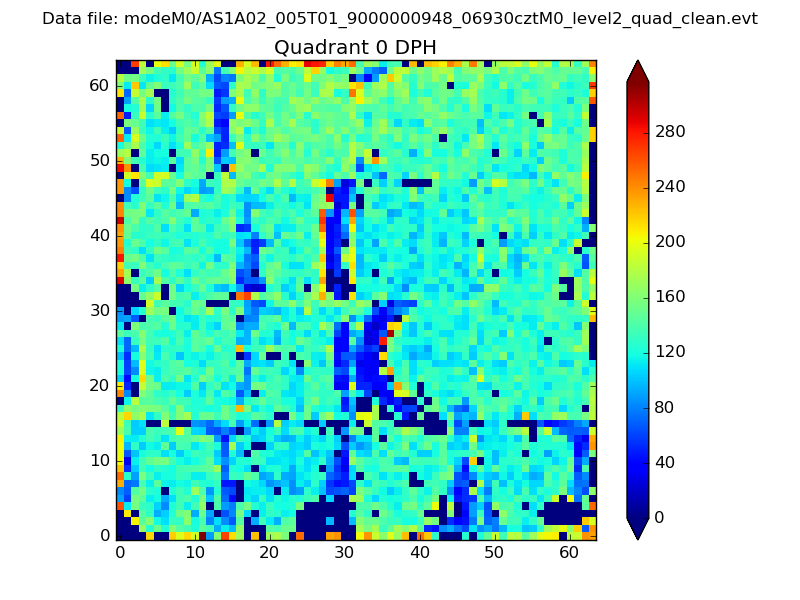 |
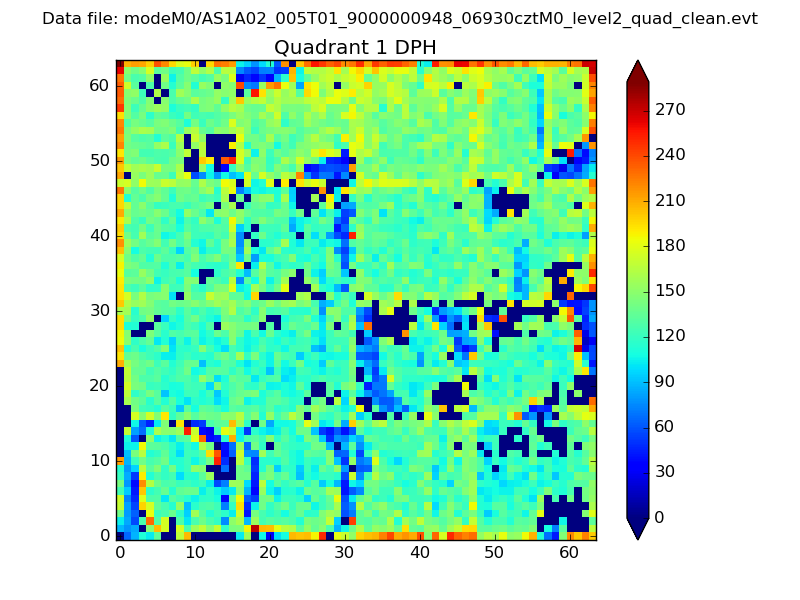 |
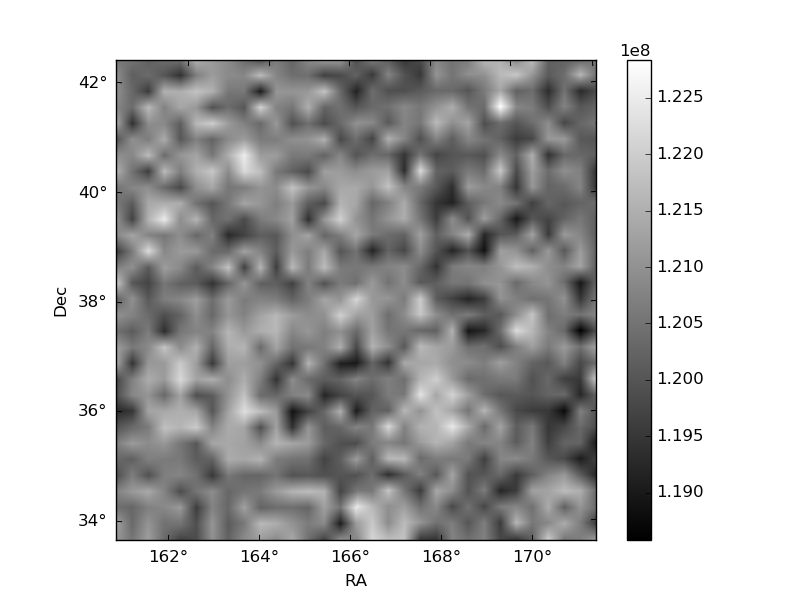
Quadrant B |
|---|---|---|---|
| Quadrant D | 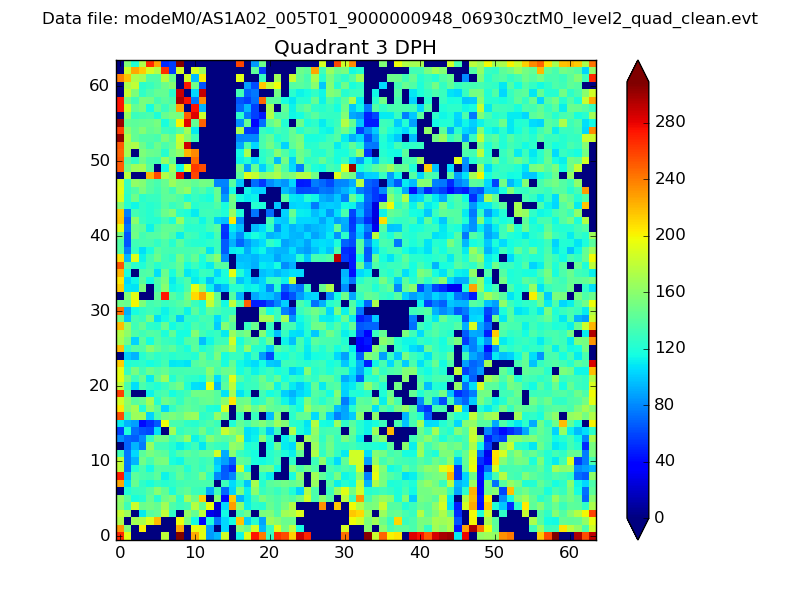 |
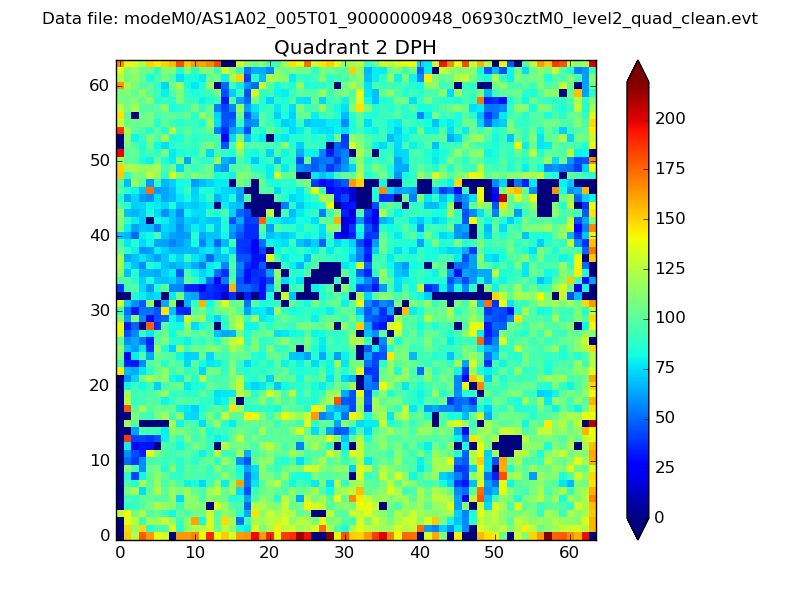 |
Quadrant C |
| Plot type | Count rate plots | Images |
|---|---|---|
| Comparison with Poisson distribution Blue bars denote a histogram of data divided into 1 sec bins. Red curve is a Poisson curve with rate = median count rate of data. |
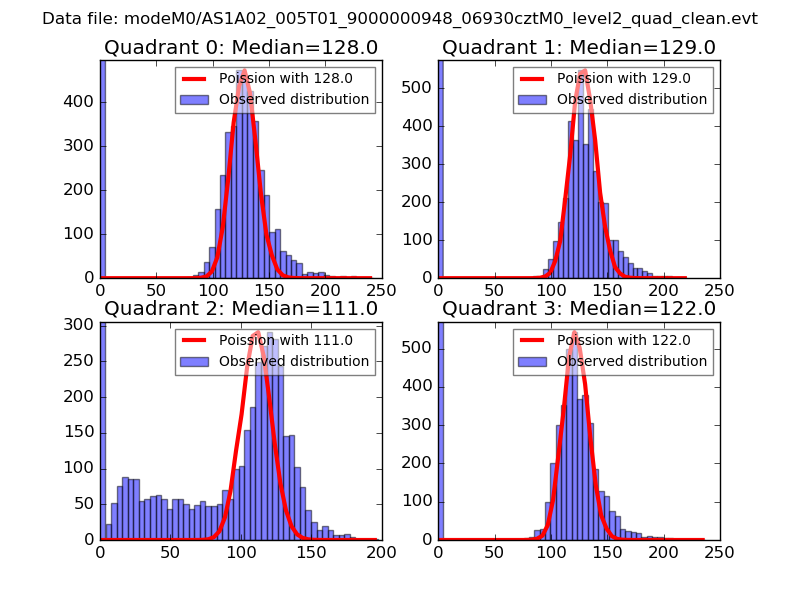 |
 |
| Quadrant-wise count rates Data is divided into 100 sec bins |
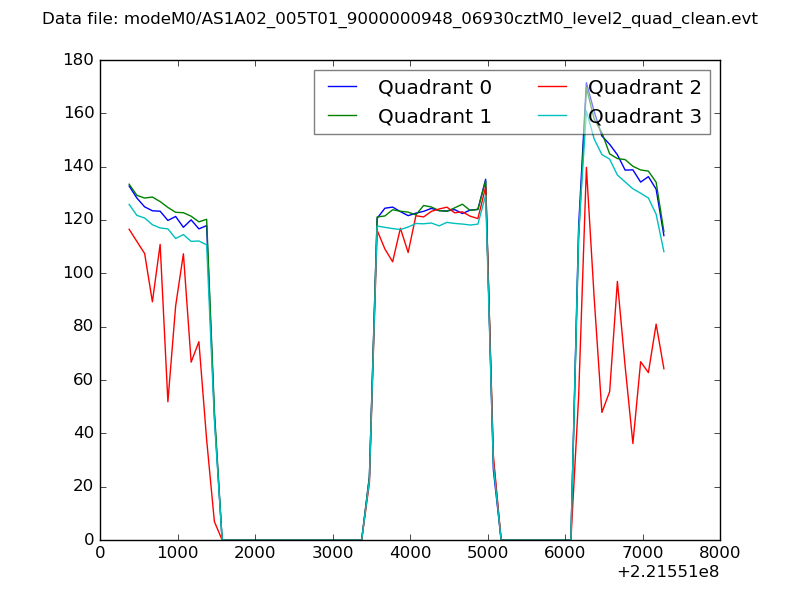 |
|
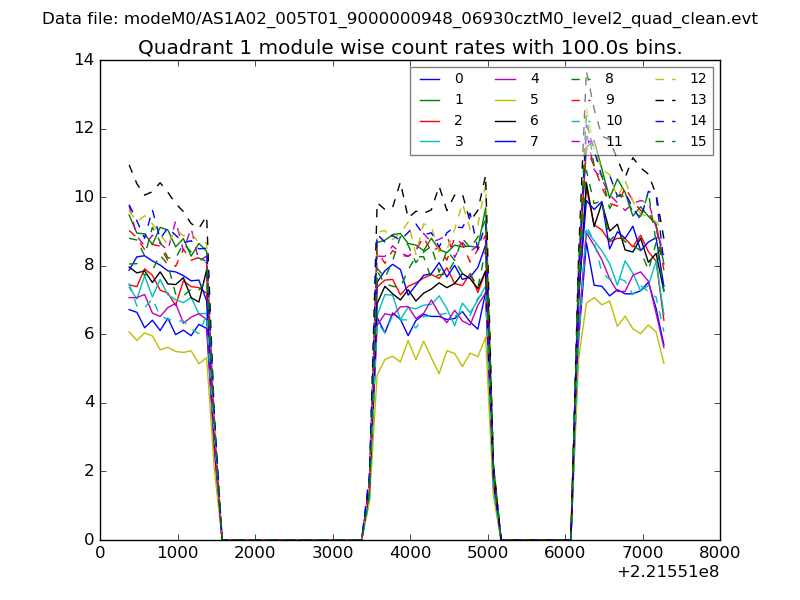
| Module-wise count rates for Quadrant A Data is divided into 100 sec bins |
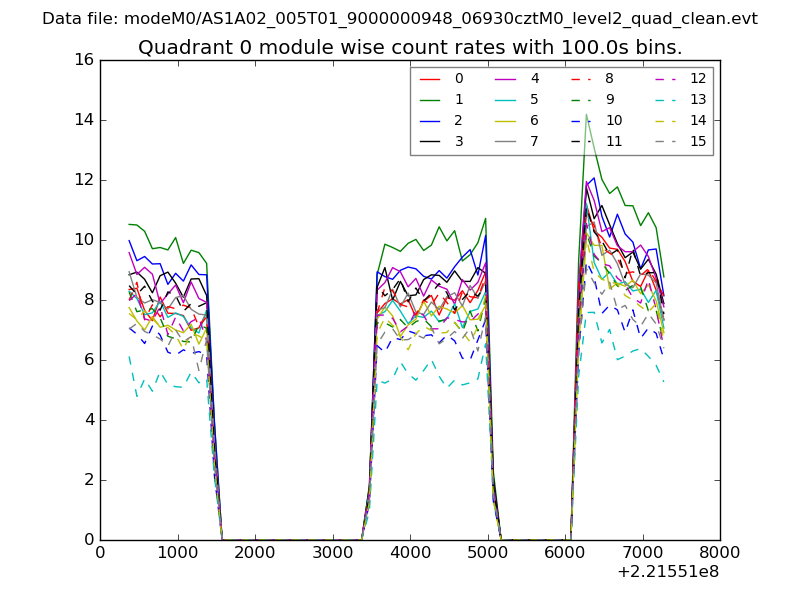 |
 |
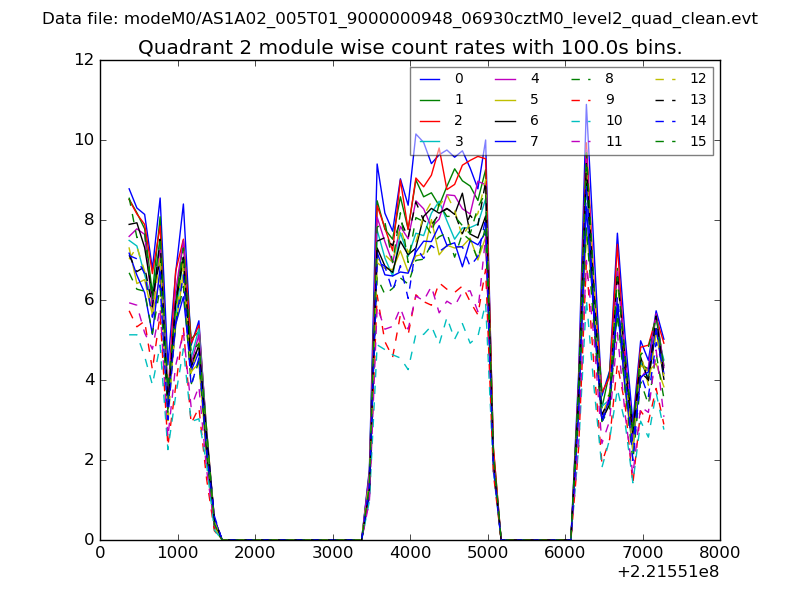
| Module-wise count rates for Quadrant B Data is divided into 100 sec bins |
 |
 |
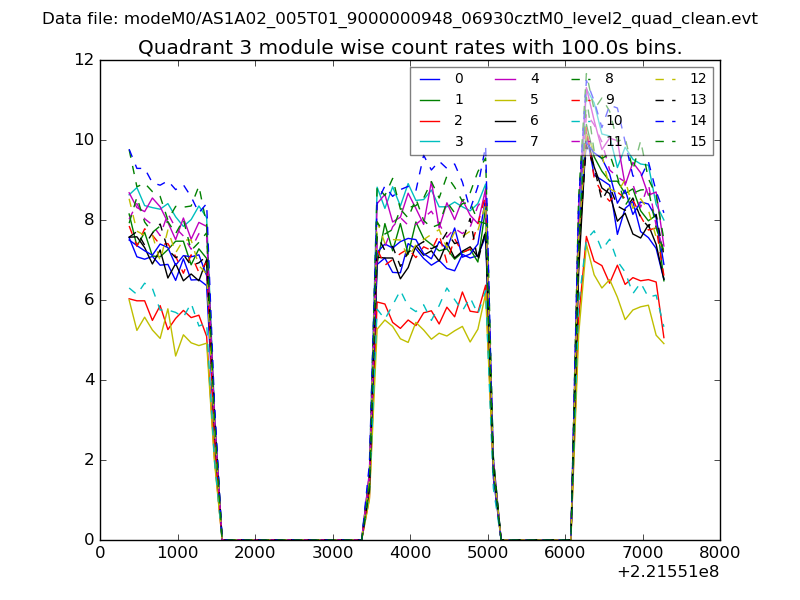
| Module-wise count rates for Quadrant C Data is divided into 100 sec bins |
 |
 |
| Module-wise count rates for Quadrant D Data is divided into 100 sec bins |
 |
 |
| Parameter | Plot |
|---|---|
| CZT HV Monitor | 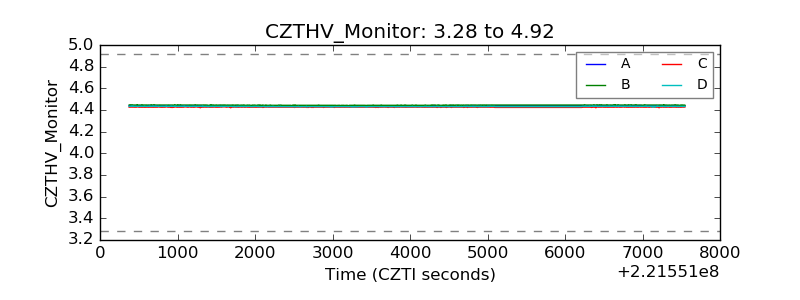 |
| D_VDD | 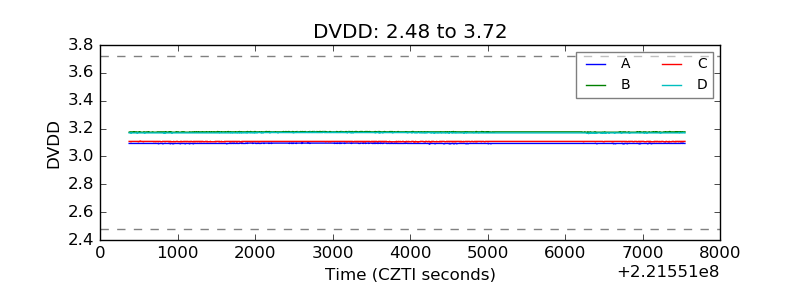 |
| Temperature 1 | 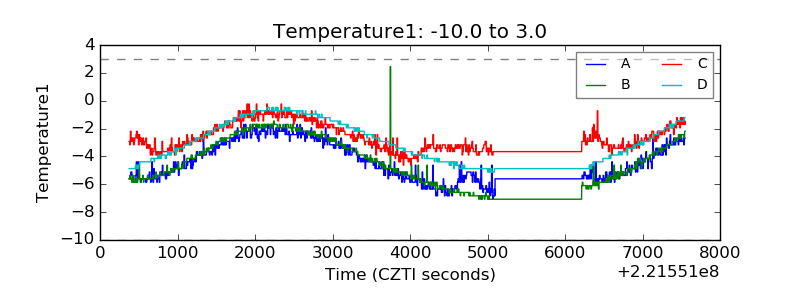 |
| Veto HV Monitor | 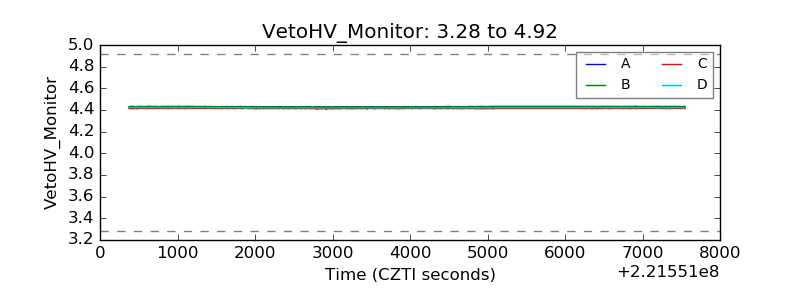 |
| Veto LLD | 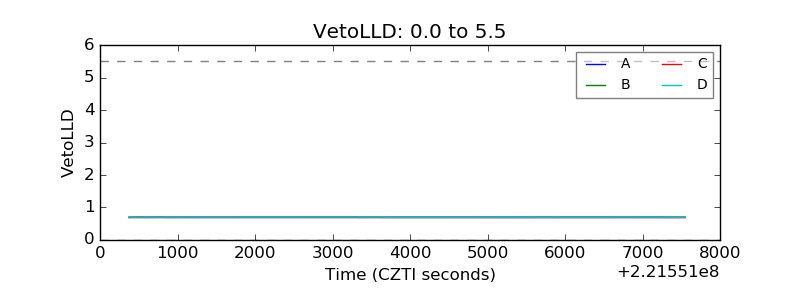 |
| Alpha Counter | 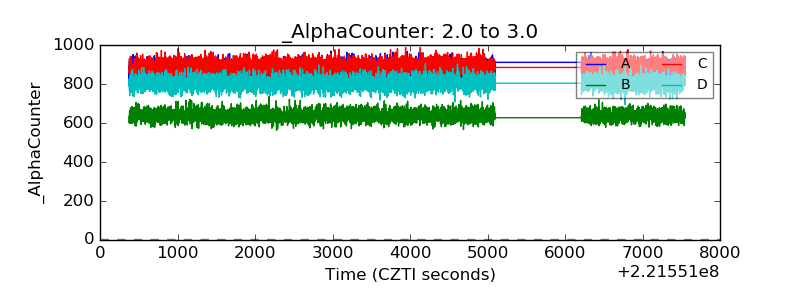 |
| _CPM_Rate | 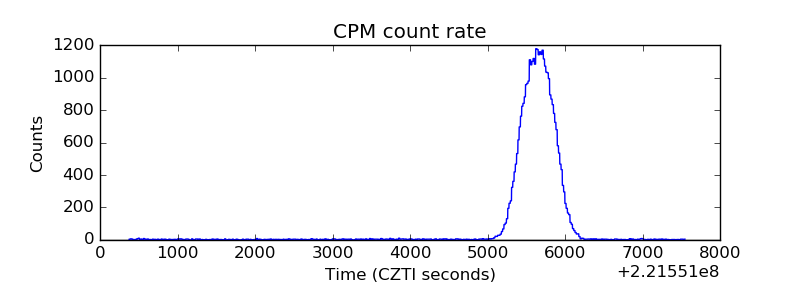 |
| CZT Counter | 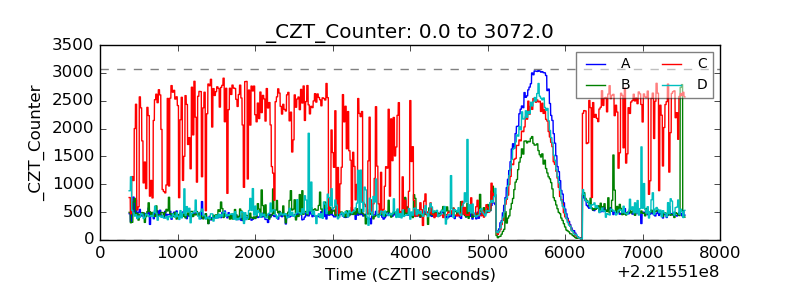 |
| +2.5 Volts monitor | 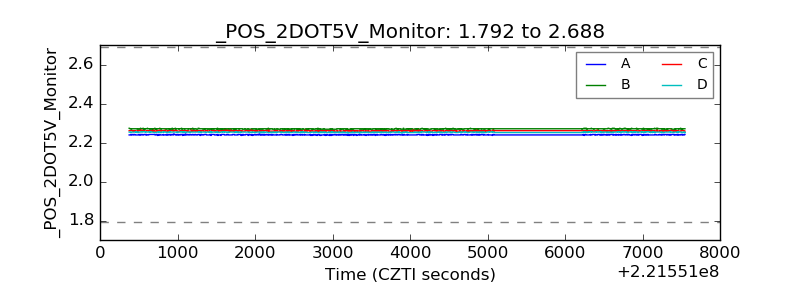 |
| +5 Volts monitor | 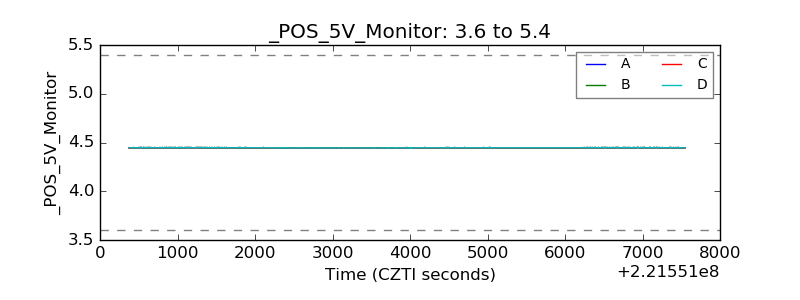 |
| _ROLL_ROT | 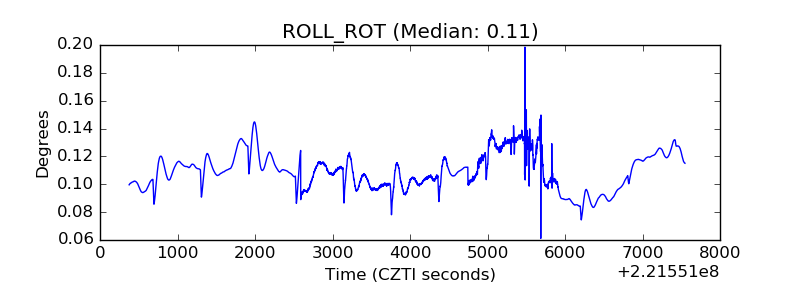 |
| _Roll_DEC | 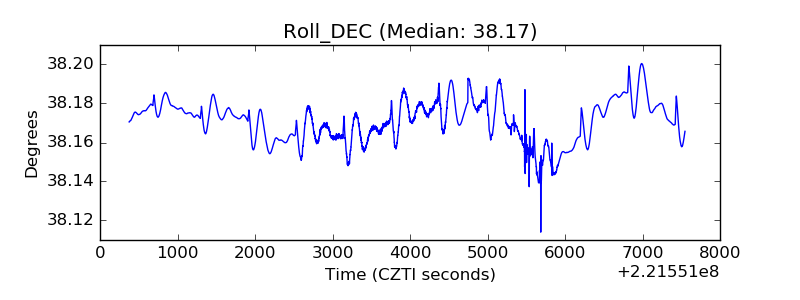 |
| _Roll_RA | 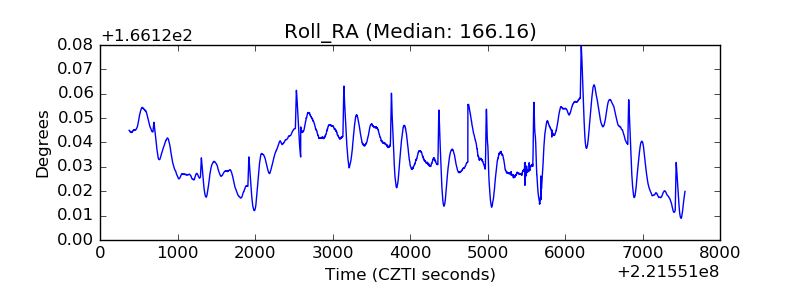 |
| Veto Counter | 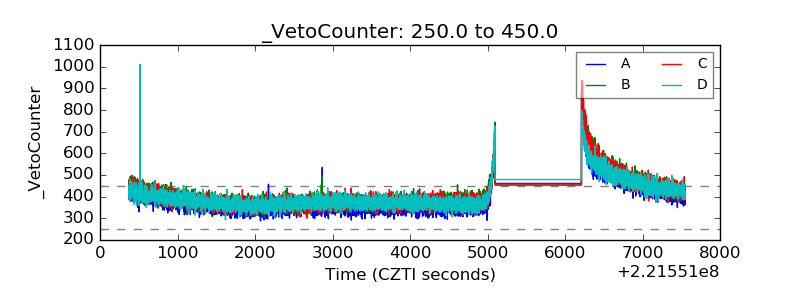 |