| Param | Original file | Final file |
|---|---|---|
| Filename | modeM0/AS1A02_005T01_9000000948_07063cztM0_level2.evt | modeM0/AS1A02_005T01_9000000948_07063cztM0_level2_quad_clean.evt |
| Size (bytes) | 209,445,120 | 35,035,200 |
| Size | 199.7 MB | 33.4 MB |
| Events in quadrant A | 1,465,522 | 215,421 |
| Events in quadrant B | 1,556,424 | 219,765 |
| Events in quadrant C | 1,528,296 | 217,066 |
| Events in quadrant D | 1,597,527 | 204,899 |
| Mode SS | |||
|---|---|---|---|
| Quadrant | BADHDUFLAG | Total packets | Discarded packets |
| A | 0 | 60 | 0 |
| B | 0 | 60 | 0 |
| C | 0 | 60 | 0 |
| D | 0 | 60 | 0 |
| Mode M0 | |||
|---|---|---|---|
| Quadrant | BADHDUFLAG | Total packets | Discarded packets |
| A | 0 | 5993 | 2 |
| B | 0 | 6345 | 1 |
| C | 0 | 6234 | 1 |
| D | 0 | 6394 | 1 |
| Mode M9 | |||
|---|---|---|---|
| Quadrant | BADHDUFLAG | Total packets | Discarded packets |
| A | 0 | 13 | 0 |
| B | 0 | 13 | 0 |
| C | 0 | 13 | 0 |
| D | 0 | 13 | 0 |
| Quadrant | Total seconds | Saturated seconds | Saturation percentage |
|---|---|---|---|
| A | 2841 | 27 | 0.950370% |
| B | 2841 | 27 | 0.950370% |
| C | 2841 | 24 | 0.844773% |
| D | 2841 | 56 | 1.971137% |
Noise dominated data is calculated using 1-second bins in cleaned event files. If a bin has >2000 counts, and if more than 50% of those come from <1% of pixels, then it is considered to be noise-dominated and hence unusable.
| Quadrant | # 1 sec bins | Bins with >0 counts | Bins with >2000 counts | High rate bins dominated by noise | Noise dominated (total time) | Noise dominated (detector-on time) | Marked lightcurve |
|---|---|---|---|---|---|---|---|
| A | 4136 | 2842 | 0 | 0 | 0.00% | 0.00% | 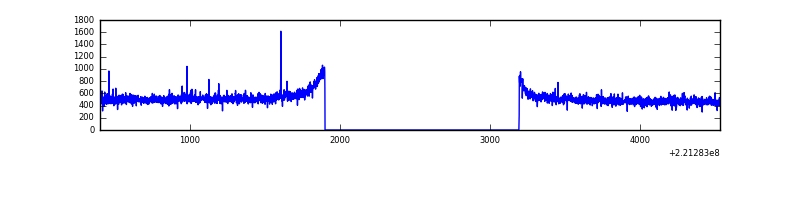 |
| B | 4136 | 2842 | 0 | 0 | 0.00% | 0.00% | 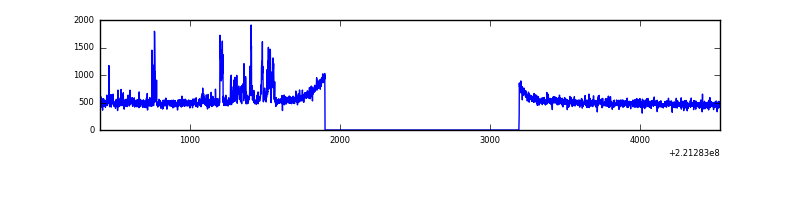 |
| C | 4136 | 2842 | 14 | 14 | 0.34% | 0.49% | 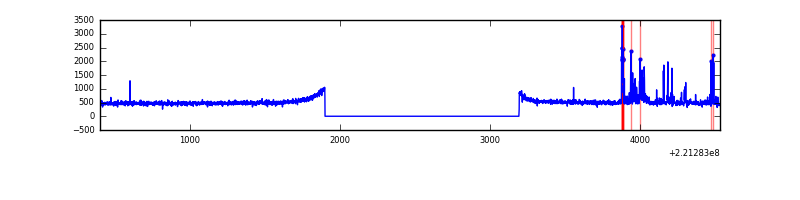 |
| D | 4136 | 2842 | 37 | 37 | 0.89% | 1.30% | 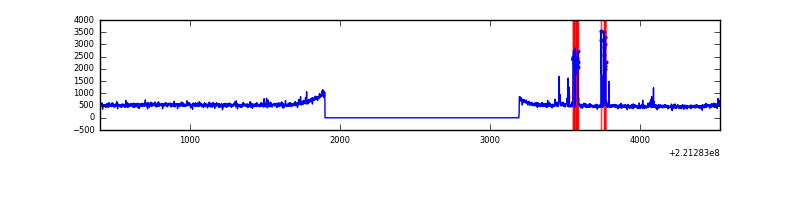 |
Top three noisy pixels from each quadrant. If the there are fewer than three noisy pixels in the level2.evt file, extra rows are filled as -1
| Pixel properties | Quadrant properties | ||||||
|---|---|---|---|---|---|---|---|
| Quadrant | DetID | PixID | Counts | Sigma | Mean | Median | Sigma |
| A | 14 | 111 | 27410 | 352.84 | 370 | 362 | 76.7 |
| A | 13 | 14 | 4139 | 49.27 | 370 | 362 | 76.7 |
| A | 0 | 226 | 3532 | 41.35 | 370 | 362 | 76.7 |
| B | 0 | 228 | 95177 | 1300.93 | 373 | 364 | 72.9 |
| B | 0 | 214 | 9586 | 126.53 | 373 | 364 | 72.9 |
| B | 12 | 111 | 6808 | 88.42 | 373 | 364 | 72.9 |
| C | 4 | 254 | 101991 | 1179.93 | 365 | 367 | 86.1 |
| C | 13 | 61 | 2812 | 28.39 | 365 | 367 | 86.1 |
| C | 1 | 3 | 1045 | 7.87 | 365 | 367 | 86.1 |
| D | 9 | 68 | 111749 | 1243.3 | 361 | 351 | 89.6 |
| D | 8 | 195 | 107979 | 1201.23 | 361 | 351 | 89.6 |
| D | 12 | 233 | 8604 | 92.11 | 361 | 351 | 89.6 |
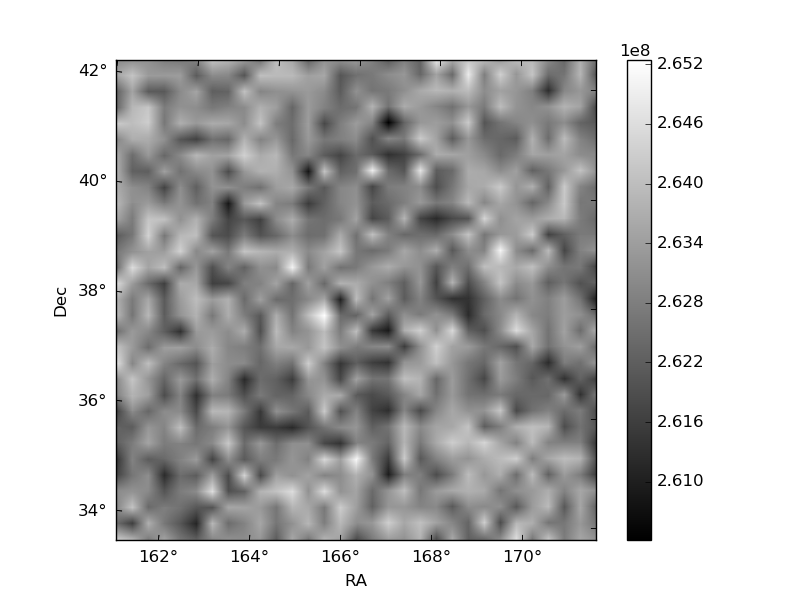
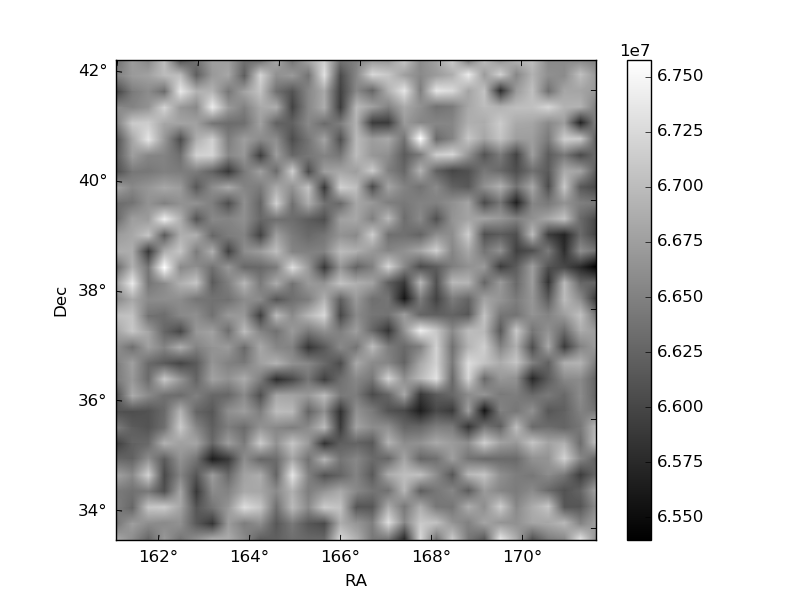
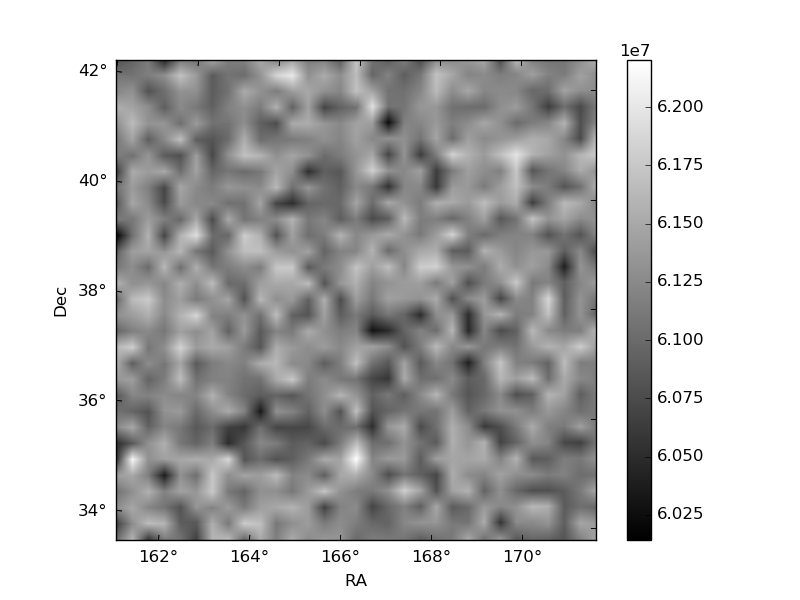
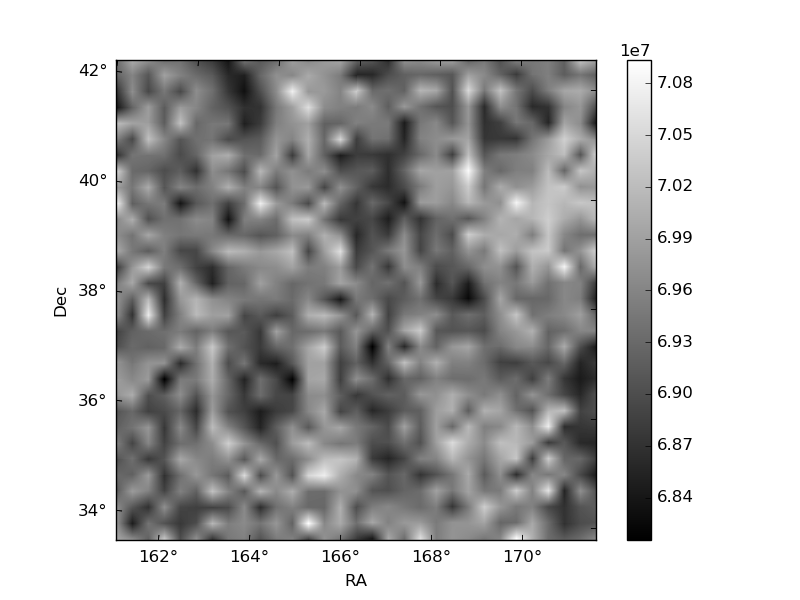
Histogram calculated using DETX and DETY for each event in the final _common_clean file
| Quadrant A | 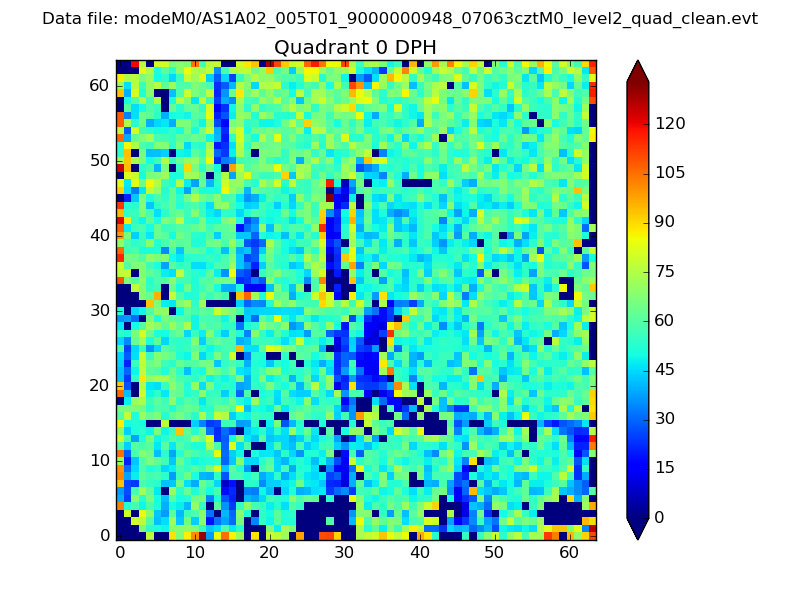 |
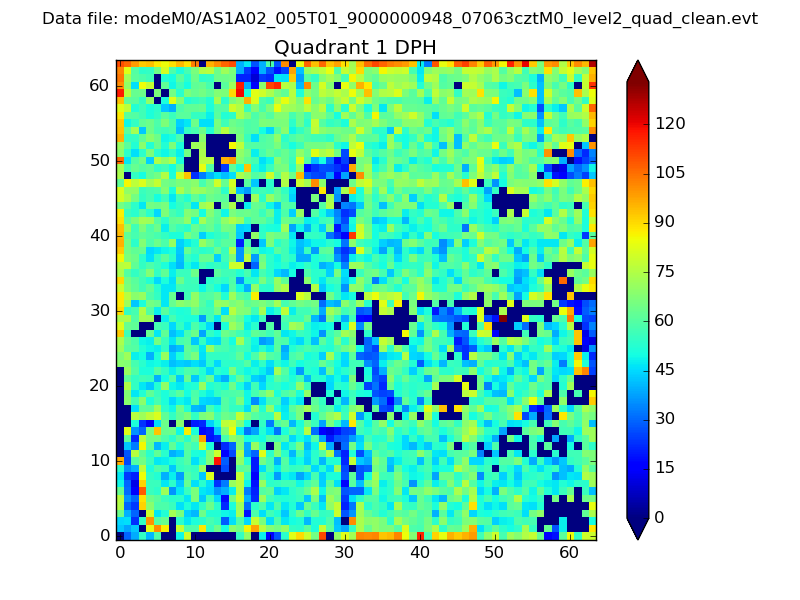 |
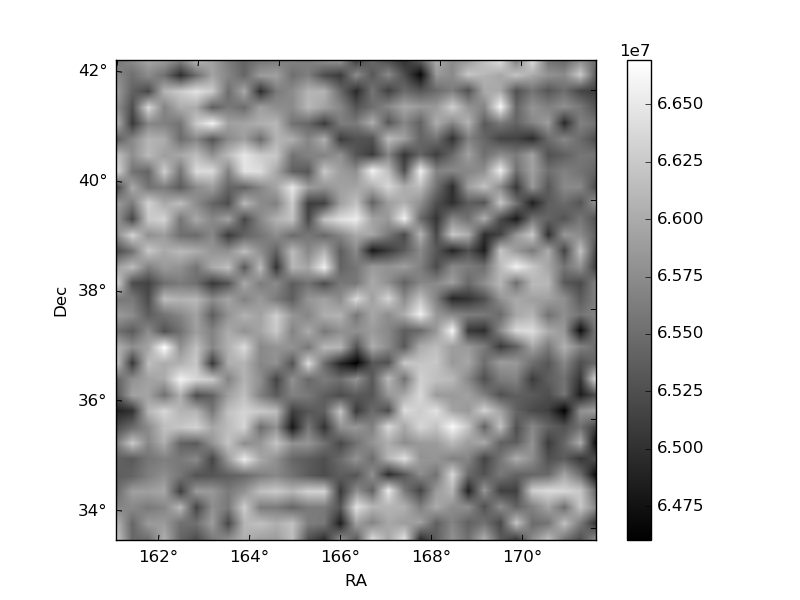
Quadrant B |
|---|---|---|---|
| Quadrant D | 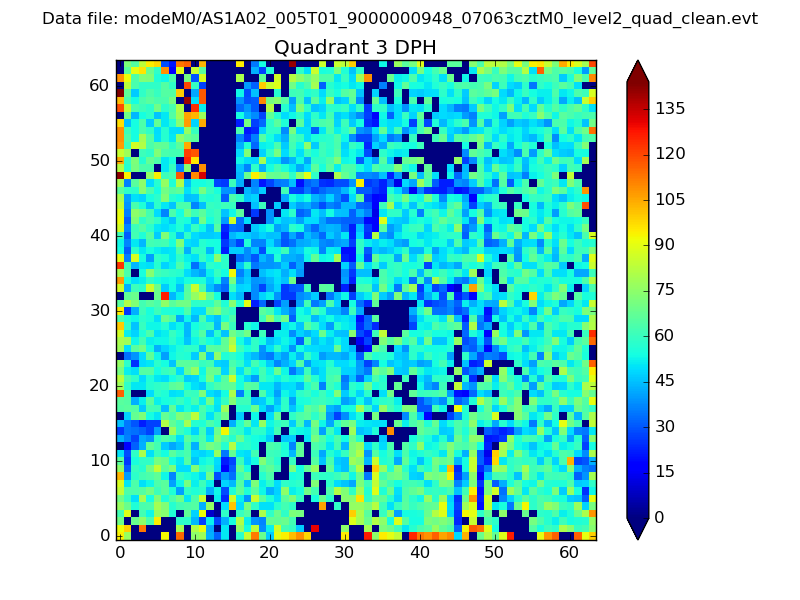 |
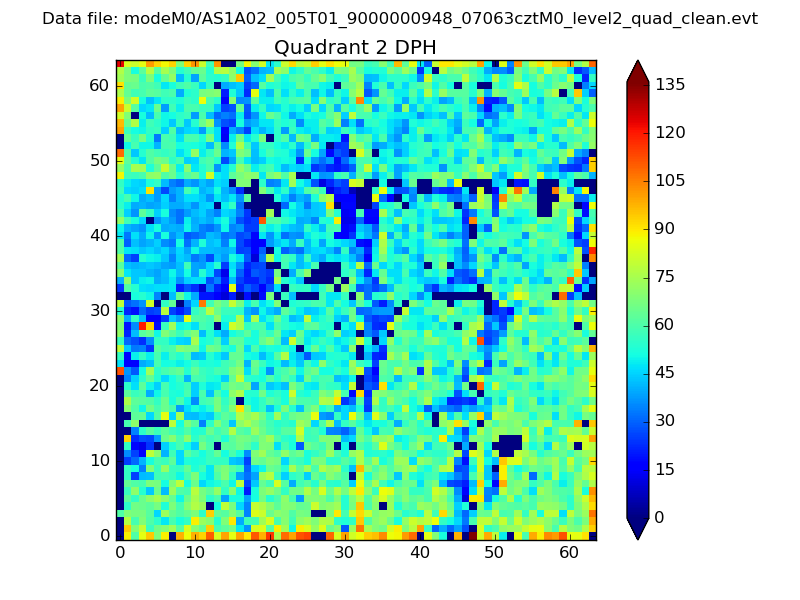 |
Quadrant C |
| Plot type | Count rate plots | Images |
|---|---|---|
| Comparison with Poisson distribution Blue bars denote a histogram of data divided into 1 sec bins. Red curve is a Poisson curve with rate = median count rate of data. |
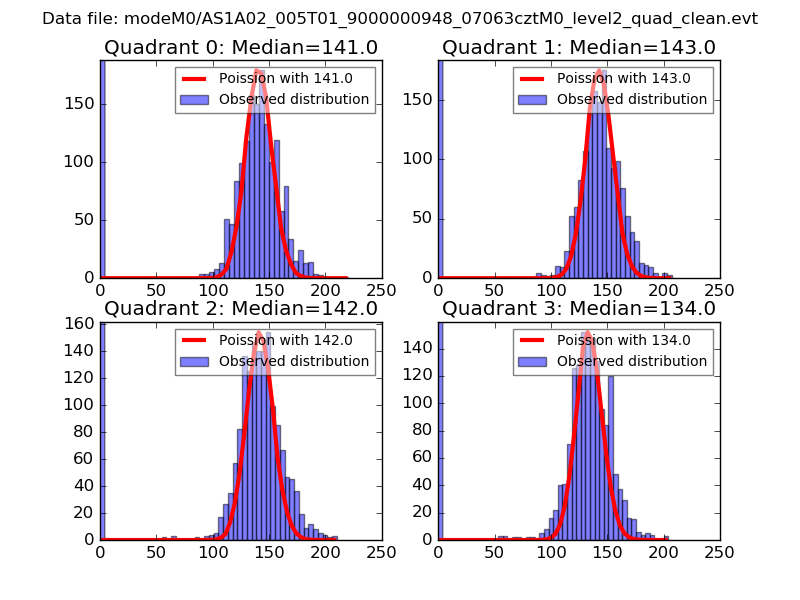 |
 |
| Quadrant-wise count rates Data is divided into 100 sec bins |
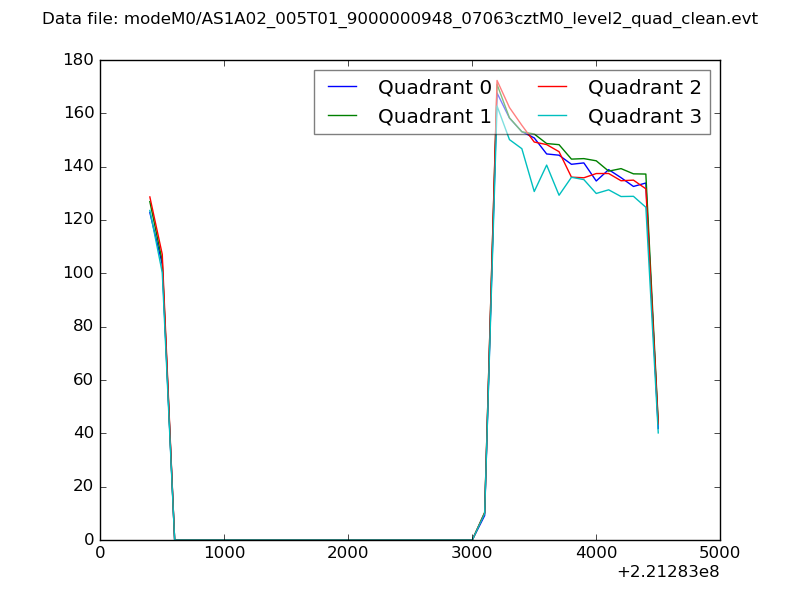 |
|
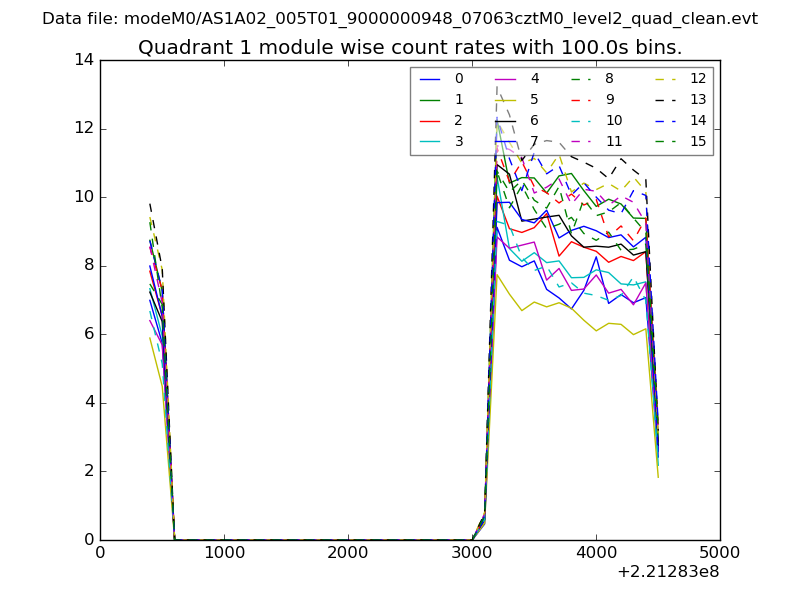
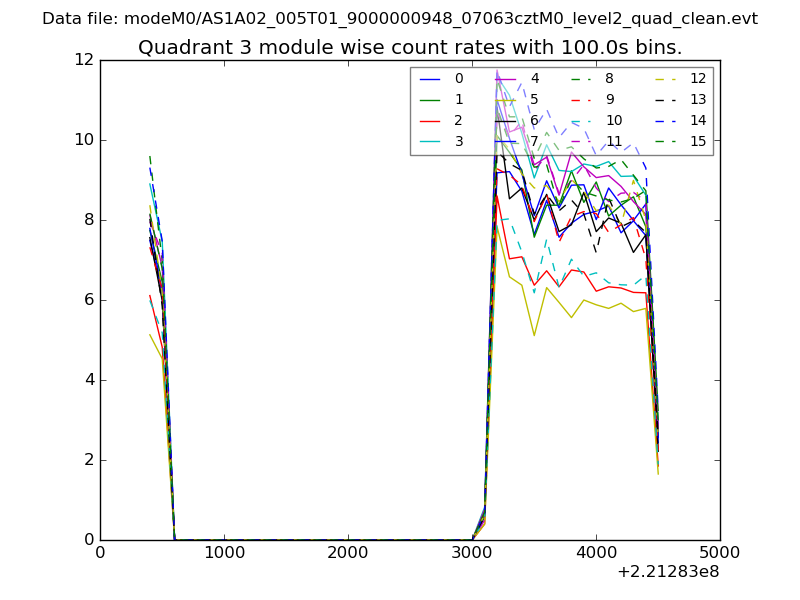
| Module-wise count rates for Quadrant A Data is divided into 100 sec bins |
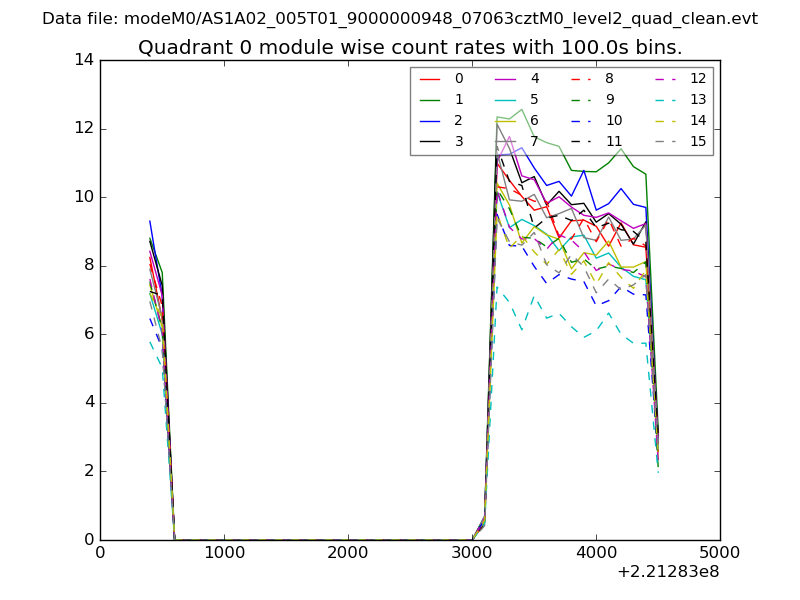 |
 |
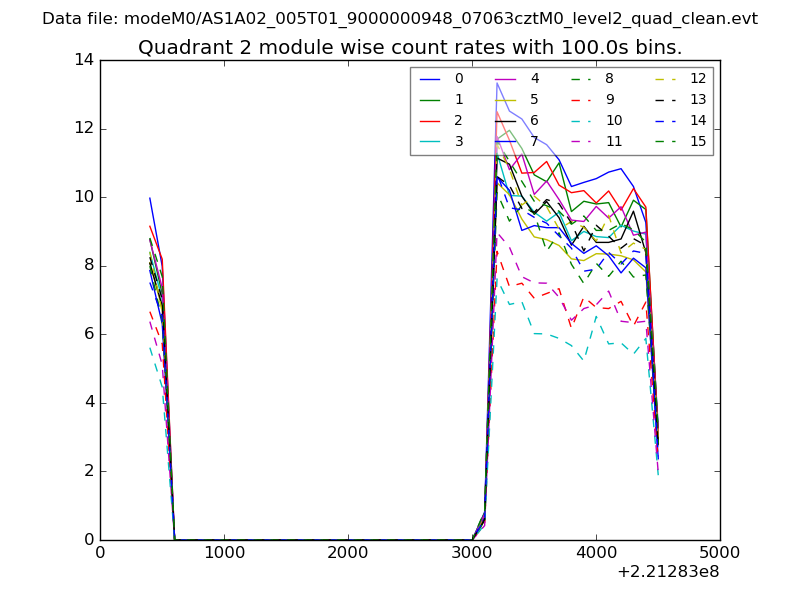
| Module-wise count rates for Quadrant B Data is divided into 100 sec bins |
 |
 |
| Module-wise count rates for Quadrant C Data is divided into 100 sec bins |
 |
 |
| Module-wise count rates for Quadrant D Data is divided into 100 sec bins |
 |
 |
| Parameter | Plot |
|---|---|
| CZT HV Monitor | 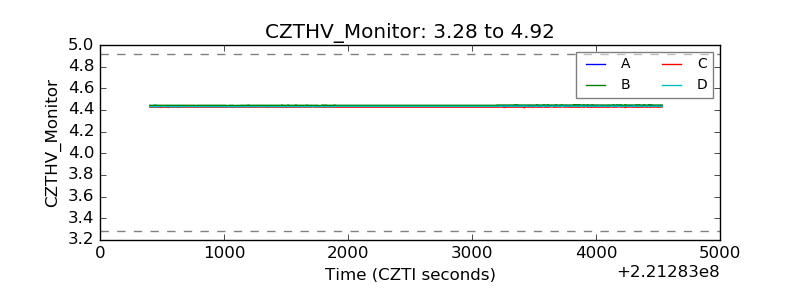 |
| D_VDD | 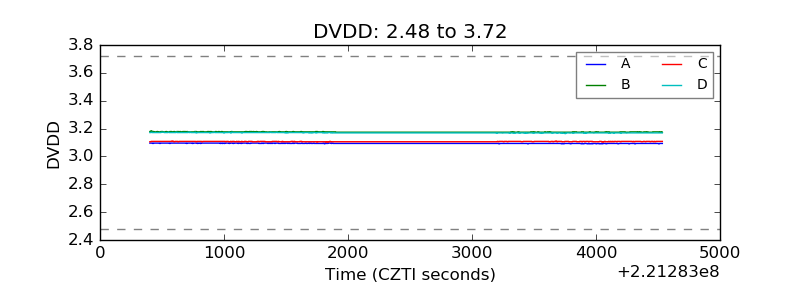 |
| Temperature 1 | 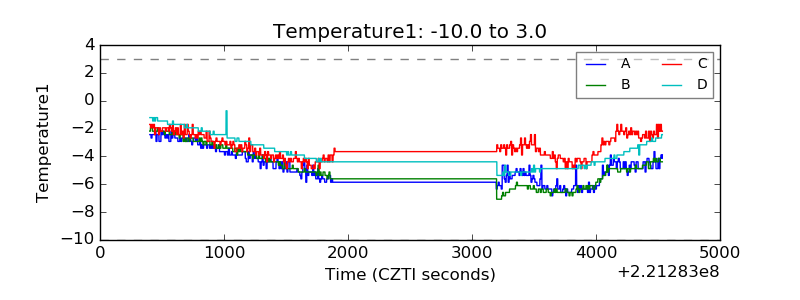 |
| Veto HV Monitor | 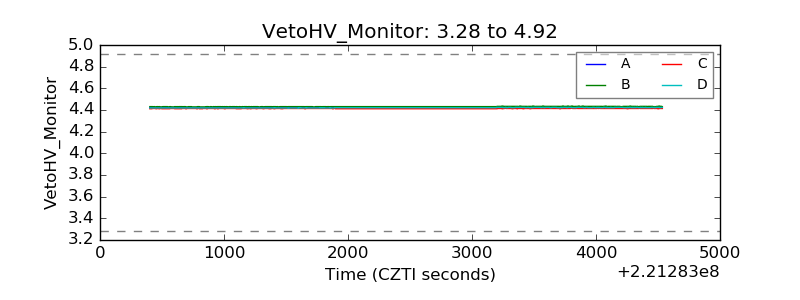 |
| Veto LLD | 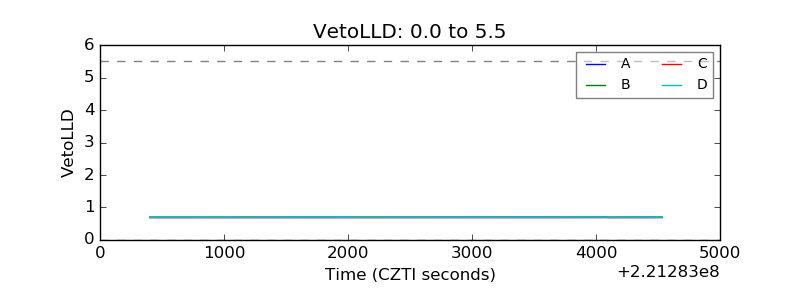 |
| Alpha Counter | 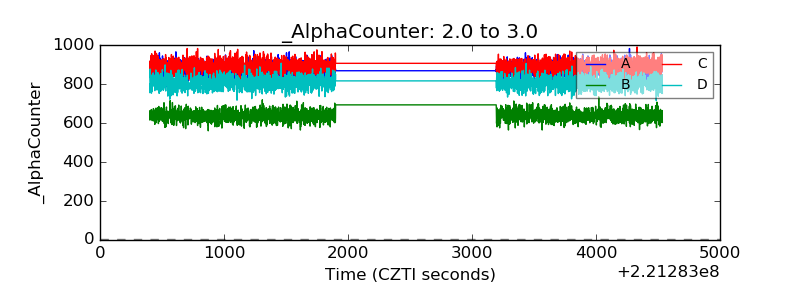 |
| _CPM_Rate | 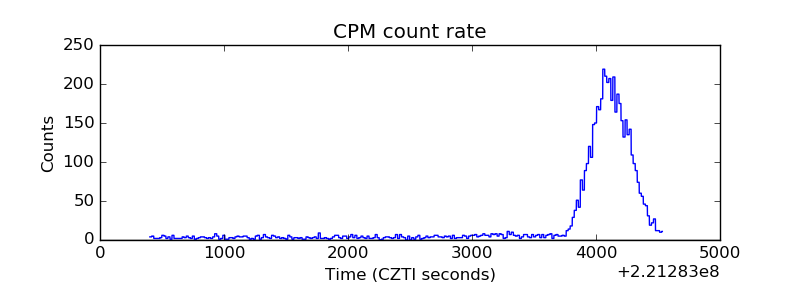 |
| CZT Counter | 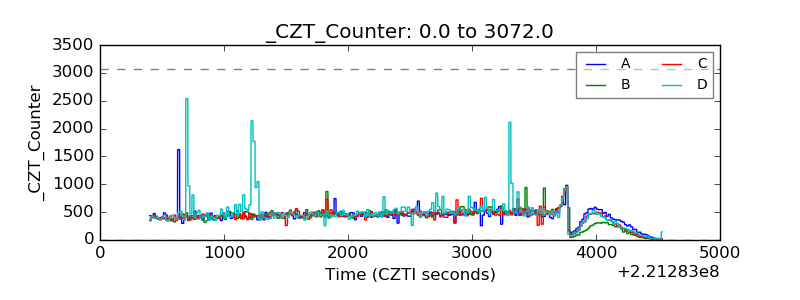 |
| +2.5 Volts monitor | 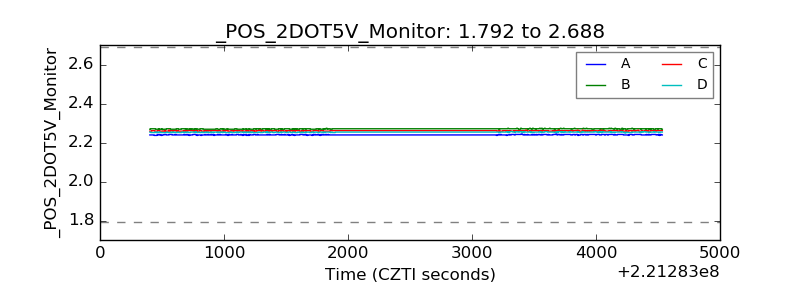 |
| +5 Volts monitor | 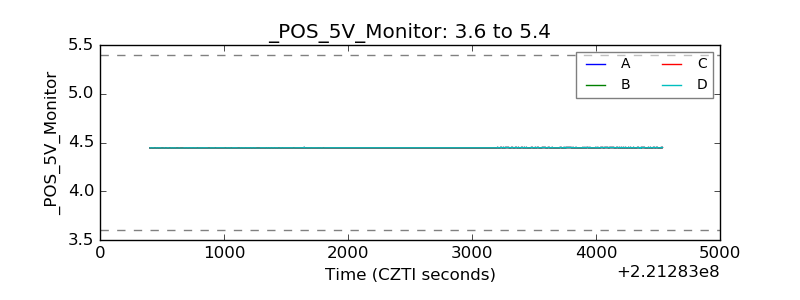 |
| _ROLL_ROT | 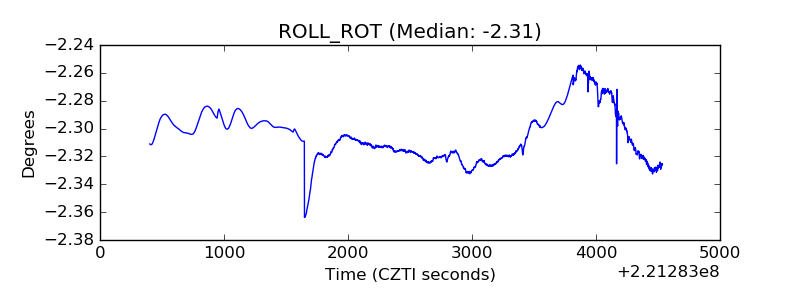 |
| _Roll_DEC | 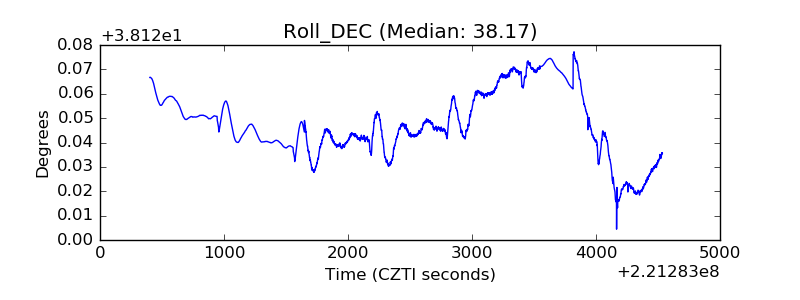 |
| _Roll_RA | 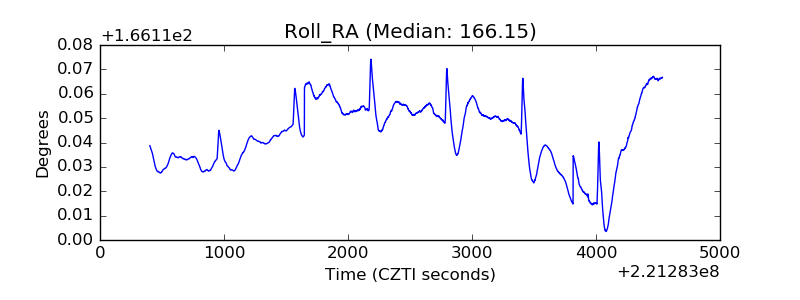 |
| Veto Counter | 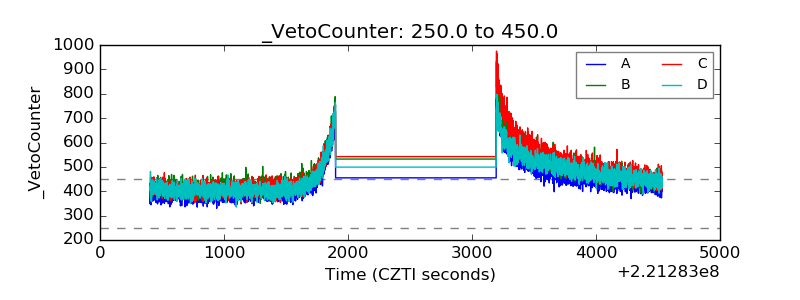 |