| Param | Original file | Final file |
|---|---|---|
| Filename | modeM0/AS1G06_164T01_9000000946cztM0_level2.fits | modeM0/AS1G06_164T01_9000000946cztM0_level2_quad_clean.evt |
| Size (bytes) | 311,927,040 | 287,703,360 |
| Size | 297.5 MB | 274.4 MB |
| Events in quadrant A | 1,885,190 | 1,687,071 |
| Events in quadrant B | 1,816,618 | 1,682,536 |
| Events in quadrant C | 1,843,558 | 1,573,280 |
| Events in quadrant D | 1,602,438 | 1,470,652 |
| Mode M0 | |||
|---|---|---|---|
| Quadrant | BADHDUFLAG | Total packets | Discarded packets |
| A | 0 | 69250 | 0 |
| B | 0 | 69455 | 0 |
| C | 0 | 69405 | 0 |
| D | 0 | 75813 | 0 |
| Mode M9 | |||
|---|---|---|---|
| Quadrant | BADHDUFLAG | Total packets | Discarded packets |
| A | 0 | 57 | 0 |
| B | 0 | 57 | 0 |
| C | 0 | 57 | 0 |
| D | 0 | 57 | 0 |
| Mode SS | |||
|---|---|---|---|
| Quadrant | BADHDUFLAG | Total packets | Discarded packets |
| A | 0 | 678 | 0 |
| B | 0 | 678 | 0 |
| C | 0 | 678 | 0 |
| D | 0 | 678 | 0 |
| Quadrant | Total seconds | Saturated seconds | Saturation percentage |
|---|---|---|---|
| A | 33471 | 499 | 1.490843% |
| B | 33471 | 510 | 1.523707% |
| C | 33468 | 383 | 1.144377% |
| D | 33472 | 527 | 1.574450% |
Noise dominated data is calculated using 1-second bins in cleaned event files. If a bin has >2000 counts, and if more than 50% of those come from <1% of pixels, then it is considered to be noise-dominated and hence unusable.
| Quadrant | # 1 sec bins | Bins with >0 counts | Bins with >2000 counts | High rate bins dominated by noise | Noise dominated (total time) | Noise dominated (detector-on time) | Marked lightcurve |
|---|---|---|---|---|---|---|---|
| A | 39033 | 33471 | 0 | 0 | 0.00% | 0.00% | 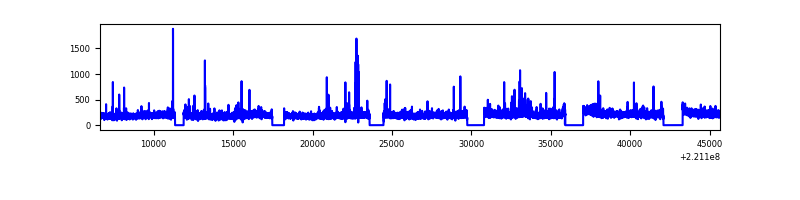 |
| B | 39033 | 33470 | 0 | 0 | 0.00% | 0.00% |  |
| C | 39033 | 33473 | 0 | 0 | 0.00% | 0.00% | 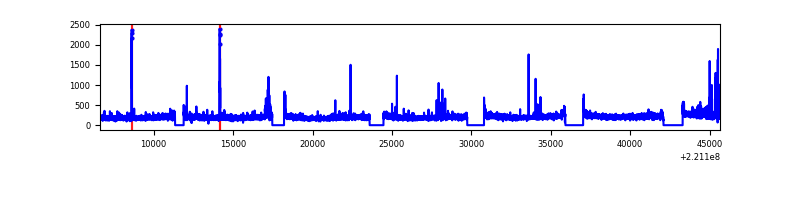 |
| D | 39033 | 33471 | 0 | 0 | 0.00% | 0.00% |  |
Top three noisy pixels from each quadrant. If the there are fewer than three noisy pixels in the level2.evt file, extra rows are filled as -1
| Pixel properties | Quadrant properties | ||||||
|---|---|---|---|---|---|---|---|
| Quadrant | DetID | PixID | Counts | Sigma | Mean | Median | Sigma |
| A | 0 | 29 | 1795 | 10.68 | 489 | 458 | 125.2 |
| A | 7 | 110 | 1590 | 9.04 | 489 | 458 | 125.2 |
| A | 0 | 30 | 1395 | 7.49 | 489 | 458 | 125.2 |
| B | 2 | 9 | 1538 | 11.07 | 479 | 456 | 97.7 |
| B | 14 | 254 | 1332 | 8.96 | 479 | 456 | 97.7 |
| B | 12 | 226 | 1257 | 8.19 | 479 | 456 | 97.7 |
| C | 12 | 241 | 1309 | 6.71 | 487 | 452 | 127.7 |
| C | 2 | 191 | 1278 | 6.47 | 487 | 452 | 127.7 |
| C | 15 | 65 | 1231 | 6.1 | 487 | 452 | 127.7 |
| D | 6 | 231 | 1180 | 6.23 | 457 | 416 | 122.6 |
| D | 3 | 14 | 1168 | 6.13 | 457 | 416 | 122.6 |
| D | 7 | 5 | 1144 | 5.94 | 457 | 416 | 122.6 |
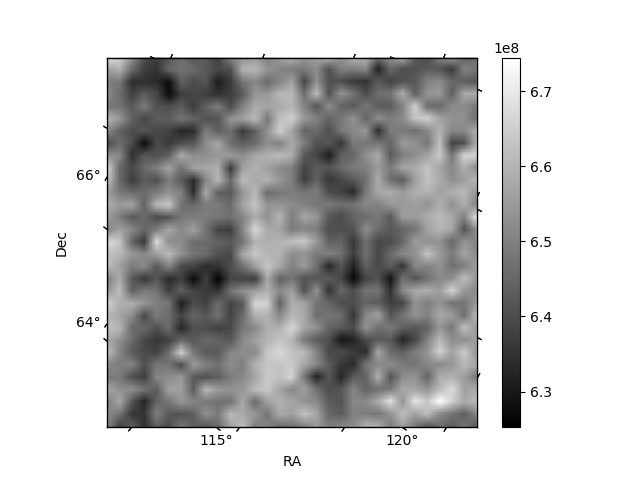
Histogram calculated using DETX and DETY for each event in the final _common_clean file
| Quadrant A | 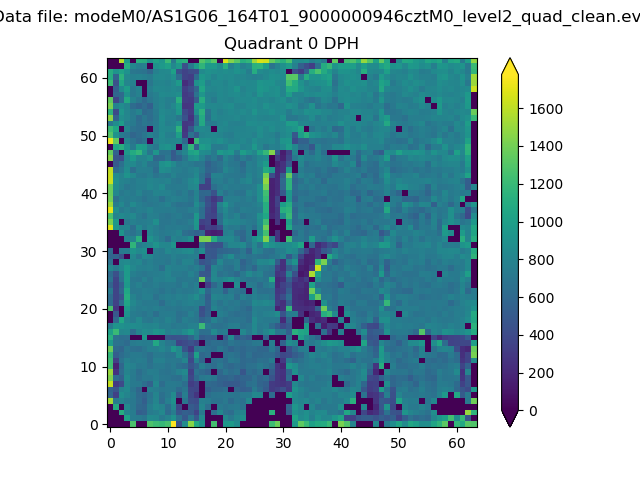 |
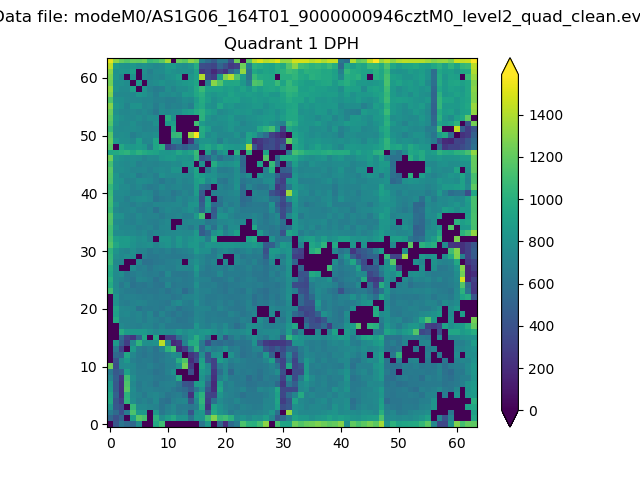 |
Quadrant B |
|---|---|---|---|
| Quadrant D |  |
 |
Quadrant C |
| Plot type | Count rate plots | Images |
|---|---|---|
| Comparison with Poisson distribution Blue bars denote a histogram of data divided into 1 sec bins. Red curve is a Poisson curve with rate = median count rate of data. |
 |
 |
| Quadrant-wise count rates Data is divided into 100 sec bins |
 |
|
| Module-wise count rates for Quadrant A Data is divided into 100 sec bins |
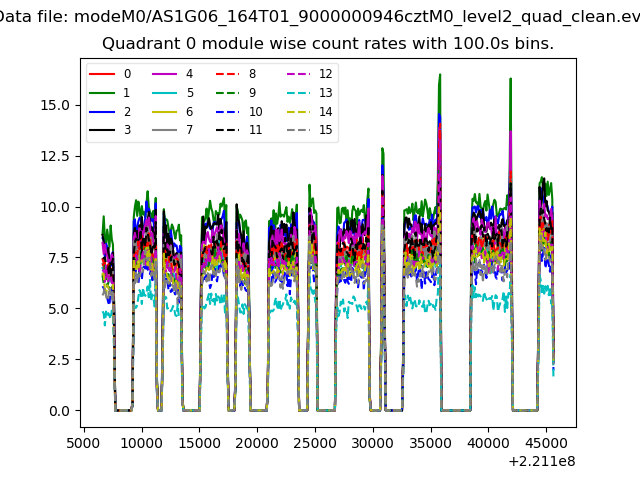 |
 |
| Module-wise count rates for Quadrant B Data is divided into 100 sec bins |
 |
 |
| Module-wise count rates for Quadrant C Data is divided into 100 sec bins |
 |
 |
| Module-wise count rates for Quadrant D Data is divided into 100 sec bins |
 |
 |
| Parameter | Plot |
|---|---|
| CZT HV Monitor |  |
| D_VDD | 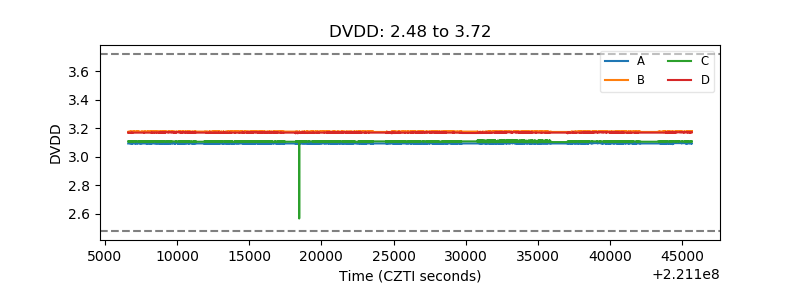 |
| Temperature 1 | 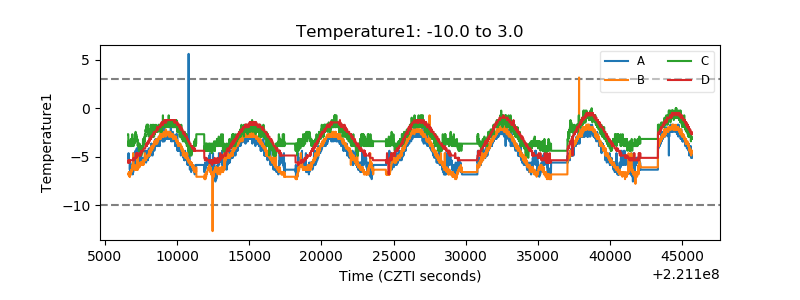 |
| Veto HV Monitor |  |
| Veto LLD | 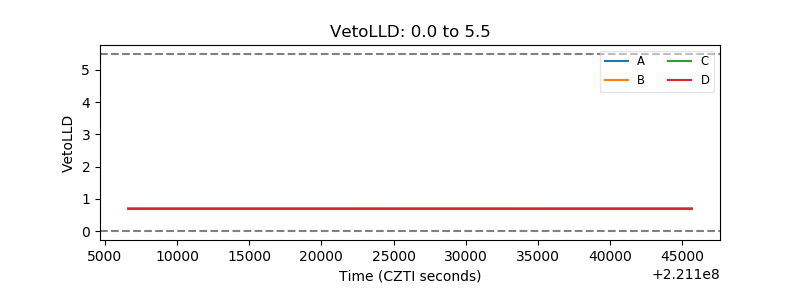 |
| Alpha Counter |  |
| _CPM_Rate |  |
| CZT Counter | 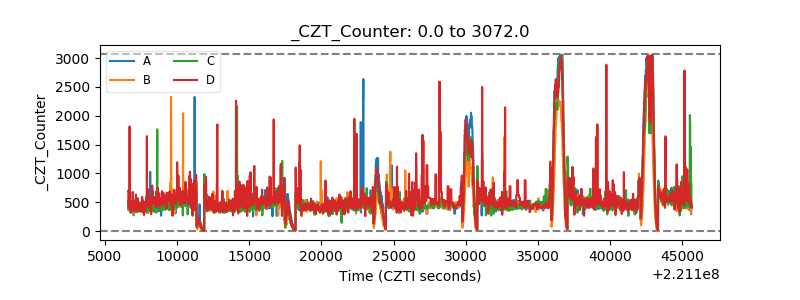 |
| +2.5 Volts monitor |  |
| +5 Volts monitor |  |
| _ROLL_ROT | 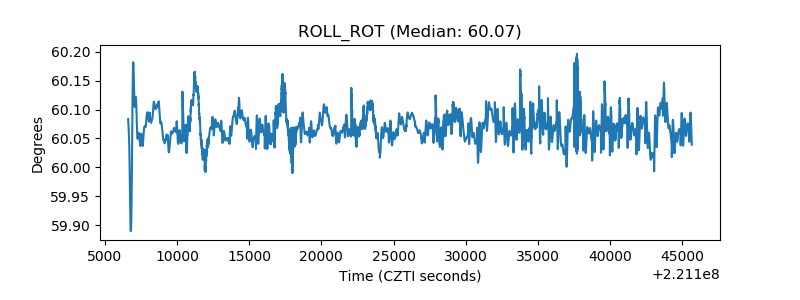 |
| _Roll_DEC |  |
| _Roll_RA |  |
| Veto Counter |  |