| Param | Original file | Final file |
|---|---|---|
| Filename | modeM0/AS1G06_164T01_9000000946_06852cztM0_level2.evt | modeM0/AS1G06_164T01_9000000946_06852cztM0_level2_quad_clean.evt |
| Size (bytes) | 33,920,640 | 10,054,080 |
| Size | 32.3 MB | 9.6 MB |
| Events in quadrant A | 228,526 | 63,440 |
| Events in quadrant B | 242,382 | 64,016 |
| Events in quadrant C | 231,277 | 65,548 |
| Events in quadrant D | 281,695 | 62,272 |
| Mode M0 | |||
|---|---|---|---|
| Quadrant | BADHDUFLAG | Total packets | Discarded packets |
| A | 0 | 1168 | 1 |
| B | 0 | 1193 | 0 |
| C | 0 | 1167 | 0 |
| D | 0 | 1238 | 0 |
| Mode SS | |||
|---|---|---|---|
| Quadrant | BADHDUFLAG | Total packets | Discarded packets |
| A | 0 | 12 | 0 |
| B | 0 | 12 | 0 |
| C | 0 | 12 | 0 |
| D | 0 | 12 | 0 |
| Quadrant | Total seconds | Saturated seconds | Saturation percentage |
|---|---|---|---|
| A | 583 | 0 | 0.000000% |
| B | 583 | 1 | 0.171527% |
| C | 583 | 0 | 0.000000% |
| D | 583 | 2 | 0.343053% |
Noise dominated data is calculated using 1-second bins in cleaned event files. If a bin has >2000 counts, and if more than 50% of those come from <1% of pixels, then it is considered to be noise-dominated and hence unusable.
| Quadrant | # 1 sec bins | Bins with >0 counts | Bins with >2000 counts | High rate bins dominated by noise | Noise dominated (total time) | Noise dominated (detector-on time) | Marked lightcurve |
|---|---|---|---|---|---|---|---|
| A | 583 | 583 | 0 | 0 | 0.00% | 0.00% | 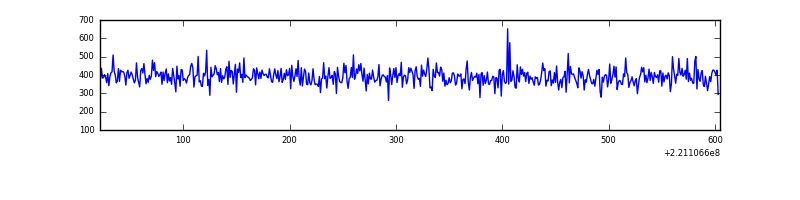 |
| B | 583 | 583 | 1 | 1 | 0.17% | 0.17% | 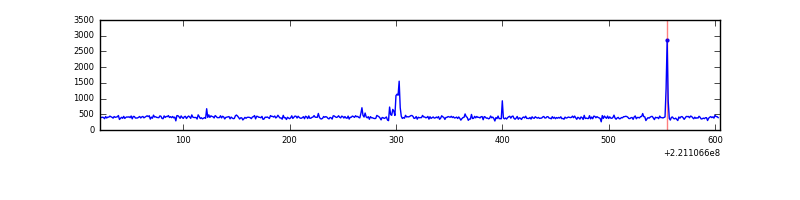 |
| C | 583 | 583 | 0 | 0 | 0.00% | 0.00% | 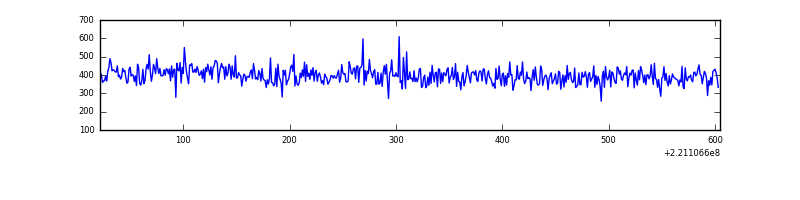 |
| D | 583 | 583 | 2 | 2 | 0.34% | 0.34% | 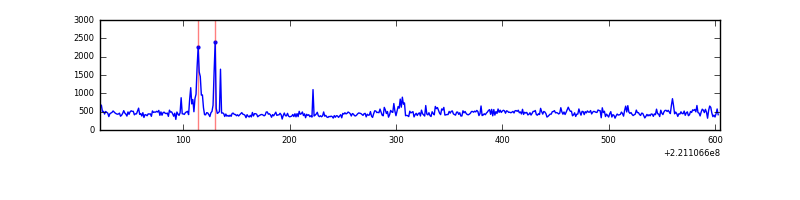 |
Top three noisy pixels from each quadrant. If the there are fewer than three noisy pixels in the level2.evt file, extra rows are filled as -1
| Pixel properties | Quadrant properties | ||||||
|---|---|---|---|---|---|---|---|
| Quadrant | DetID | PixID | Counts | Sigma | Mean | Median | Sigma |
| A | 4 | 2 | 672 | 43.37 | 58 | 57 | 14.2 |
| A | 12 | 194 | 517 | 32.44 | 58 | 57 | 14.2 |
| A | 0 | 226 | 517 | 32.44 | 58 | 57 | 14.2 |
| B | 4 | 48 | 5553 | 397.58 | 59 | 58 | 13.8 |
| B | 0 | 219 | 4857 | 347.22 | 59 | 58 | 13.8 |
| B | 12 | 111 | 1255 | 86.61 | 59 | 58 | 13.8 |
| C | 9 | 247 | 4505 | 286.9 | 58 | 58 | 15.5 |
| C | 14 | 67 | 446 | 25.03 | 58 | 58 | 15.5 |
| C | 13 | 61 | 419 | 23.29 | 58 | 58 | 15.5 |
| D | 8 | 195 | 36155 | 2312.98 | 56 | 54 | 15.6 |
| D | 2 | 152 | 17143 | 1094.89 | 56 | 54 | 15.6 |
| D | 2 | 136 | 13092 | 835.34 | 56 | 54 | 15.6 |
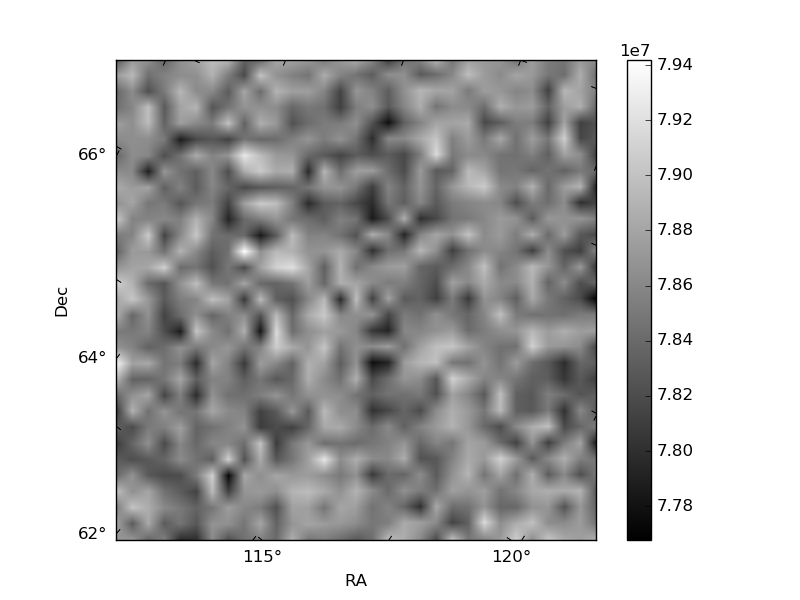
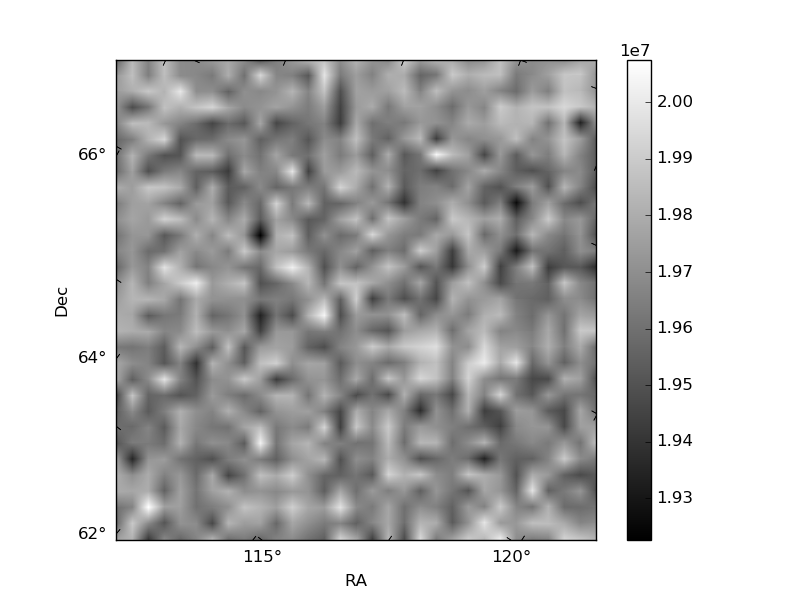
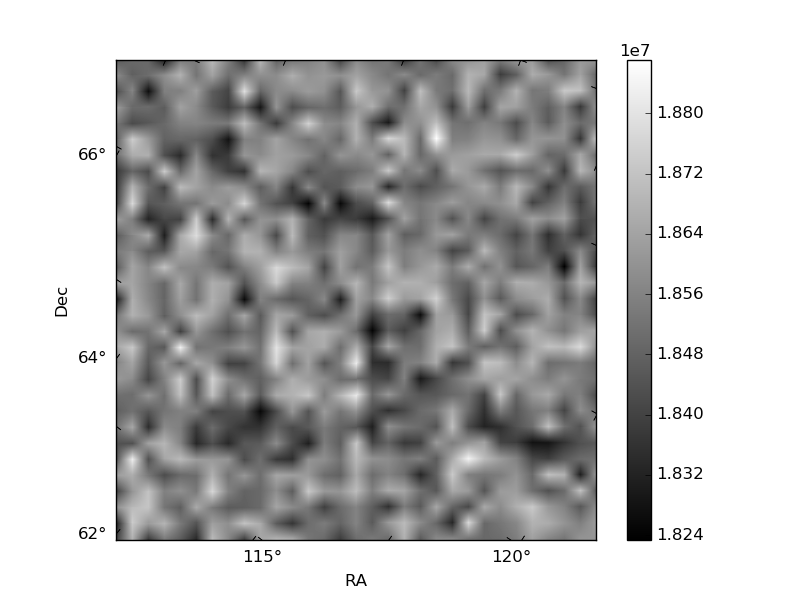
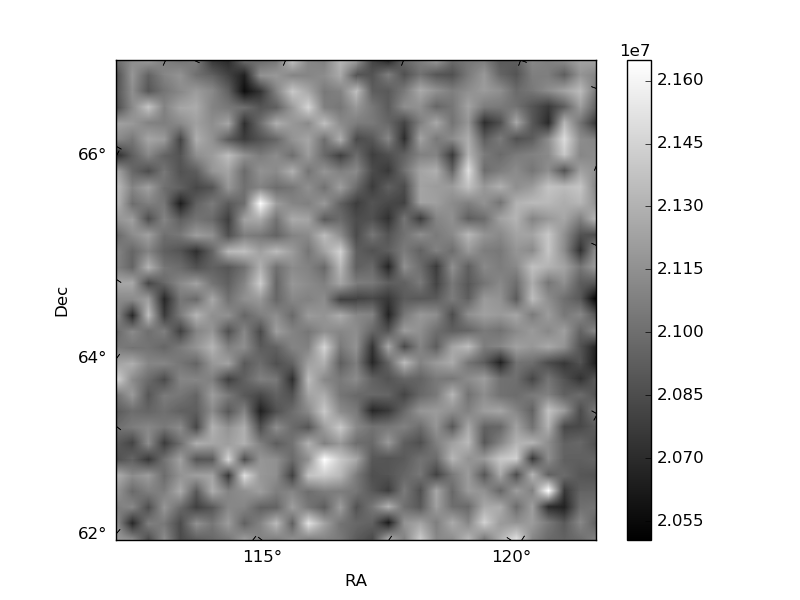
Histogram calculated using DETX and DETY for each event in the final _common_clean file
| Quadrant A | 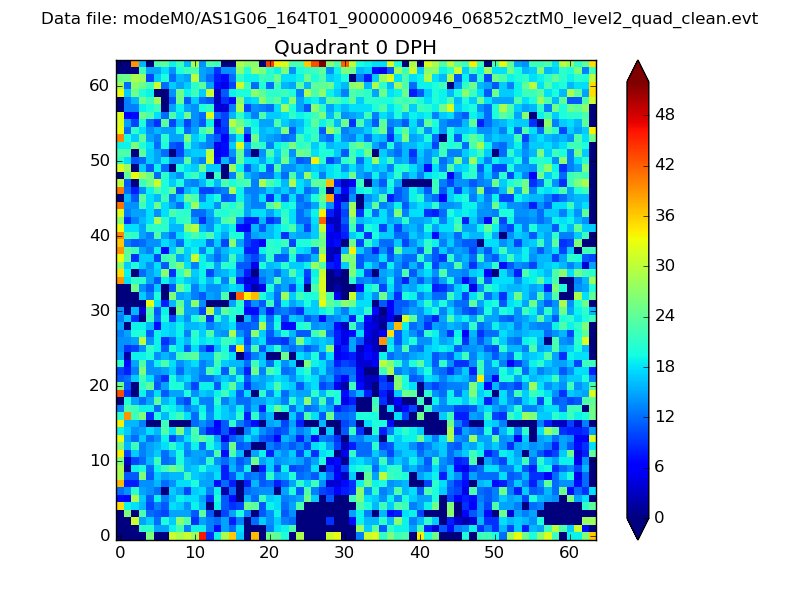 |
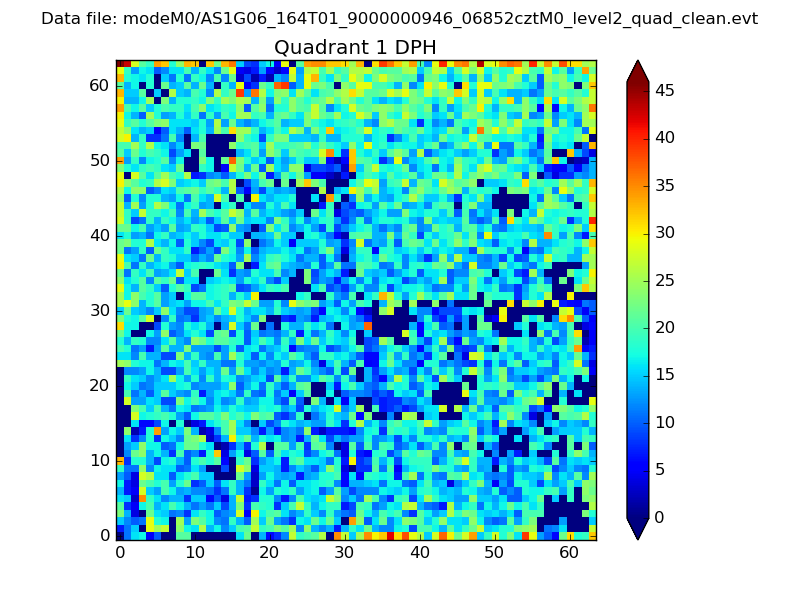 |
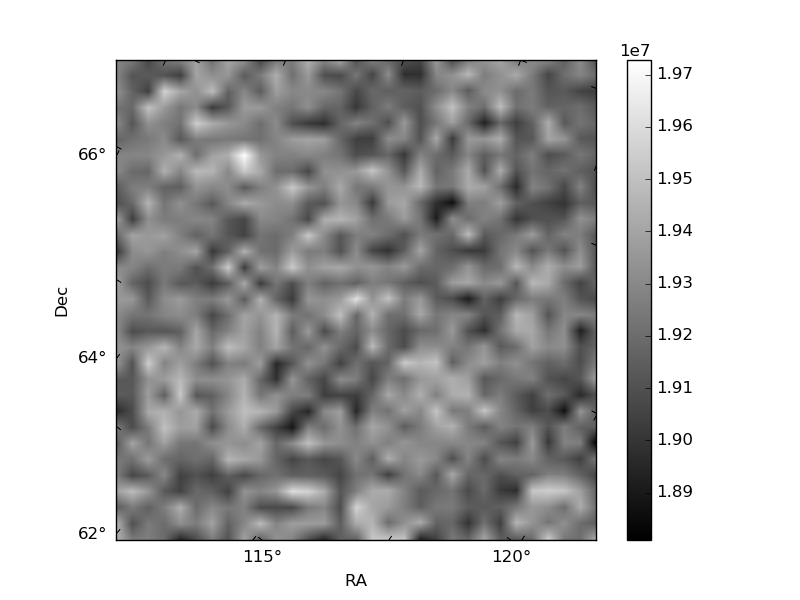
Quadrant B |
|---|---|---|---|
| Quadrant D | 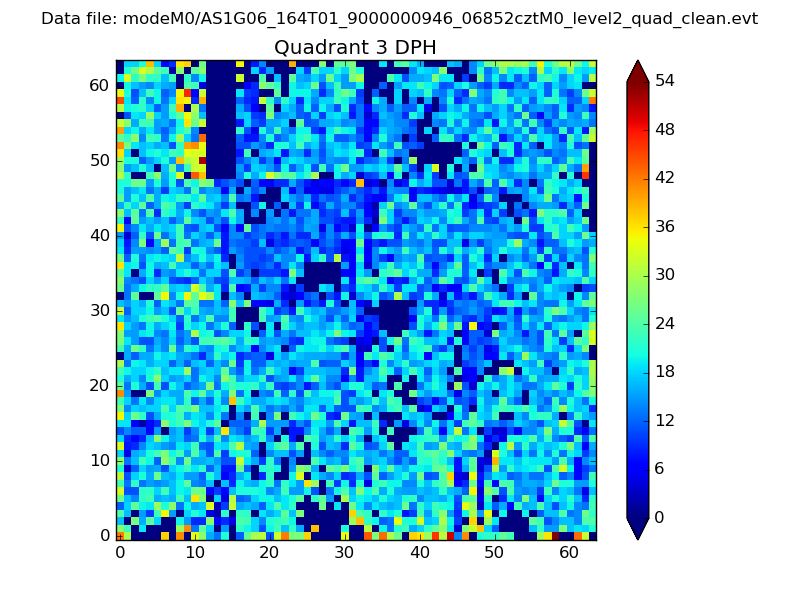 |
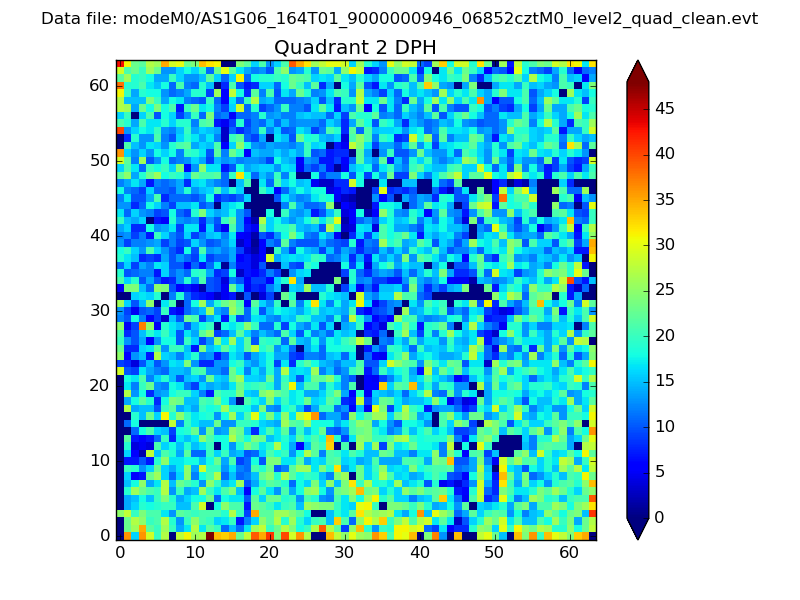 |
Quadrant C |
| Plot type | Count rate plots | Images |
|---|---|---|
| Comparison with Poisson distribution Blue bars denote a histogram of data divided into 1 sec bins. Red curve is a Poisson curve with rate = median count rate of data. |
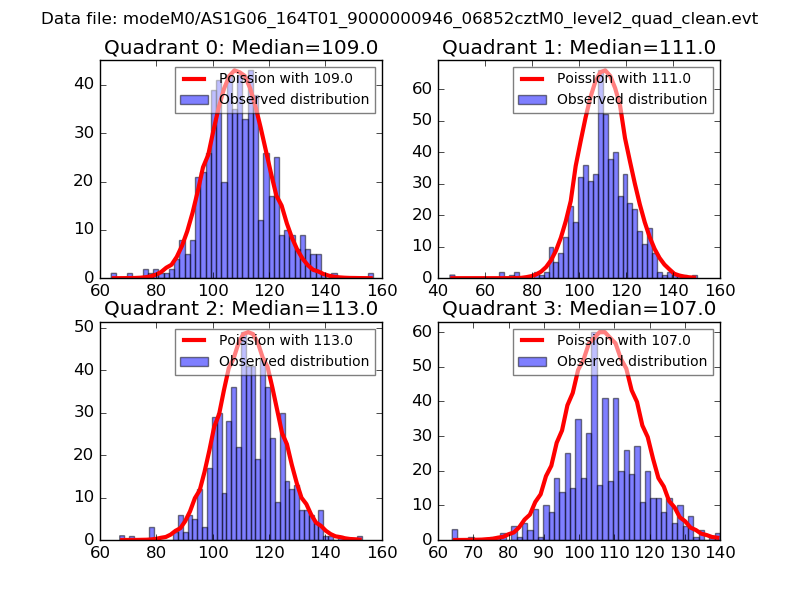 |
 |
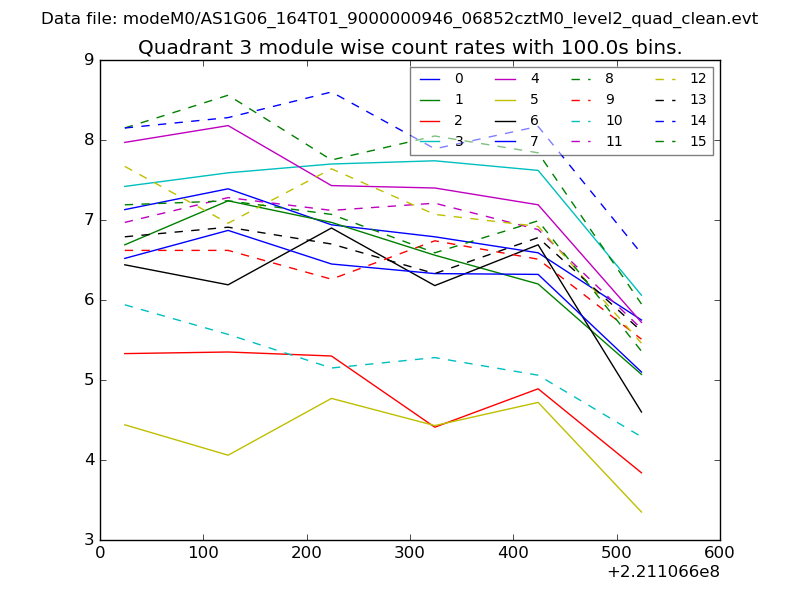
| Quadrant-wise count rates Data is divided into 100 sec bins |
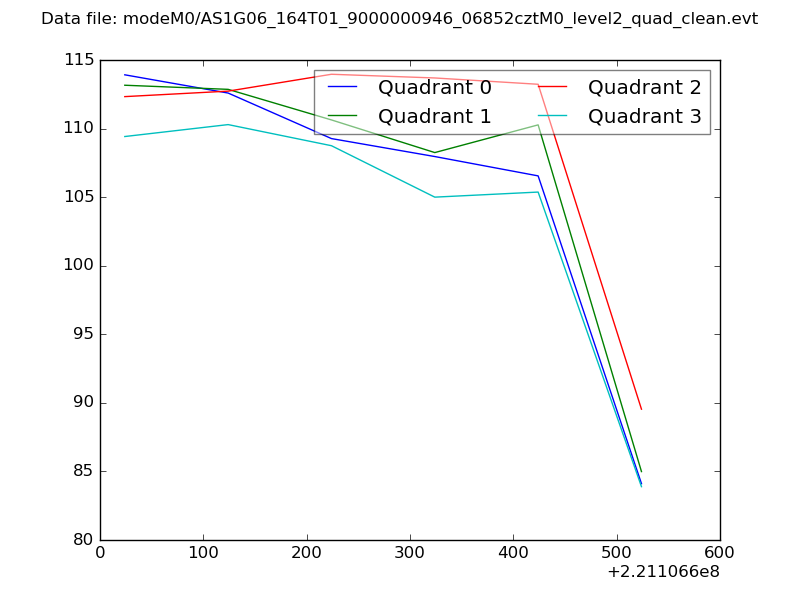 |
|
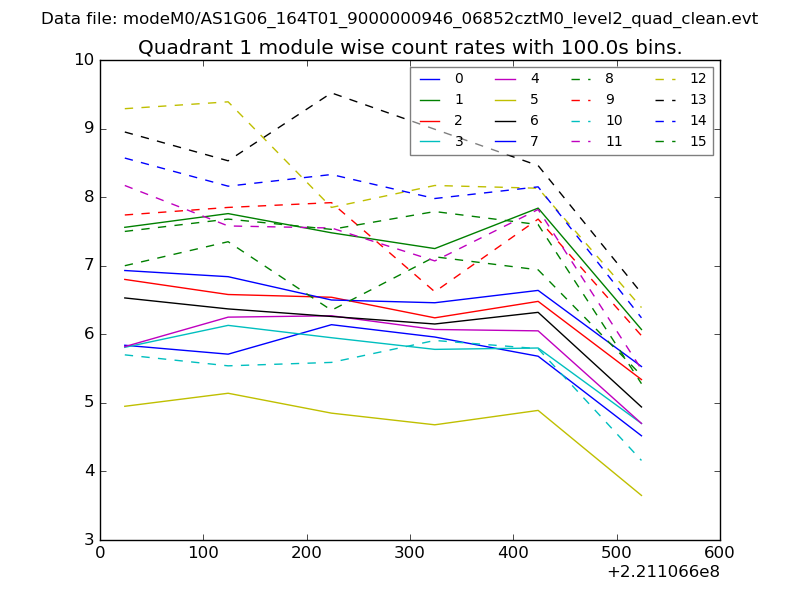
| Module-wise count rates for Quadrant A Data is divided into 100 sec bins |
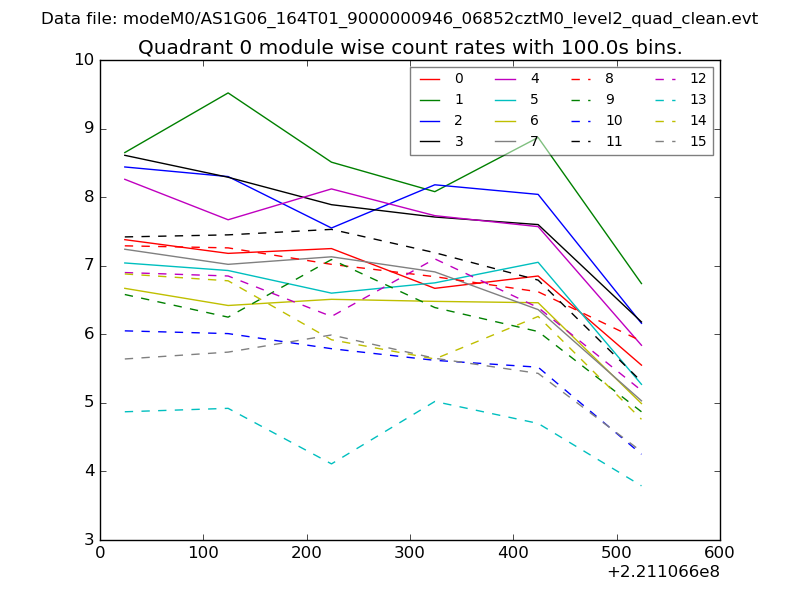 |
 |
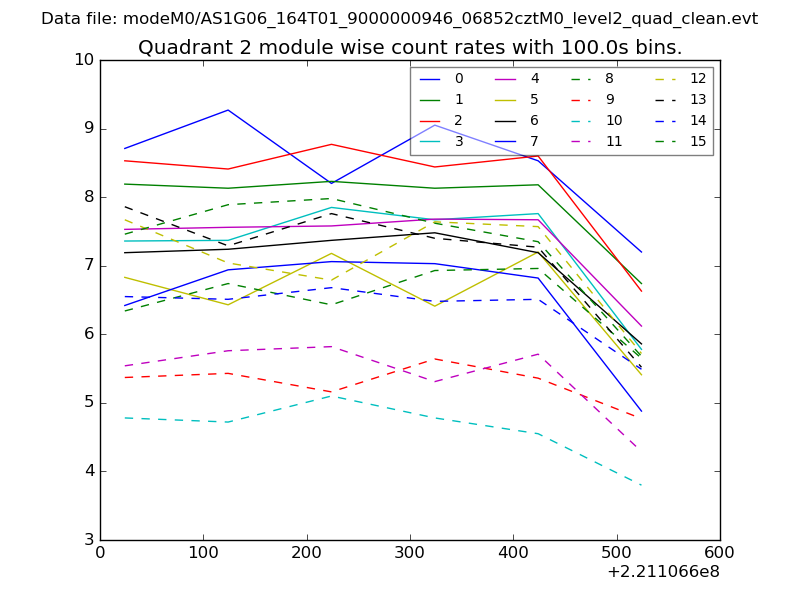
| Module-wise count rates for Quadrant B Data is divided into 100 sec bins |
 |
 |
| Module-wise count rates for Quadrant C Data is divided into 100 sec bins |
 |
 |
| Module-wise count rates for Quadrant D Data is divided into 100 sec bins |
 |
 |
| Parameter | Plot |
|---|---|
| CZT HV Monitor | 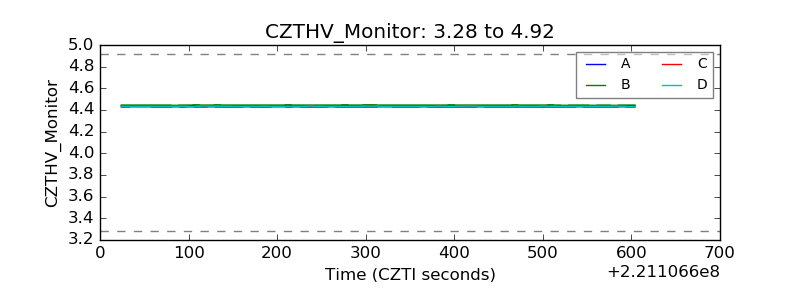 |
| D_VDD | 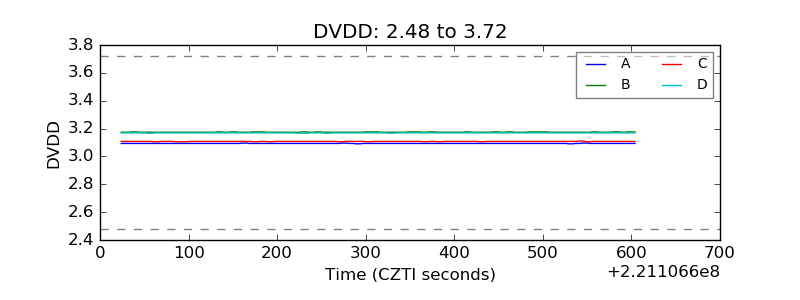 |
| Temperature 1 | 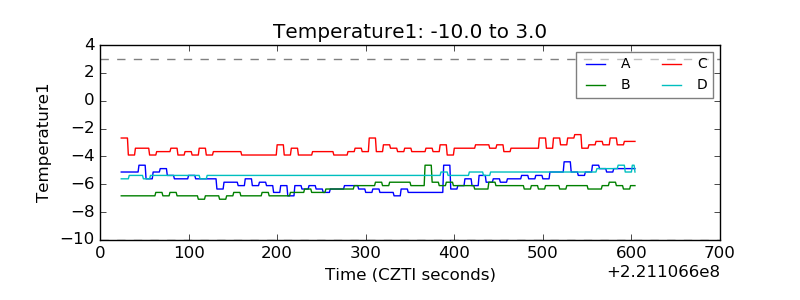 |
| Veto HV Monitor | 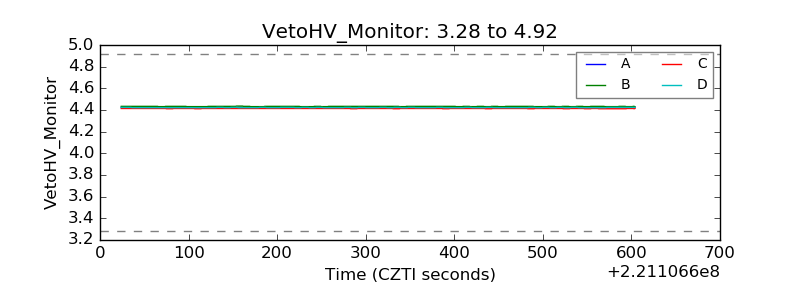 |
| Veto LLD | 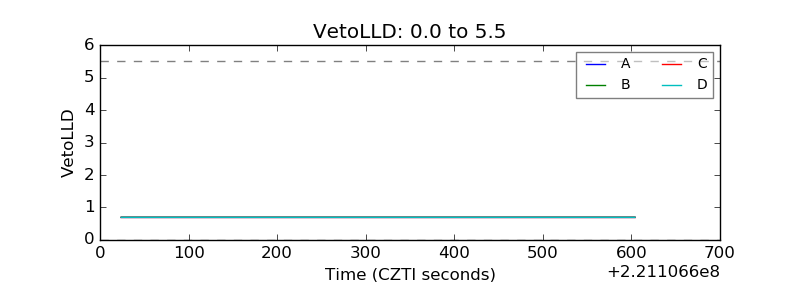 |
| Alpha Counter | 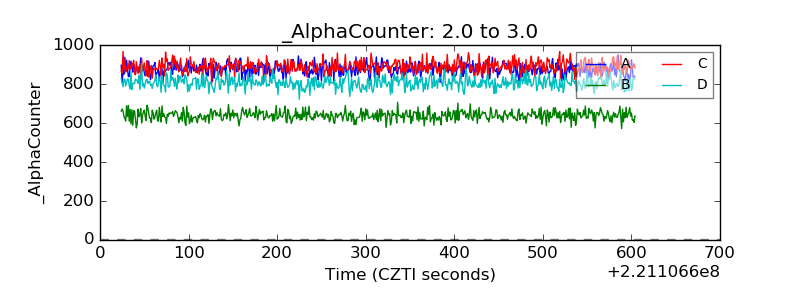 |
| _CPM_Rate | 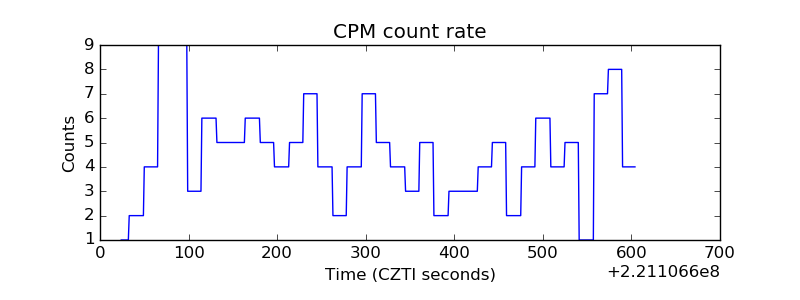 |
| CZT Counter | 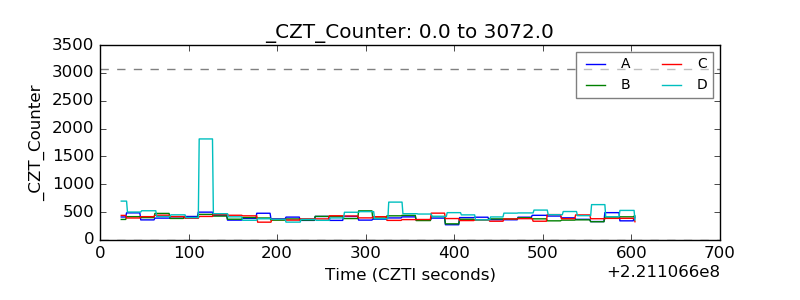 |
| +2.5 Volts monitor |  |
| +5 Volts monitor | 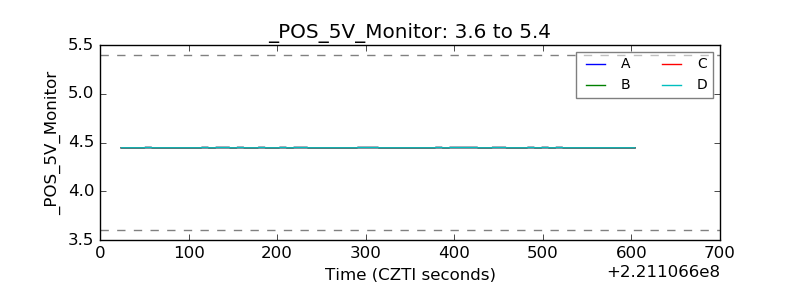 |
| _ROLL_ROT | 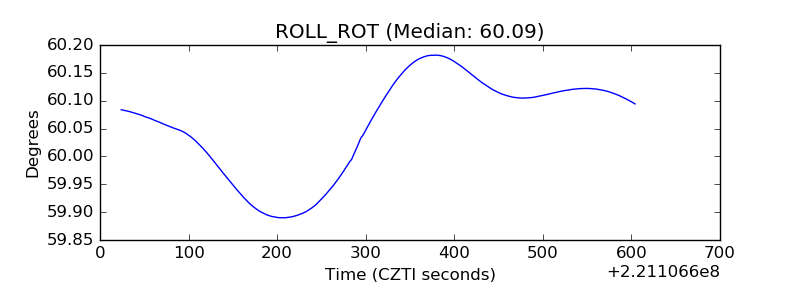 |
| _Roll_DEC | 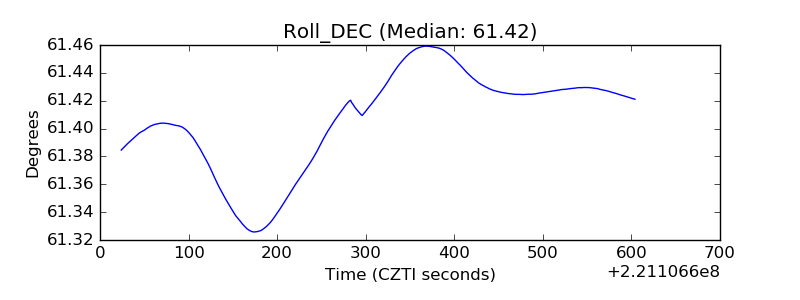 |
| _Roll_RA | 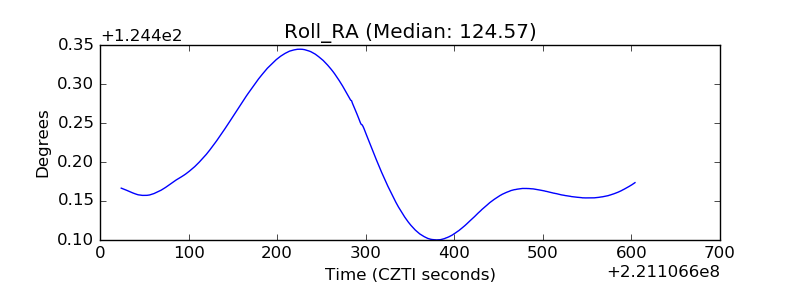 |
| Veto Counter | 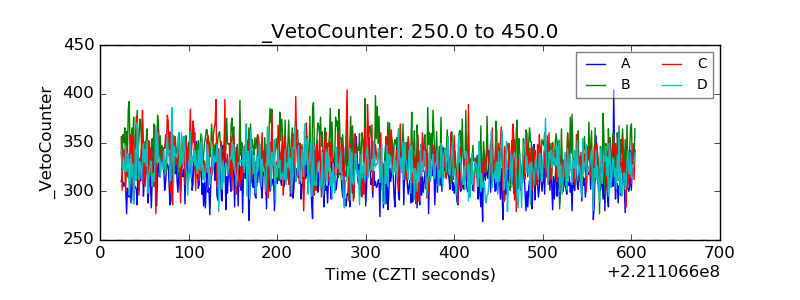 |