| Param | Original file | Final file |
|---|---|---|
| Filename | modeM0/AS1G06_164T01_9000000946_06854cztM0_level2.evt | modeM0/AS1G06_164T01_9000000946_06854cztM0_level2_quad_clean.evt |
| Size (bytes) | 760,242,240 | 154,425,600 |
| Size | 725.0 MB | 147.3 MB |
| Events in quadrant A | 5,226,657 | 973,866 |
| Events in quadrant B | 5,375,857 | 986,967 |
| Events in quadrant C | 5,275,173 | 969,382 |
| Events in quadrant D | 6,348,351 | 932,587 |
| Mode M0 | |||
|---|---|---|---|
| Quadrant | BADHDUFLAG | Total packets | Discarded packets |
| A | 0 | 23879 | 7 |
| B | 0 | 24153 | 5 |
| C | 0 | 24180 | 12 |
| D | 0 | 26700 | 4 |
| Mode M9 | |||
|---|---|---|---|
| Quadrant | BADHDUFLAG | Total packets | Discarded packets |
| A | 0 | 13 | 0 |
| B | 0 | 13 | 0 |
| C | 0 | 13 | 0 |
| D | 0 | 13 | 0 |
| Mode SS | |||
|---|---|---|---|
| Quadrant | BADHDUFLAG | Total packets | Discarded packets |
| A | 0 | 238 | 0 |
| B | 0 | 238 | 0 |
| C | 0 | 238 | 0 |
| D | 0 | 238 | 0 |
| Quadrant | Total seconds | Saturated seconds | Saturation percentage |
|---|---|---|---|
| A | 11776 | 106 | 0.900136% |
| B | 11777 | 124 | 1.052900% |
| C | 11773 | 67 | 0.569099% |
| D | 11777 | 120 | 1.018935% |
Noise dominated data is calculated using 1-second bins in cleaned event files. If a bin has >2000 counts, and if more than 50% of those come from <1% of pixels, then it is considered to be noise-dominated and hence unusable.
| Quadrant | # 1 sec bins | Bins with >0 counts | Bins with >2000 counts | High rate bins dominated by noise | Noise dominated (total time) | Noise dominated (detector-on time) | Marked lightcurve |
|---|---|---|---|---|---|---|---|
| A | 13068 | 11780 | 4 | 4 | 0.03% | 0.03% | 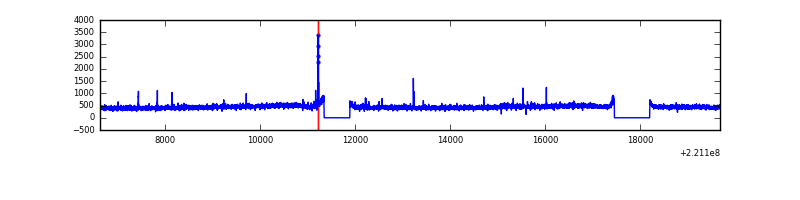 |
| B | 13068 | 11780 | 17 | 17 | 0.13% | 0.14% | 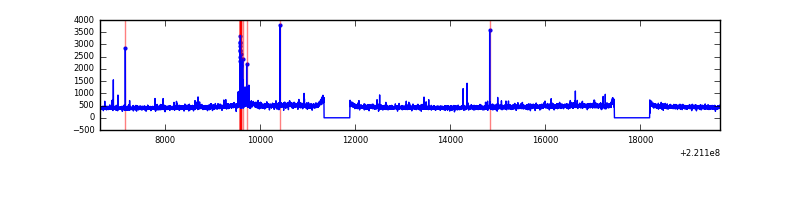 |
| C | 13068 | 11780 | 9 | 9 | 0.07% | 0.08% | 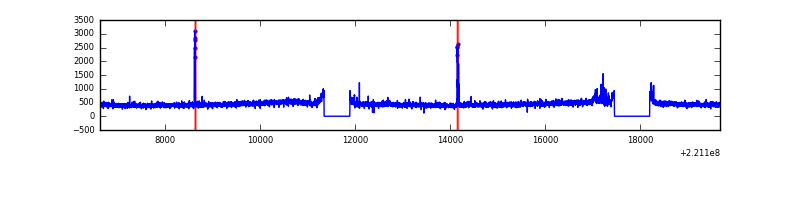 |
| D | 13068 | 11780 | 45 | 45 | 0.34% | 0.38% | 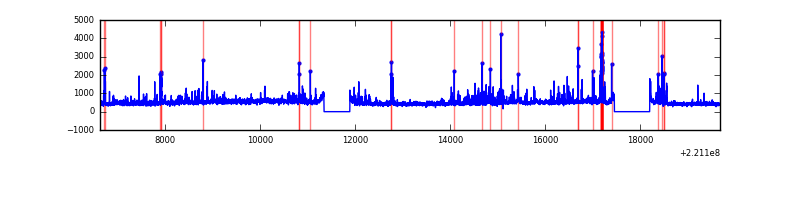 |
Top three noisy pixels from each quadrant. If the there are fewer than three noisy pixels in the level2.evt file, extra rows are filled as -1
| Pixel properties | Quadrant properties | ||||||
|---|---|---|---|---|---|---|---|
| Quadrant | DetID | PixID | Counts | Sigma | Mean | Median | Sigma |
| A | 13 | 248 | 40470 | 143.17 | 1335 | 1305 | 273.6 |
| A | 13 | 251 | 37279 | 131.51 | 1335 | 1305 | 273.6 |
| A | 12 | 194 | 12593 | 41.26 | 1335 | 1305 | 273.6 |
| B | 0 | 228 | 72740 | 277.36 | 1344 | 1310 | 257.5 |
| B | 4 | 81 | 31434 | 116.97 | 1344 | 1310 | 257.5 |
| B | 12 | 111 | 26919 | 99.44 | 1344 | 1310 | 257.5 |
| C | 9 | 247 | 165774 | 550.81 | 1293 | 1295 | 298.6 |
| C | 1 | 3 | 38391 | 124.23 | 1293 | 1295 | 298.6 |
| C | 12 | 4 | 13423 | 40.61 | 1293 | 1295 | 298.6 |
| D | 8 | 195 | 624389 | 1979.77 | 1293 | 1253 | 314.8 |
| D | 2 | 152 | 383128 | 1213.25 | 1293 | 1253 | 314.8 |
| D | 14 | 34 | 176905 | 558.06 | 1293 | 1253 | 314.8 |
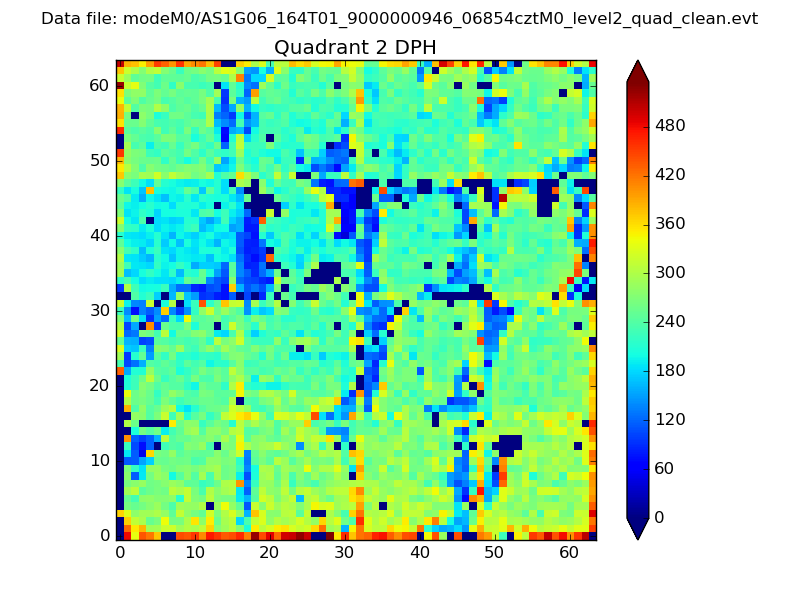
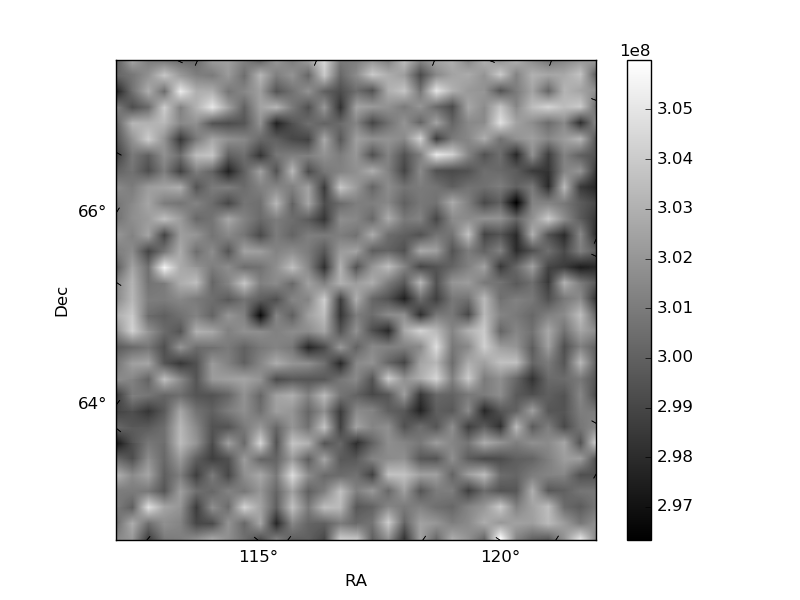
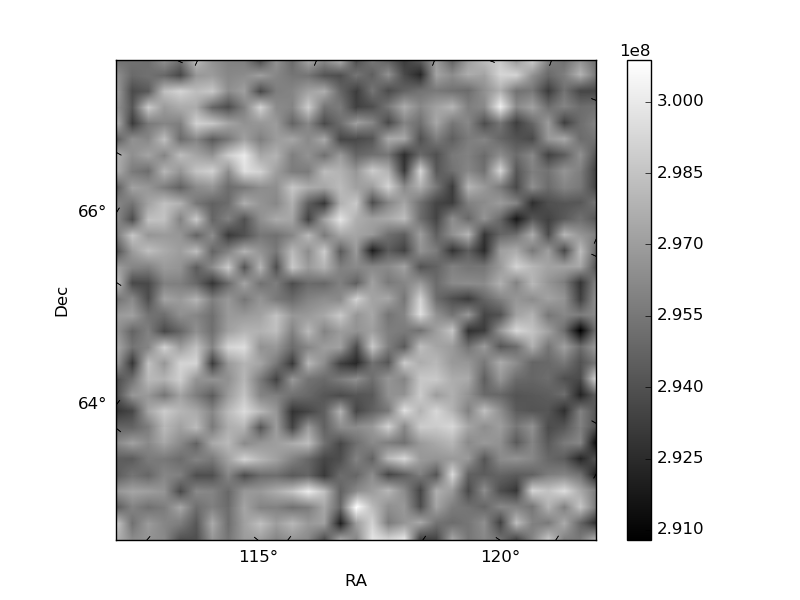
Histogram calculated using DETX and DETY for each event in the final _common_clean file
| Quadrant A | 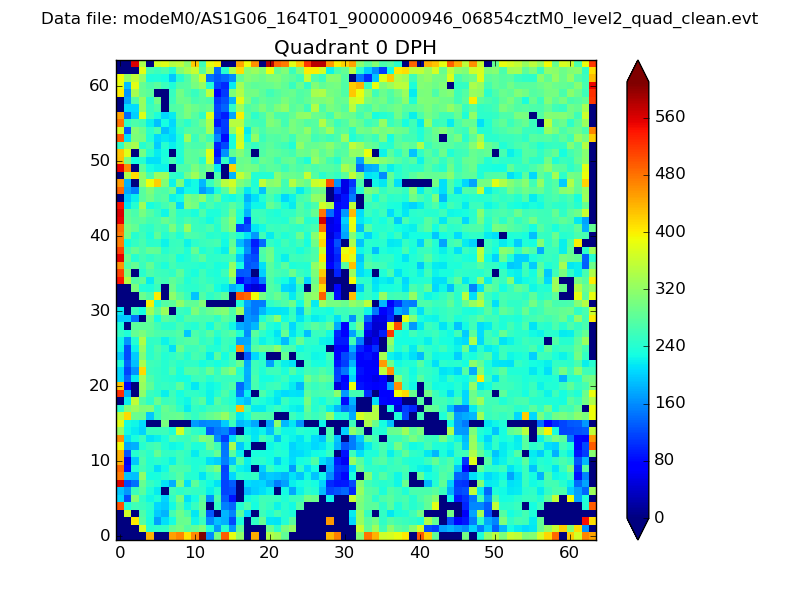 |
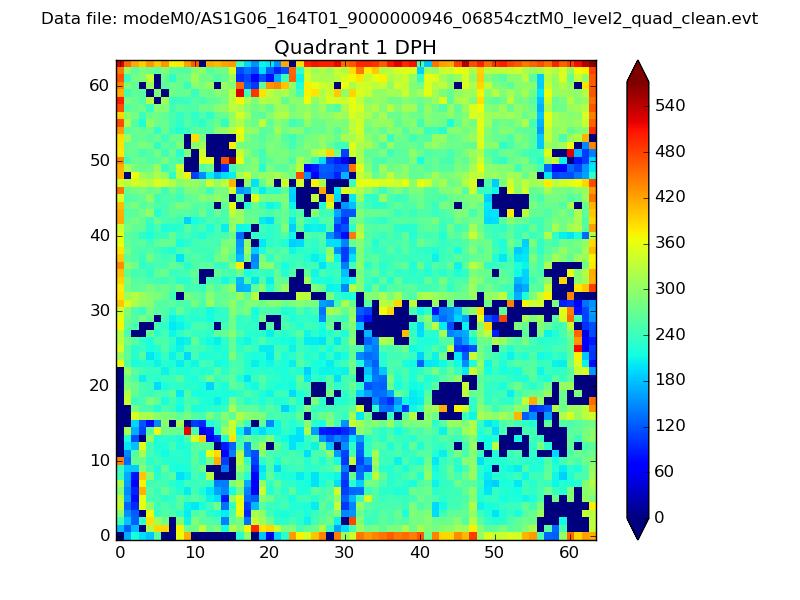 |
Quadrant B |
|---|---|---|---|
| Quadrant D | 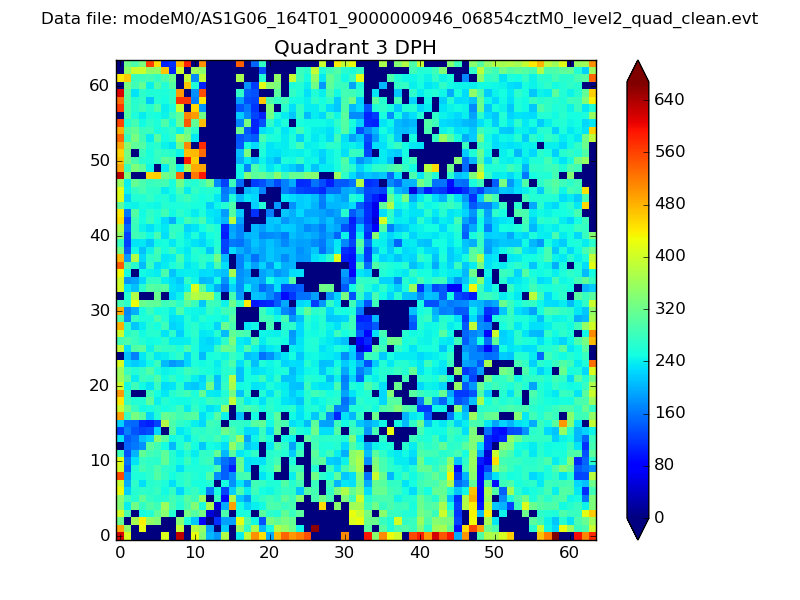 |
 |
Quadrant C |
| Plot type | Count rate plots | Images |
|---|---|---|
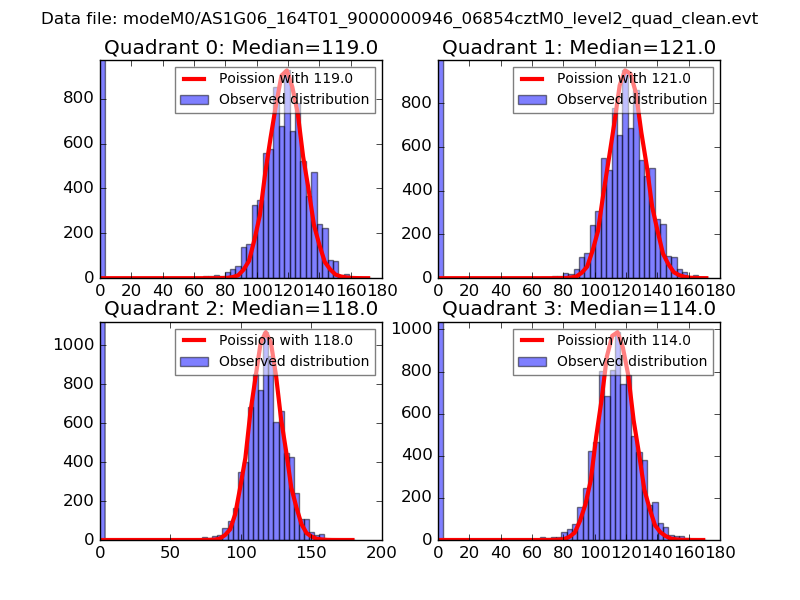
| Comparison with Poisson distribution Blue bars denote a histogram of data divided into 1 sec bins. Red curve is a Poisson curve with rate = median count rate of data. |
 |
 |
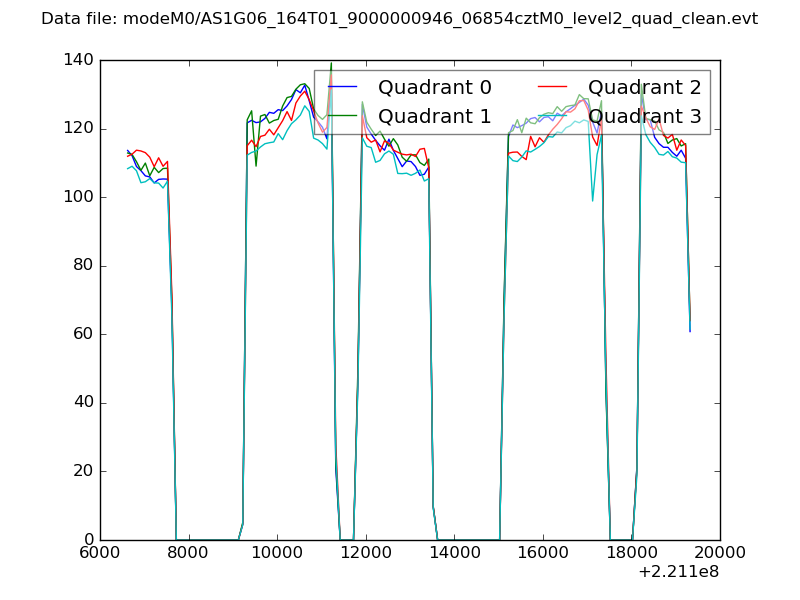
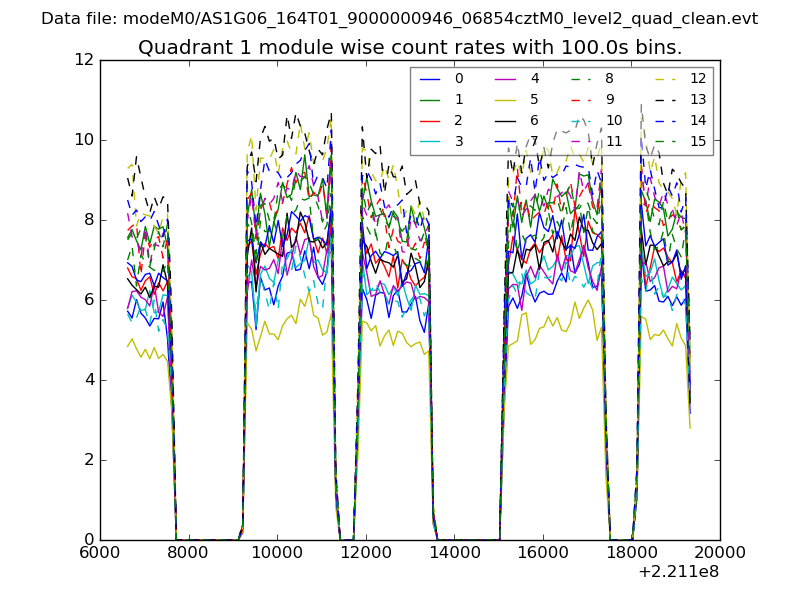
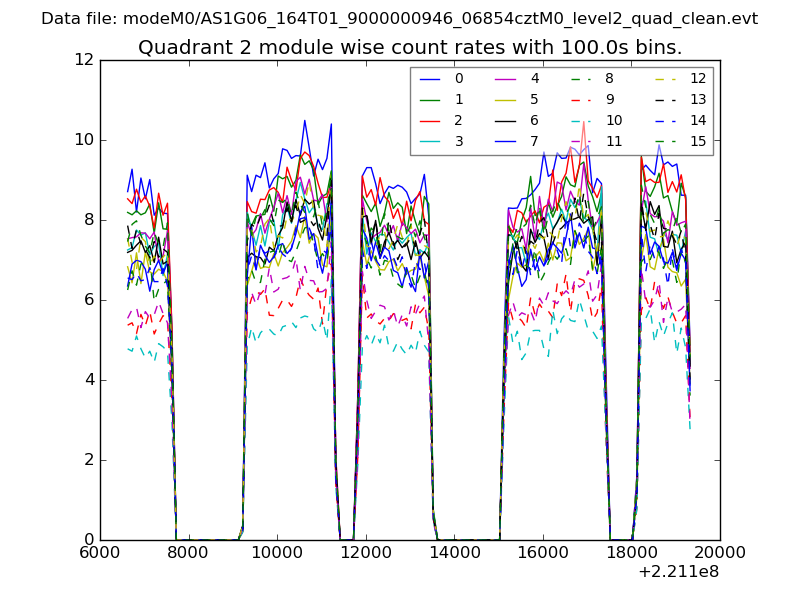
| Quadrant-wise count rates Data is divided into 100 sec bins |
 |
|
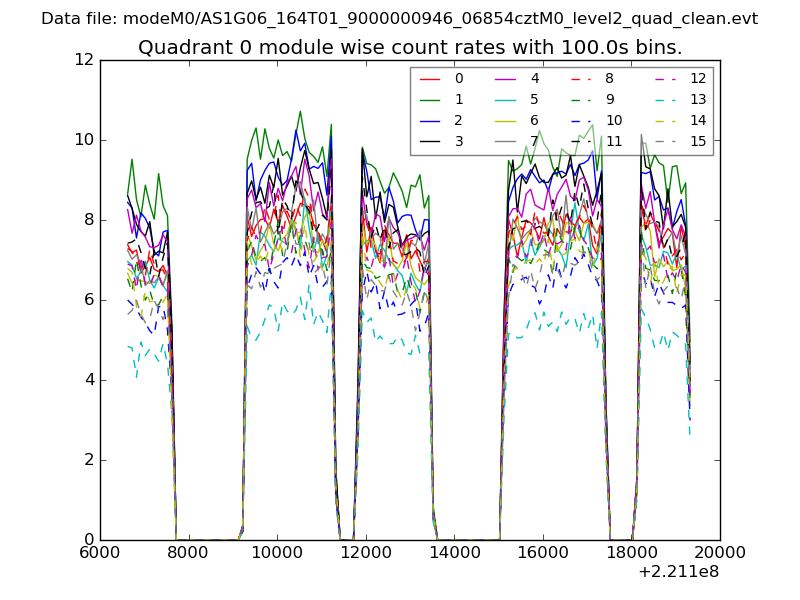
| Module-wise count rates for Quadrant A Data is divided into 100 sec bins |
 |
 |
| Module-wise count rates for Quadrant B Data is divided into 100 sec bins |
 |
 |
| Module-wise count rates for Quadrant C Data is divided into 100 sec bins |
 |
 |
| Module-wise count rates for Quadrant D Data is divided into 100 sec bins |
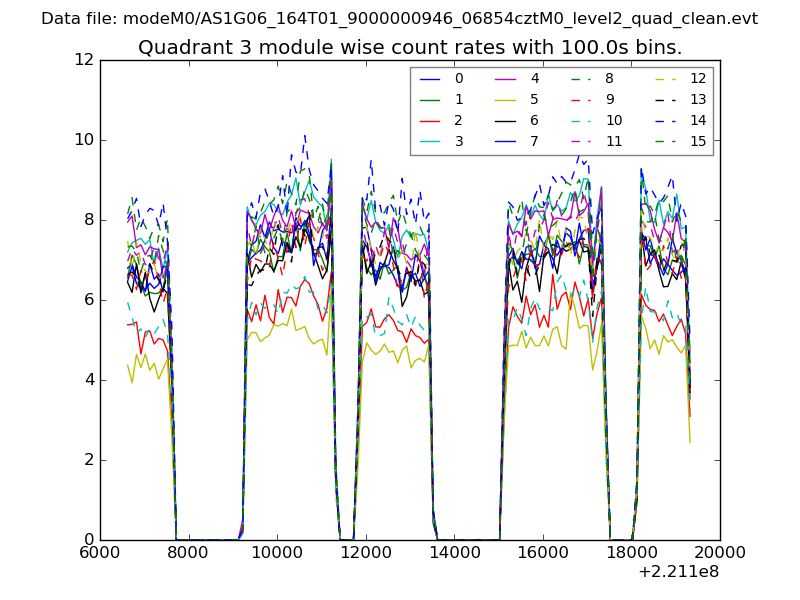 |
 |
| Parameter | Plot |
|---|---|
| CZT HV Monitor | 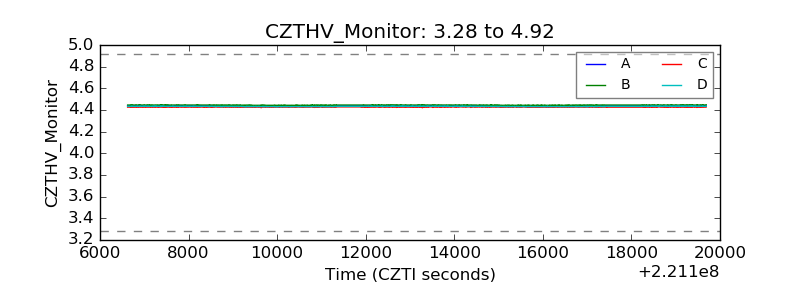 |
| D_VDD |  |
| Temperature 1 | 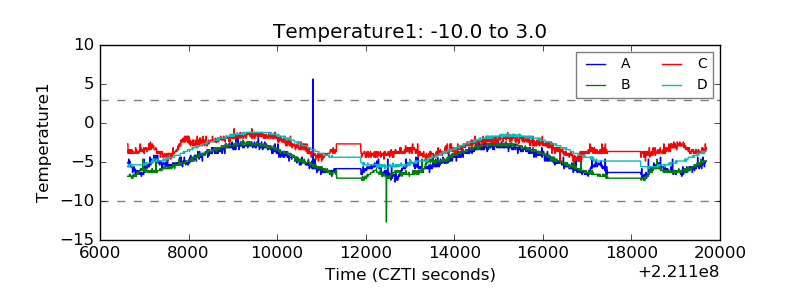 |
| Veto HV Monitor | 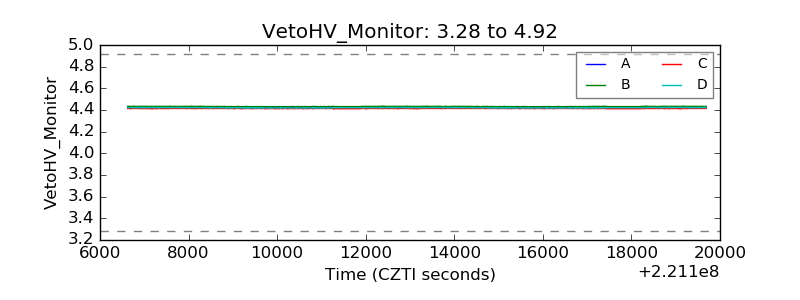 |
| Veto LLD | 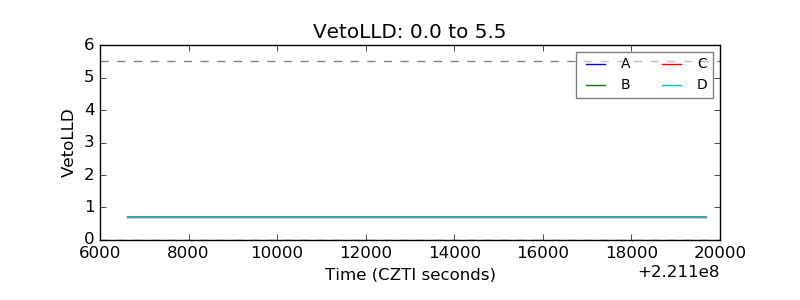 |
| Alpha Counter | 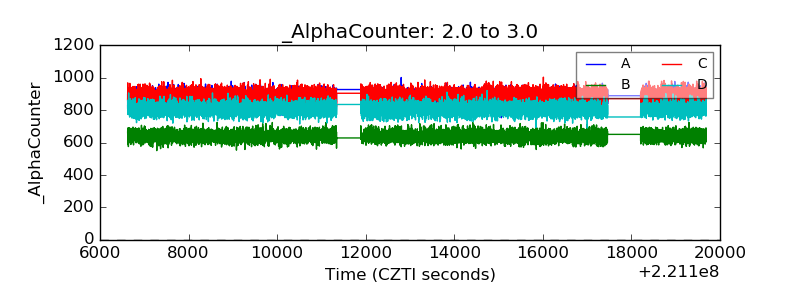 |
| _CPM_Rate | 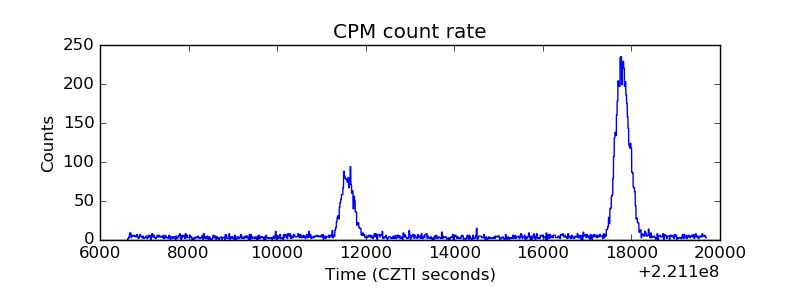 |
| CZT Counter | 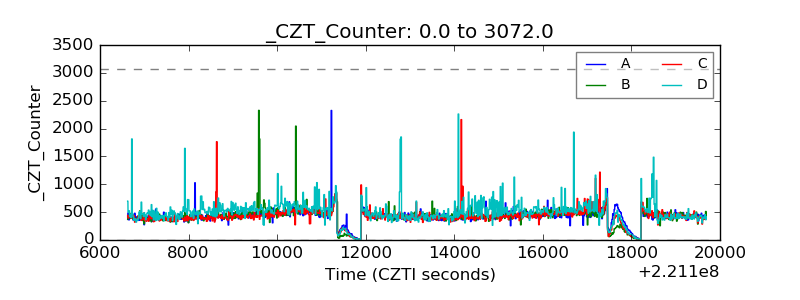 |
| +2.5 Volts monitor |  |
| +5 Volts monitor |  |
| _ROLL_ROT | 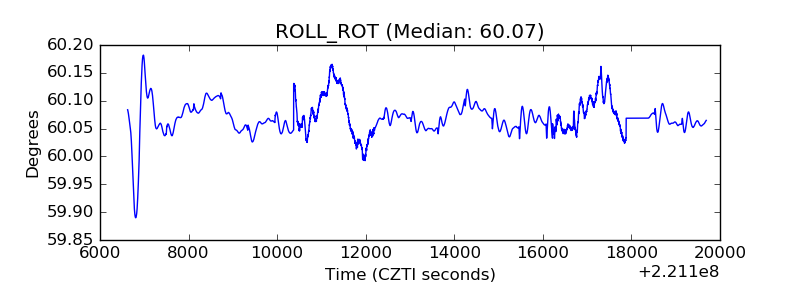 |
| _Roll_DEC | 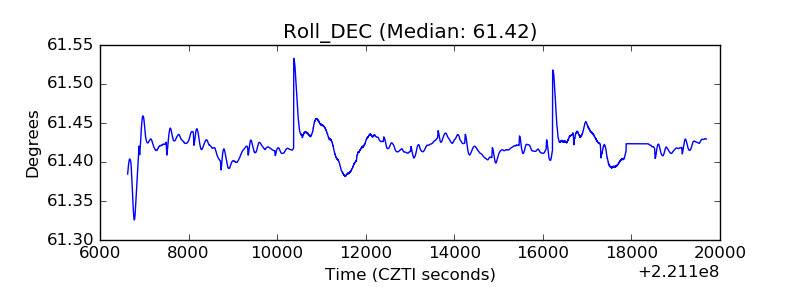 |
| _Roll_RA | 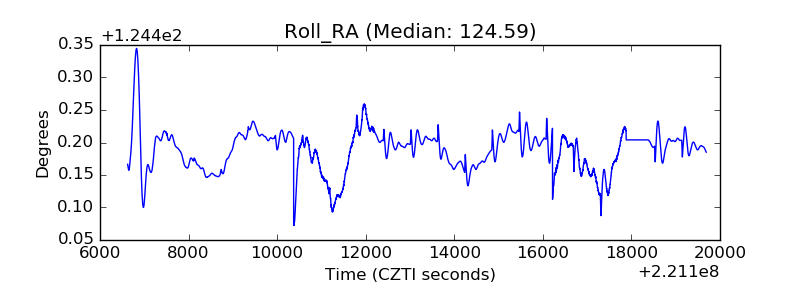 |
| Veto Counter | 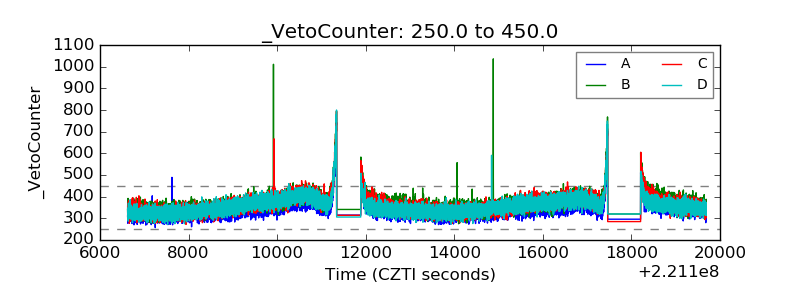 |