| Param | Original file | Final file |
|---|---|---|
| Filename | modeM0/AS1G06_164T01_9000000946_06855cztM0_level2.evt | modeM0/AS1G06_164T01_9000000946_06855cztM0_level2_quad_clean.evt |
| Size (bytes) | 438,062,400 | 87,952,320 |
| Size | 417.8 MB | 83.9 MB |
| Events in quadrant A | 3,194,463 | 547,116 |
| Events in quadrant B | 3,181,776 | 560,144 |
| Events in quadrant C | 3,062,969 | 547,628 |
| Events in quadrant D | 3,361,848 | 531,641 |
| Mode M0 | |||
|---|---|---|---|
| Quadrant | BADHDUFLAG | Total packets | Discarded packets |
| A | 0 | 14252 | 3 |
| B | 0 | 14133 | 2 |
| C | 0 | 13982 | 2 |
| D | 0 | 14610 | 2 |
| Mode M9 | |||
|---|---|---|---|
| Quadrant | BADHDUFLAG | Total packets | Discarded packets |
| A | 0 | 17 | 0 |
| B | 0 | 17 | 0 |
| C | 0 | 17 | 0 |
| D | 0 | 17 | 0 |
| Mode SS | |||
|---|---|---|---|
| Quadrant | BADHDUFLAG | Total packets | Discarded packets |
| A | 0 | 140 | 0 |
| B | 0 | 140 | 0 |
| C | 0 | 140 | 0 |
| D | 0 | 140 | 0 |
| Quadrant | Total seconds | Saturated seconds | Saturation percentage |
|---|---|---|---|
| A | 6845 | 142 | 2.074507% |
| B | 6845 | 130 | 1.899196% |
| C | 6845 | 85 | 1.241782% |
| D | 6845 | 124 | 1.811541% |
Noise dominated data is calculated using 1-second bins in cleaned event files. If a bin has >2000 counts, and if more than 50% of those come from <1% of pixels, then it is considered to be noise-dominated and hence unusable.
| Quadrant | # 1 sec bins | Bins with >0 counts | Bins with >2000 counts | High rate bins dominated by noise | Noise dominated (total time) | Noise dominated (detector-on time) | Marked lightcurve |
|---|---|---|---|---|---|---|---|
| A | 8465 | 6847 | 21 | 21 | 0.25% | 0.31% | 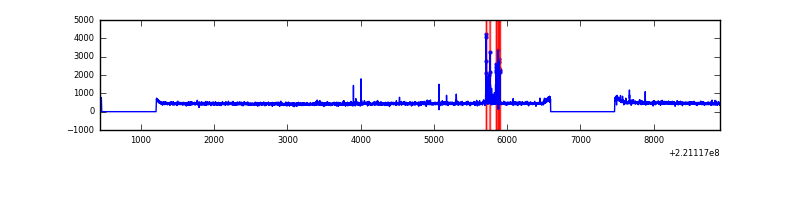 |
| B | 8465 | 6847 | 3 | 3 | 0.04% | 0.04% | 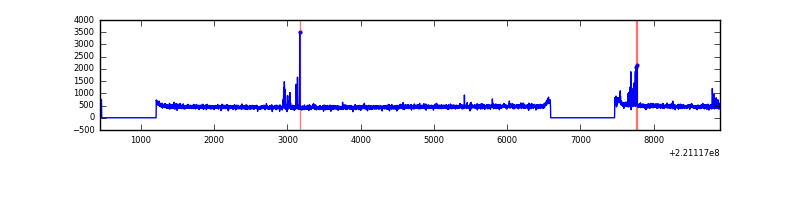 |
| C | 8465 | 6847 | 1 | 1 | 0.01% | 0.01% | 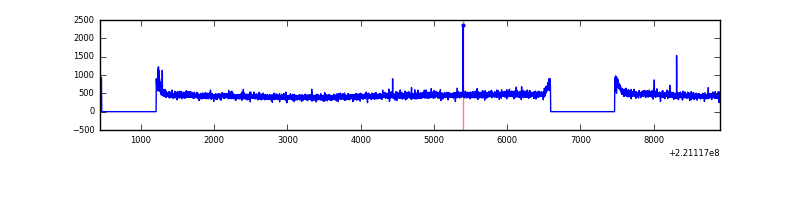 |
| D | 8465 | 6847 | 20 | 20 | 0.24% | 0.29% | 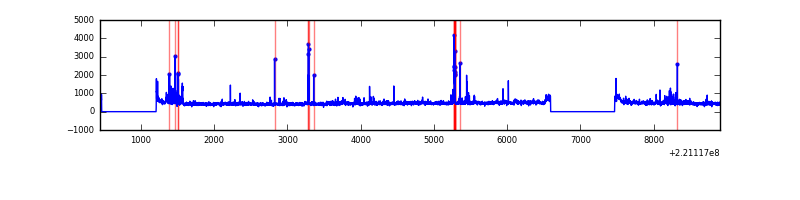 |
Top three noisy pixels from each quadrant. If the there are fewer than three noisy pixels in the level2.evt file, extra rows are filled as -1
| Pixel properties | Quadrant properties | ||||||
|---|---|---|---|---|---|---|---|
| Quadrant | DetID | PixID | Counts | Sigma | Mean | Median | Sigma |
| A | 4 | 2 | 121123 | 739.47 | 791 | 771 | 162.8 |
| A | 13 | 248 | 14031 | 81.47 | 791 | 771 | 162.8 |
| A | 13 | 251 | 11889 | 68.31 | 791 | 771 | 162.8 |
| B | 4 | 172 | 42625 | 270.97 | 797 | 776 | 154.4 |
| B | 15 | 255 | 36260 | 229.75 | 797 | 776 | 154.4 |
| B | 12 | 111 | 16467 | 101.6 | 797 | 776 | 154.4 |
| C | 9 | 247 | 62466 | 349.59 | 764 | 765 | 176.5 |
| C | 1 | 3 | 8053 | 41.29 | 764 | 765 | 176.5 |
| C | 9 | 16 | 6192 | 30.75 | 764 | 765 | 176.5 |
| D | 8 | 195 | 170763 | 909.47 | 766 | 739 | 186.9 |
| D | 14 | 34 | 105925 | 562.65 | 766 | 739 | 186.9 |
| D | 2 | 216 | 77655 | 411.43 | 766 | 739 | 186.9 |
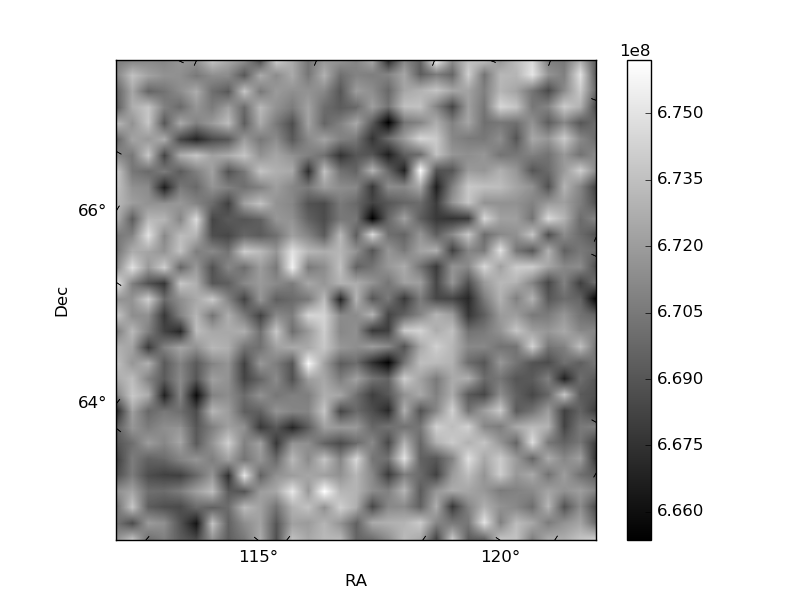
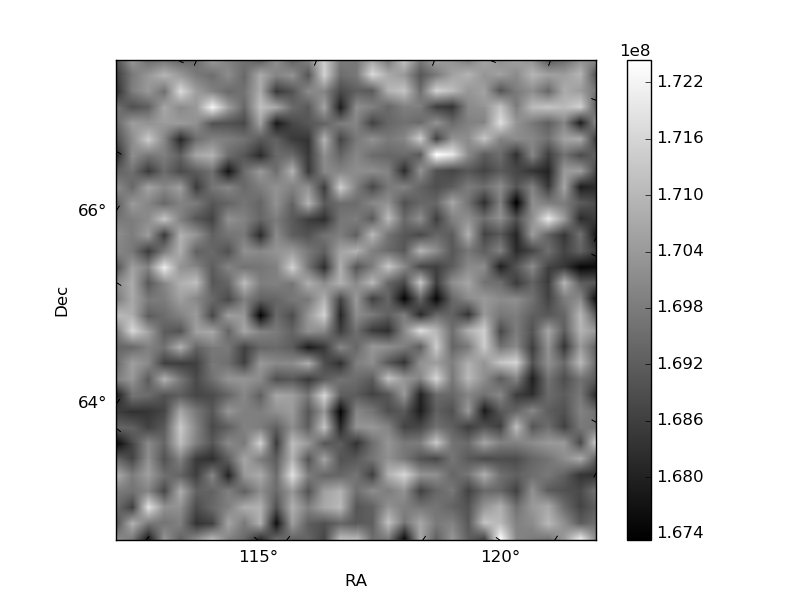
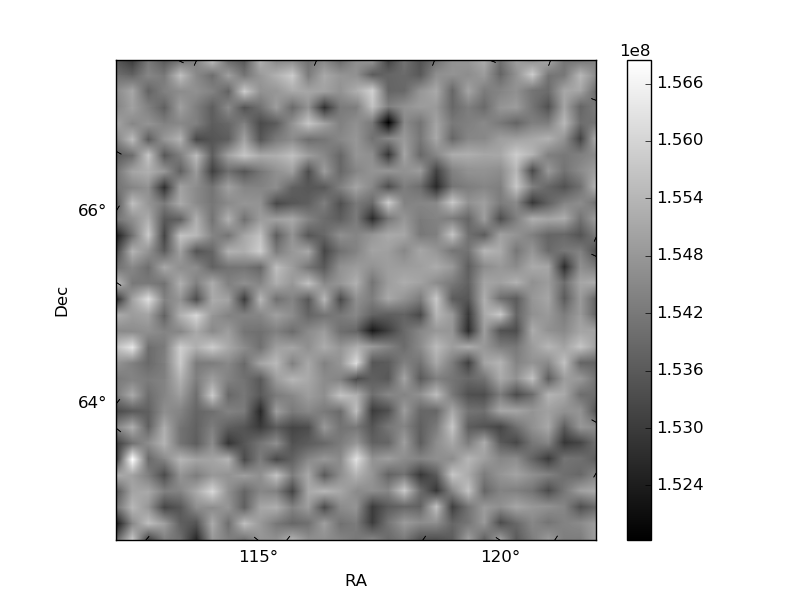
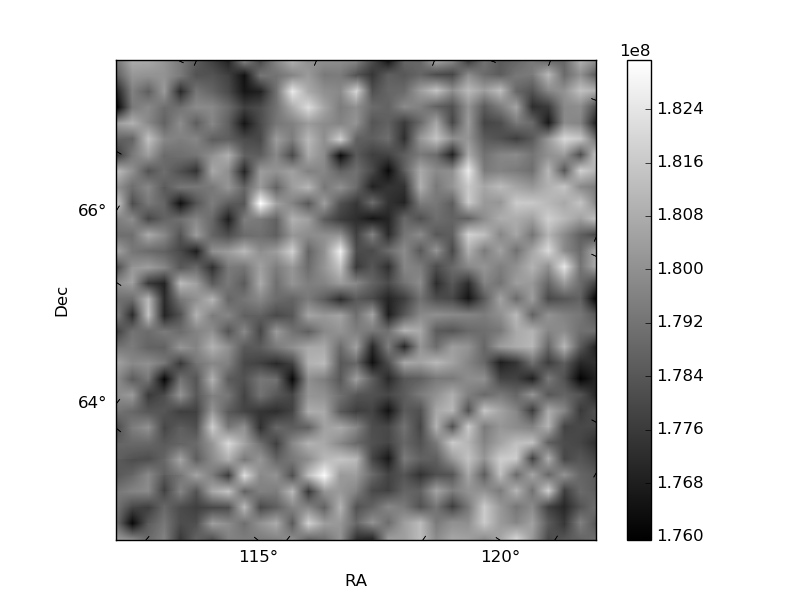
Histogram calculated using DETX and DETY for each event in the final _common_clean file
| Quadrant A | 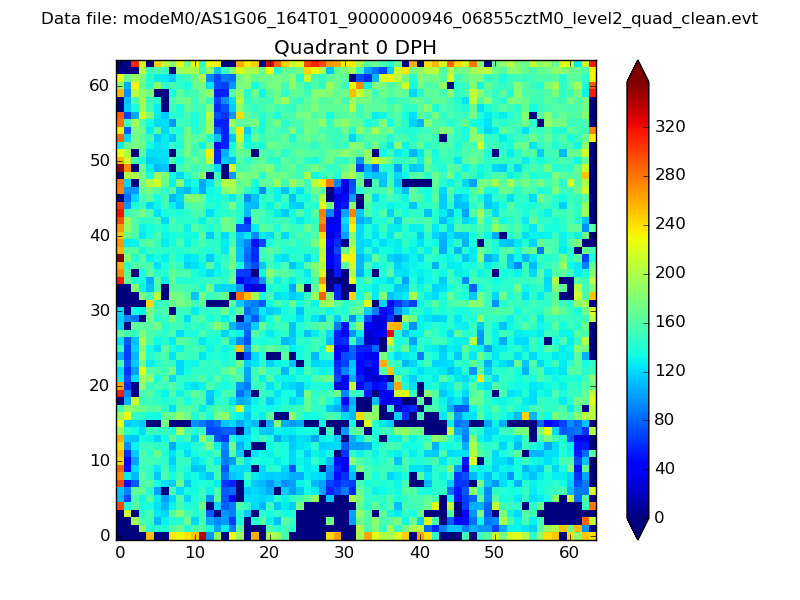 |
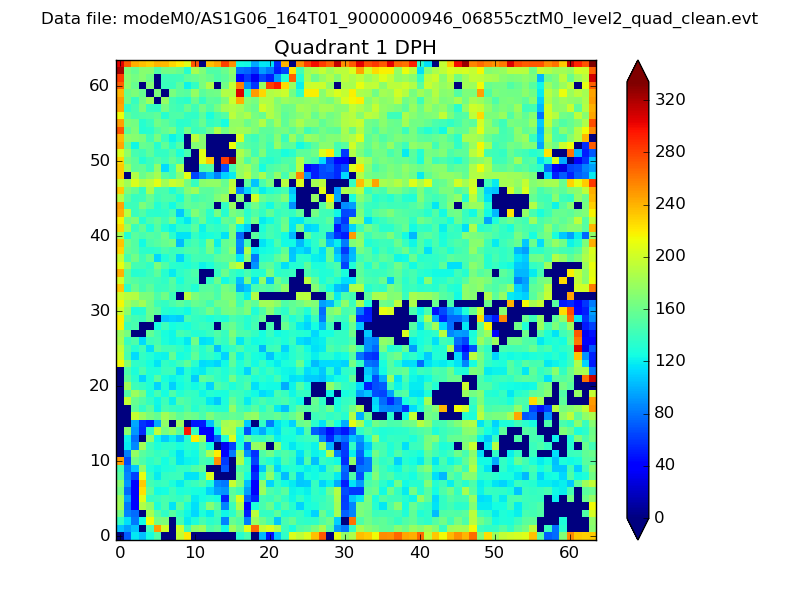 |
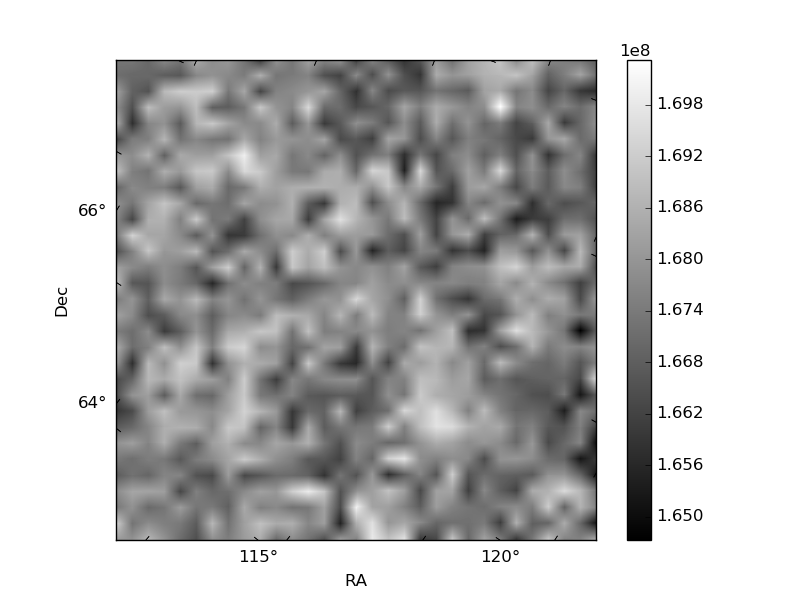
Quadrant B |
|---|---|---|---|
| Quadrant D | 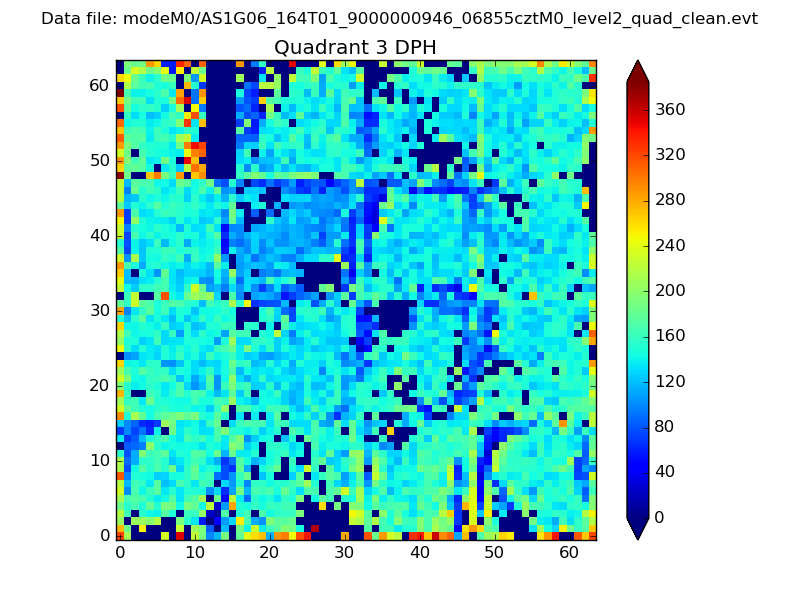 |
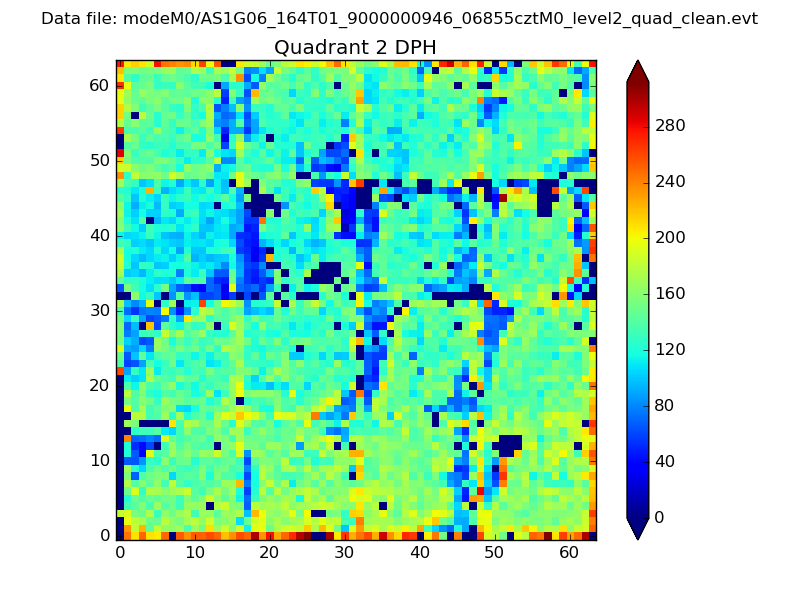 |
Quadrant C |
| Plot type | Count rate plots | Images |
|---|---|---|
| Comparison with Poisson distribution Blue bars denote a histogram of data divided into 1 sec bins. Red curve is a Poisson curve with rate = median count rate of data. |
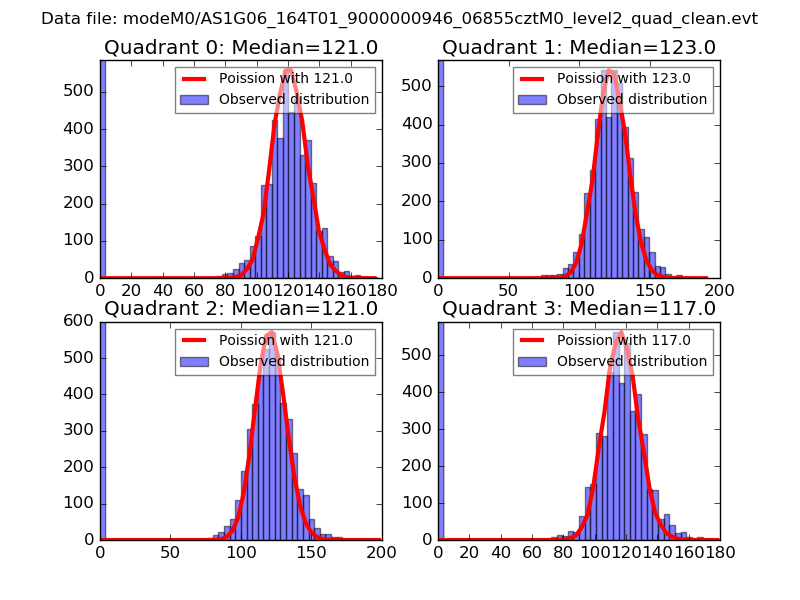 |
 |
| Quadrant-wise count rates Data is divided into 100 sec bins |
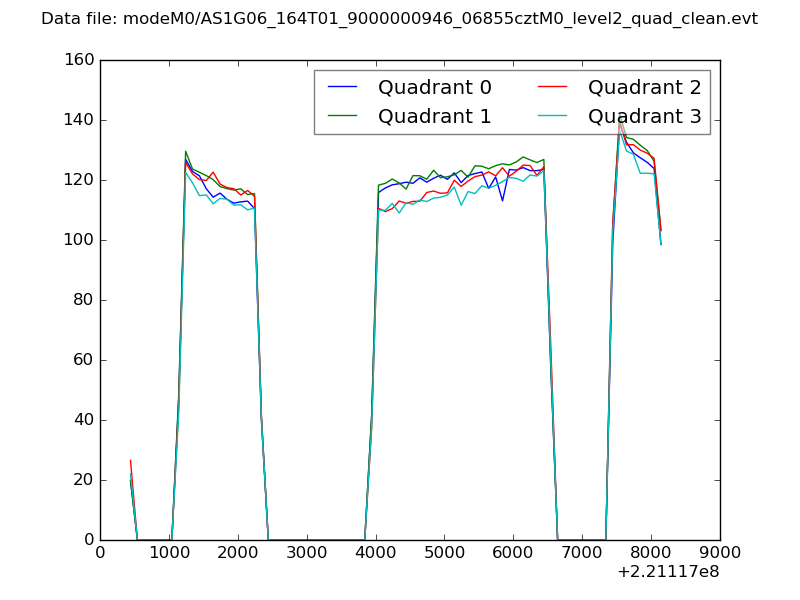 |
|
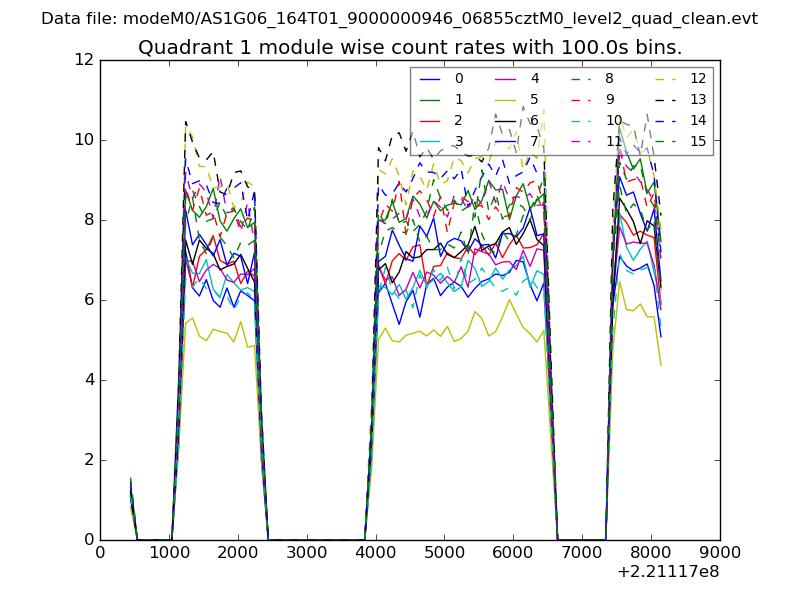
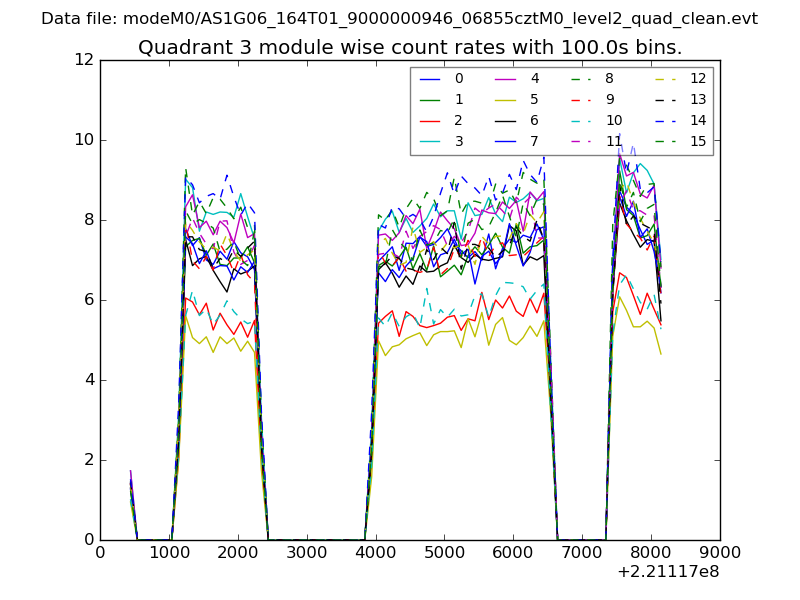
| Module-wise count rates for Quadrant A Data is divided into 100 sec bins |
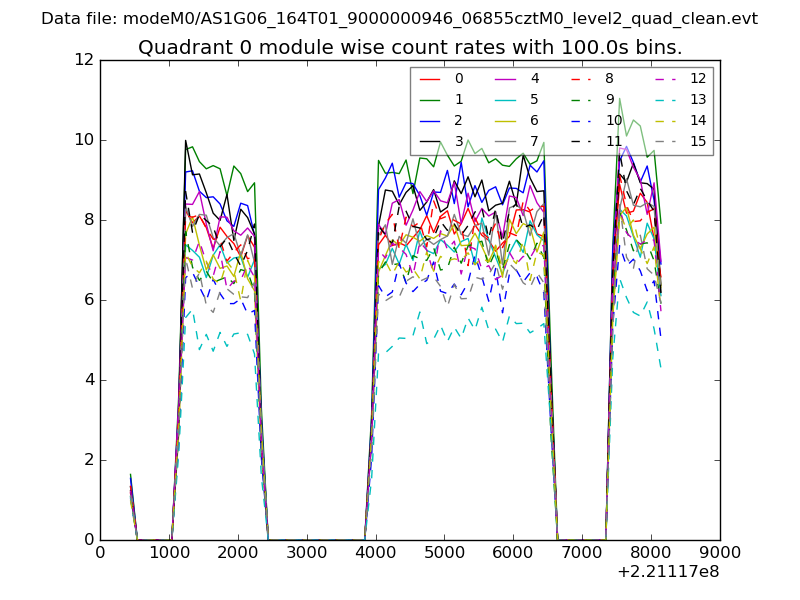 |
 |
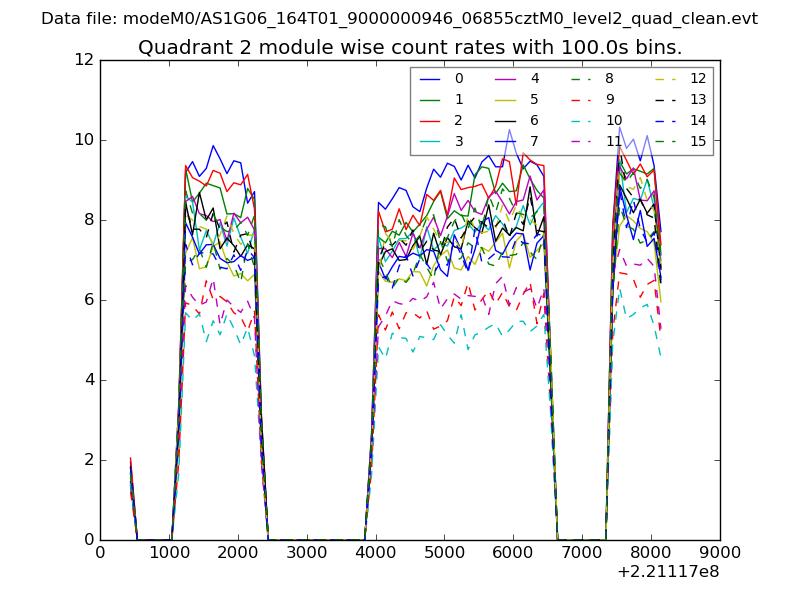
| Module-wise count rates for Quadrant B Data is divided into 100 sec bins |
 |
 |
| Module-wise count rates for Quadrant C Data is divided into 100 sec bins |
 |
 |
| Module-wise count rates for Quadrant D Data is divided into 100 sec bins |
 |
 |
| Parameter | Plot |
|---|---|
| CZT HV Monitor | 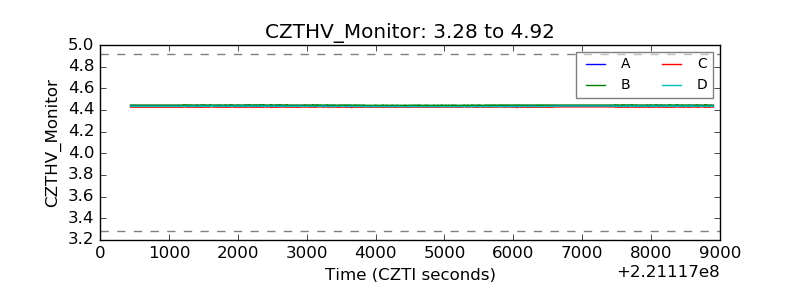 |
| D_VDD | 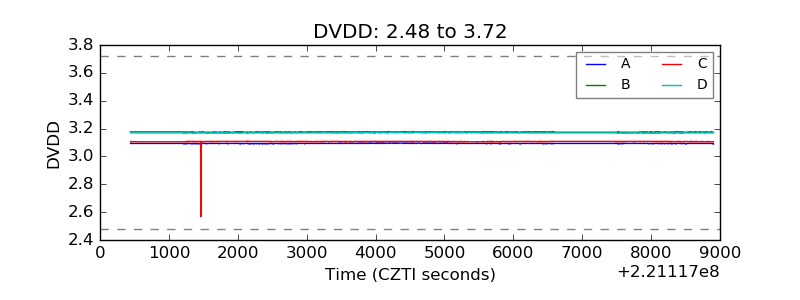 |
| Temperature 1 | 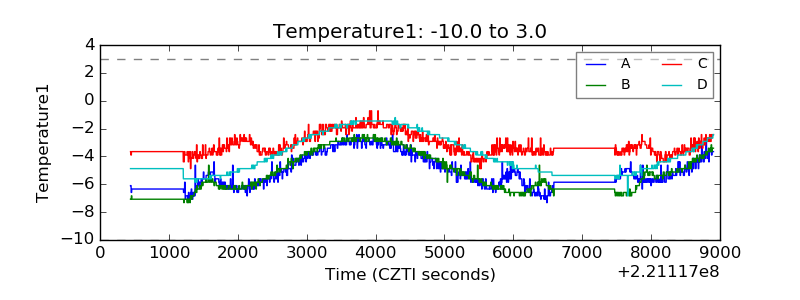 |
| Veto HV Monitor | 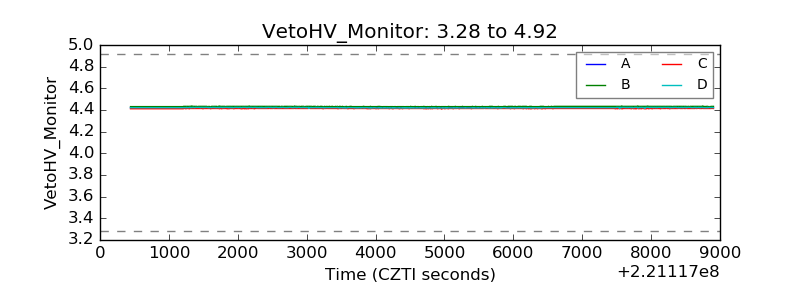 |
| Veto LLD | 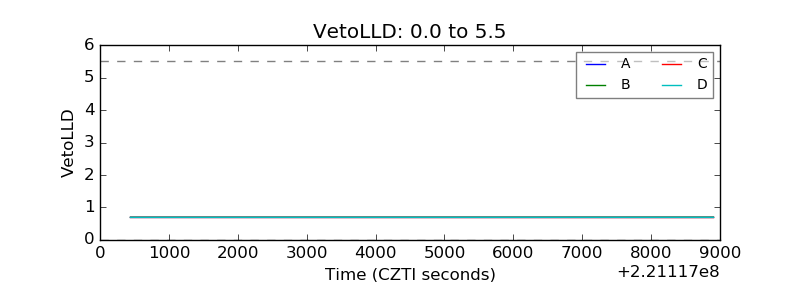 |
| Alpha Counter |  |
| _CPM_Rate | 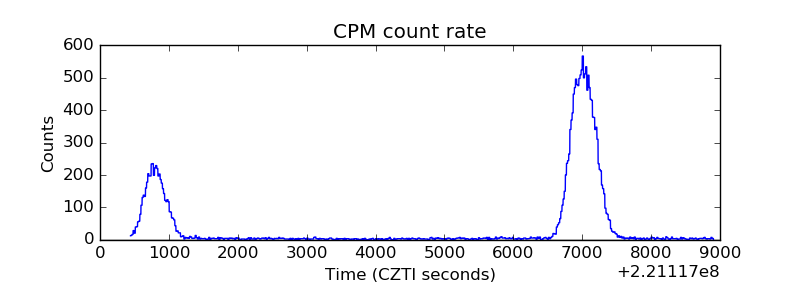 |
| CZT Counter | 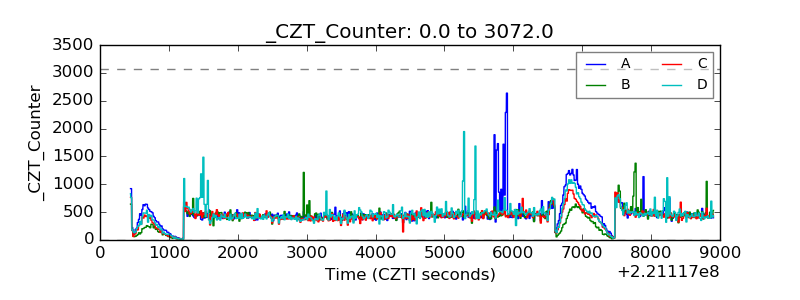 |
| +2.5 Volts monitor |  |
| +5 Volts monitor |  |
| _ROLL_ROT | 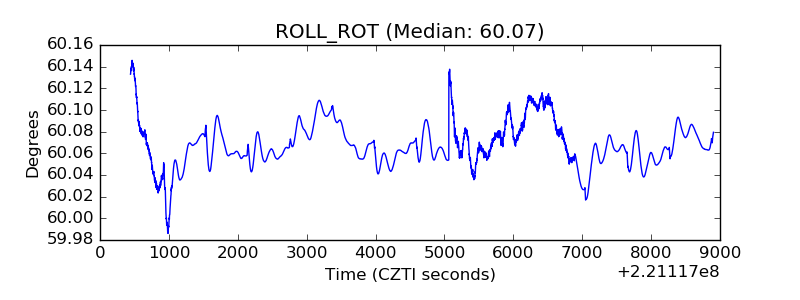 |
| _Roll_DEC | 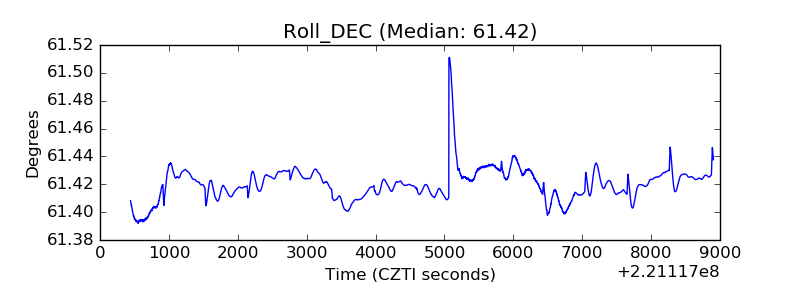 |
| _Roll_RA | 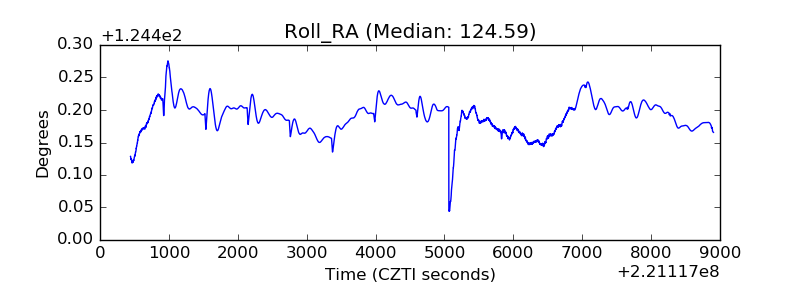 |
| Veto Counter | 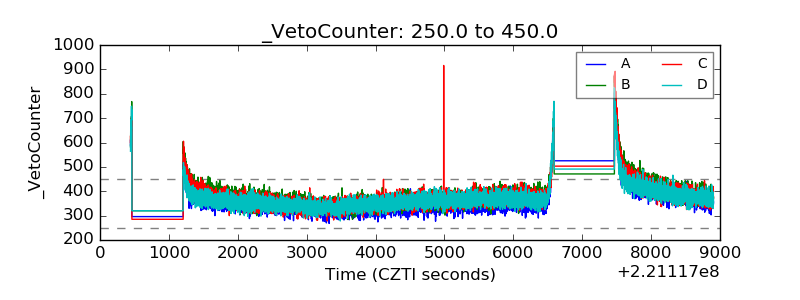 |