| Param | Original file | Final file |
|---|---|---|
| Filename | modeM0/AS1G06_164T01_9000000946_06858cztM0_level2.evt | modeM0/AS1G06_164T01_9000000946_06858cztM0_level2_quad_clean.evt |
| Size (bytes) | 765,132,480 | 134,303,040 |
| Size | 729.7 MB | 128.1 MB |
| Events in quadrant A | 5,385,883 | 841,203 |
| Events in quadrant B | 5,376,990 | 835,186 |
| Events in quadrant C | 5,336,568 | 809,332 |
| Events in quadrant D | 6,302,769 | 795,321 |
| Mode M0 | |||
|---|---|---|---|
| Quadrant | BADHDUFLAG | Total packets | Discarded packets |
| A | 0 | 23620 | 3 |
| B | 0 | 23534 | 4 |
| C | 0 | 23449 | 2 |
| D | 0 | 26142 | 2 |
| Mode M9 | |||
|---|---|---|---|
| Quadrant | BADHDUFLAG | Total packets | Discarded packets |
| A | 0 | 22 | 0 |
| B | 0 | 22 | 0 |
| C | 0 | 22 | 0 |
| D | 0 | 22 | 0 |
| Mode SS | |||
|---|---|---|---|
| Quadrant | BADHDUFLAG | Total packets | Discarded packets |
| A | 0 | 230 | 0 |
| B | 0 | 230 | 0 |
| C | 0 | 230 | 0 |
| D | 0 | 230 | 0 |
| Quadrant | Total seconds | Saturated seconds | Saturation percentage |
|---|---|---|---|
| A | 11364 | 161 | 1.416755% |
| B | 11363 | 162 | 1.425680% |
| C | 11364 | 138 | 1.214361% |
| D | 11364 | 193 | 1.698346% |
Noise dominated data is calculated using 1-second bins in cleaned event files. If a bin has >2000 counts, and if more than 50% of those come from <1% of pixels, then it is considered to be noise-dominated and hence unusable.
| Quadrant | # 1 sec bins | Bins with >0 counts | Bins with >2000 counts | High rate bins dominated by noise | Noise dominated (total time) | Noise dominated (detector-on time) | Marked lightcurve |
|---|---|---|---|---|---|---|---|
| A | 13549 | 11366 | 0 | 0 | 0.00% | 0.00% | 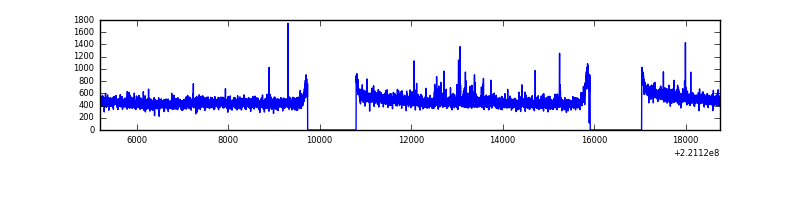 |
| B | 13549 | 11365 | 7 | 7 | 0.05% | 0.06% | 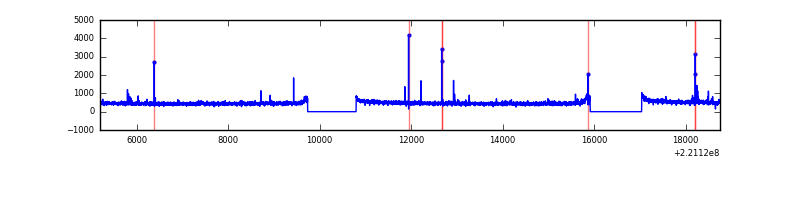 |
| C | 13549 | 11366 | 3 | 3 | 0.02% | 0.03% | 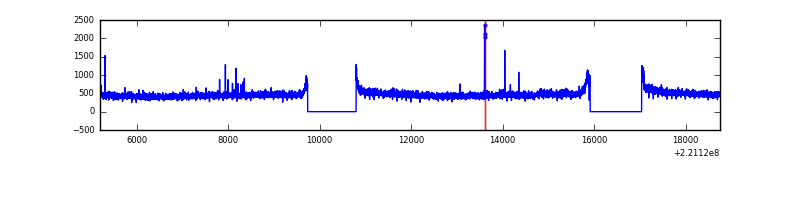 |
| D | 13549 | 11365 | 48 | 48 | 0.35% | 0.42% | 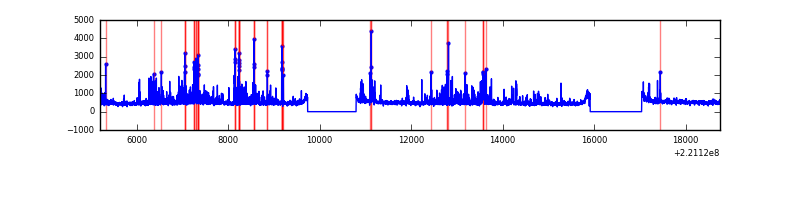 |
Top three noisy pixels from each quadrant. If the there are fewer than three noisy pixels in the level2.evt file, extra rows are filled as -1
| Pixel properties | Quadrant properties | ||||||
|---|---|---|---|---|---|---|---|
| Quadrant | DetID | PixID | Counts | Sigma | Mean | Median | Sigma |
| A | 13 | 251 | 77625 | 277.02 | 1365 | 1333 | 275.4 |
| A | 8 | 15 | 21199 | 72.14 | 1365 | 1333 | 275.4 |
| A | 13 | 248 | 16023 | 53.34 | 1365 | 1333 | 275.4 |
| B | 12 | 111 | 25968 | 95.7 | 1364 | 1332 | 257.4 |
| B | 0 | 219 | 24347 | 89.4 | 1364 | 1332 | 257.4 |
| B | 11 | 111 | 21191 | 77.14 | 1364 | 1332 | 257.4 |
| C | 9 | 247 | 137955 | 453.43 | 1313 | 1318 | 301.3 |
| C | 9 | 16 | 19367 | 59.9 | 1313 | 1318 | 301.3 |
| C | 1 | 3 | 18957 | 58.54 | 1313 | 1318 | 301.3 |
| D | 2 | 152 | 519321 | 1607.1 | 1323 | 1283 | 322.3 |
| D | 8 | 195 | 249465 | 769.93 | 1323 | 1283 | 322.3 |
| D | 2 | 216 | 135657 | 416.86 | 1323 | 1283 | 322.3 |
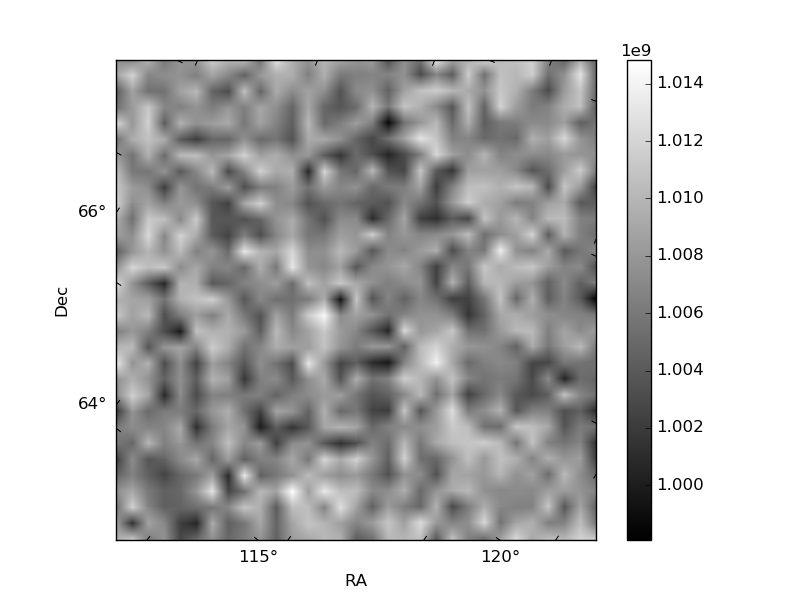
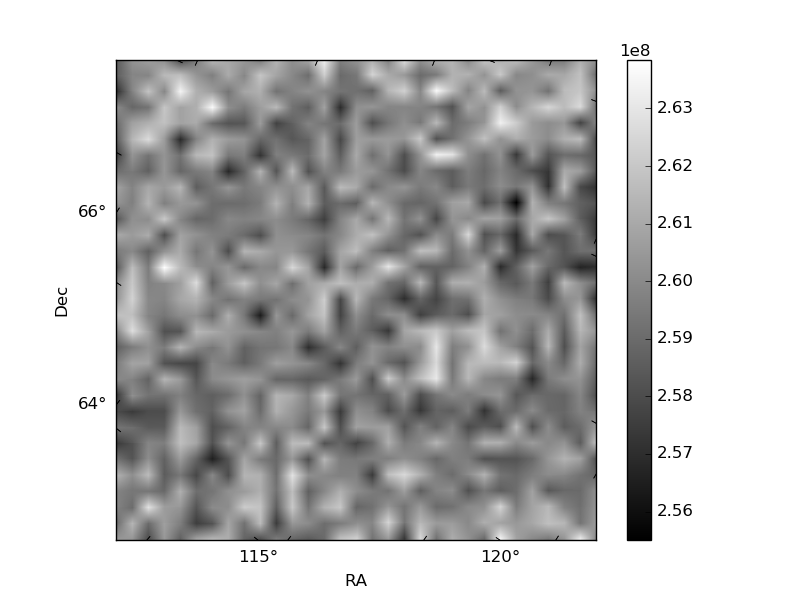
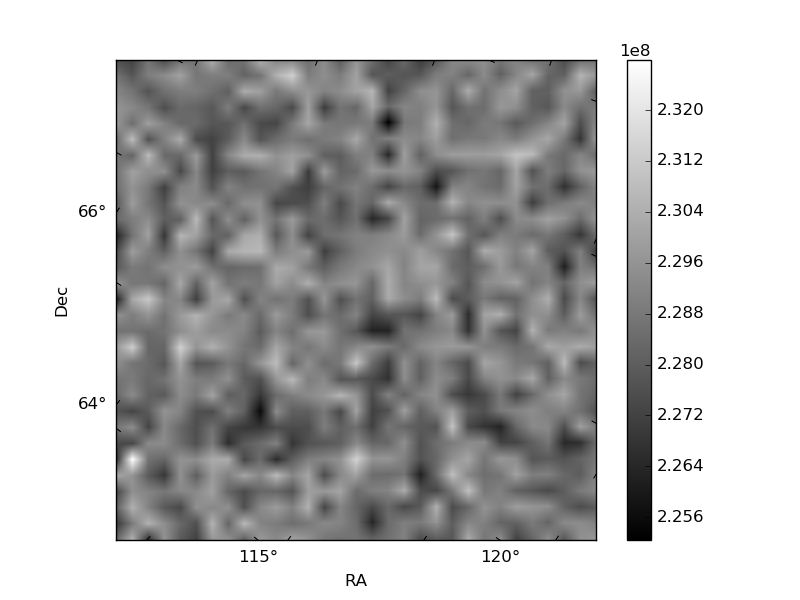
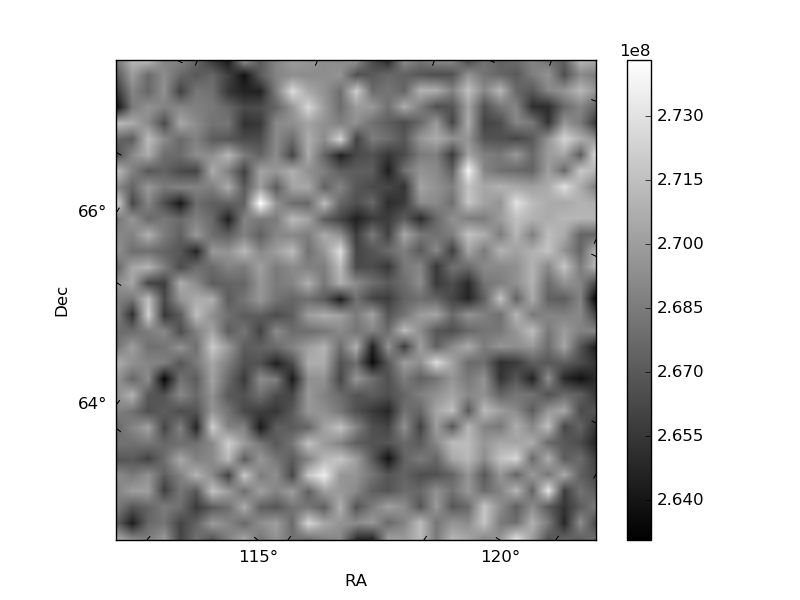
Histogram calculated using DETX and DETY for each event in the final _common_clean file
| Quadrant A | 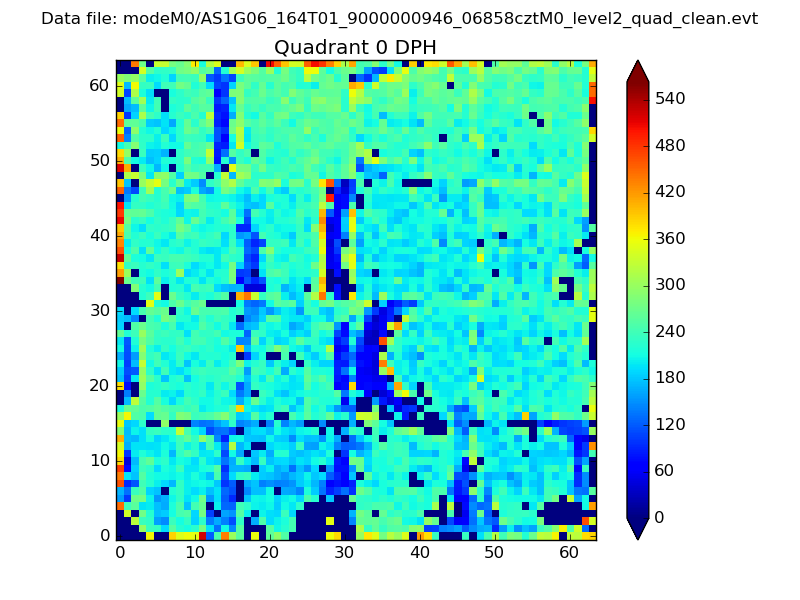 |
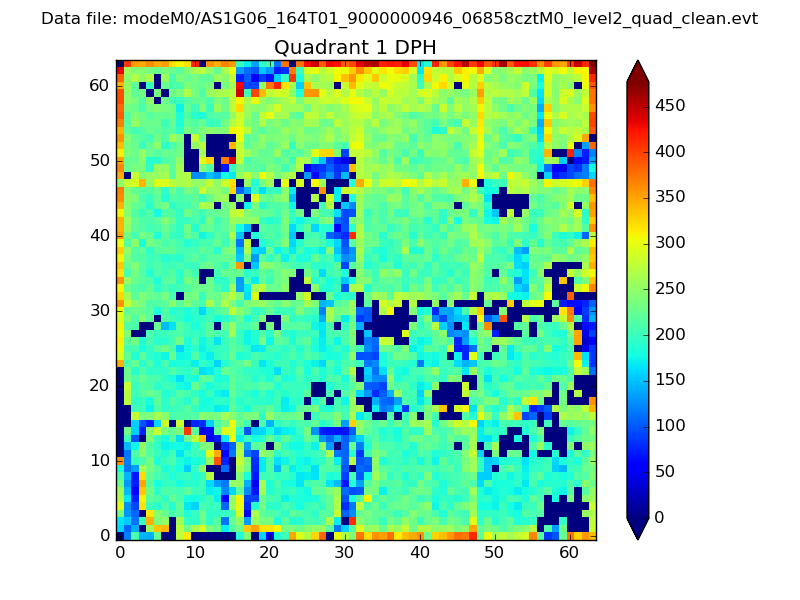 |
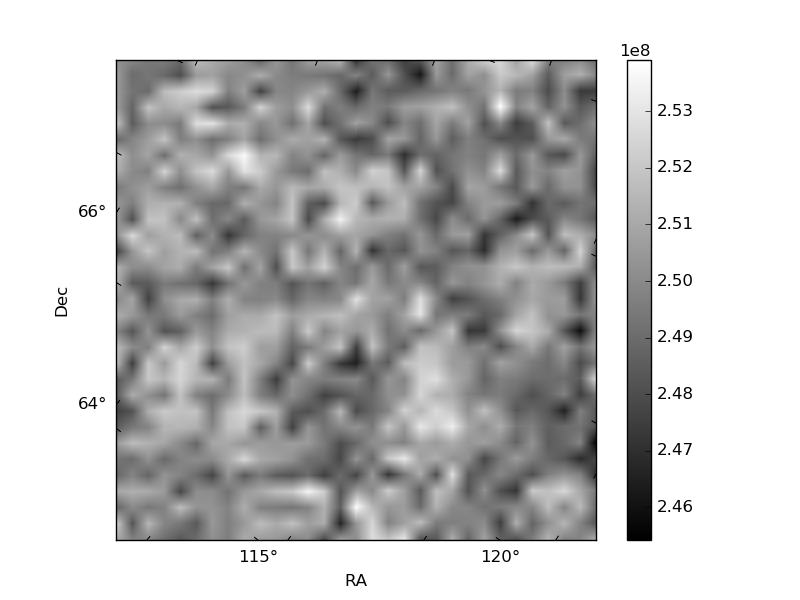
Quadrant B |
|---|---|---|---|
| Quadrant D | 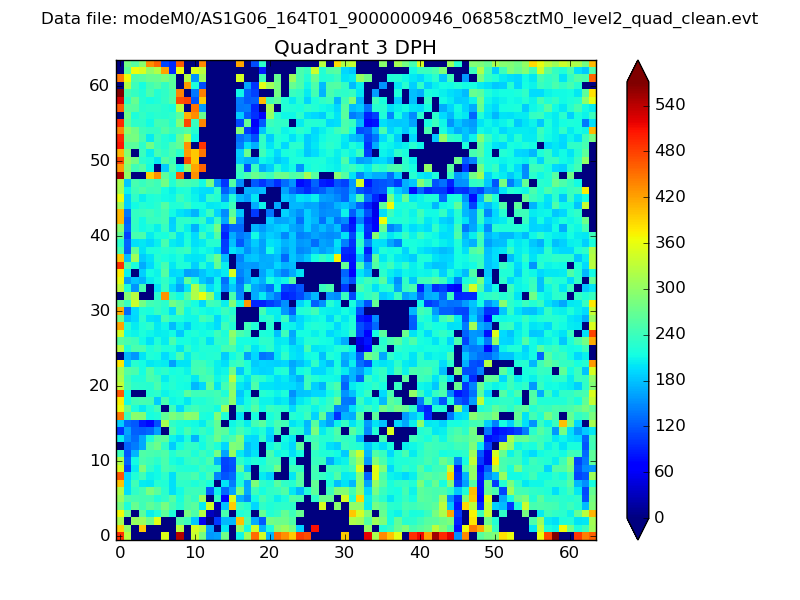 |
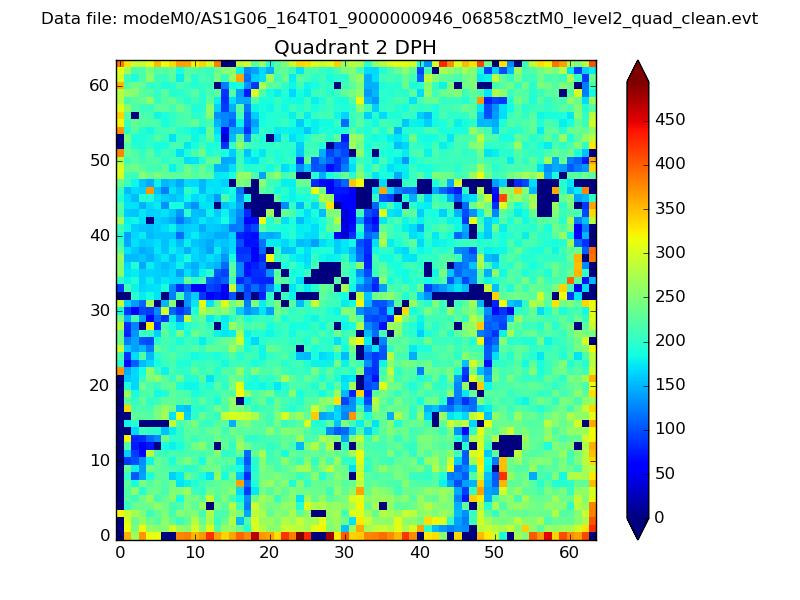 |
Quadrant C |
| Plot type | Count rate plots | Images |
|---|---|---|
| Comparison with Poisson distribution Blue bars denote a histogram of data divided into 1 sec bins. Red curve is a Poisson curve with rate = median count rate of data. |
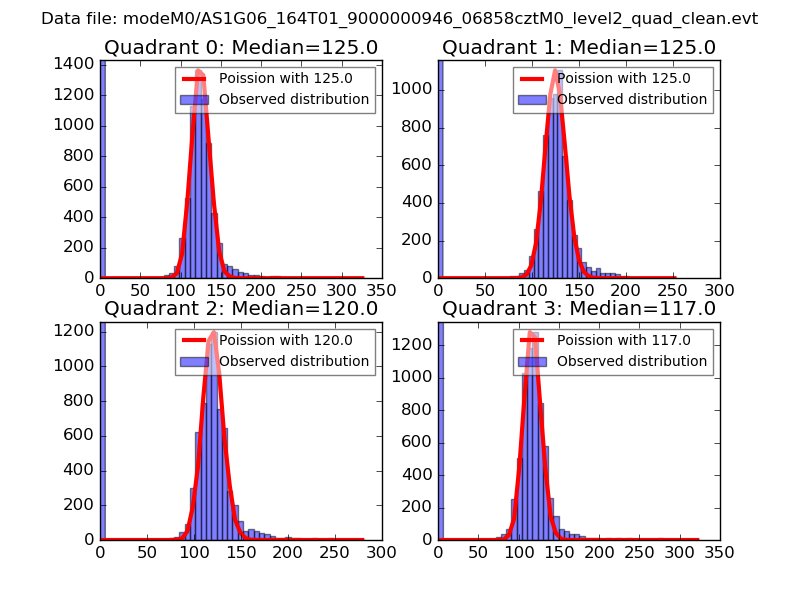 |
 |
| Quadrant-wise count rates Data is divided into 100 sec bins |
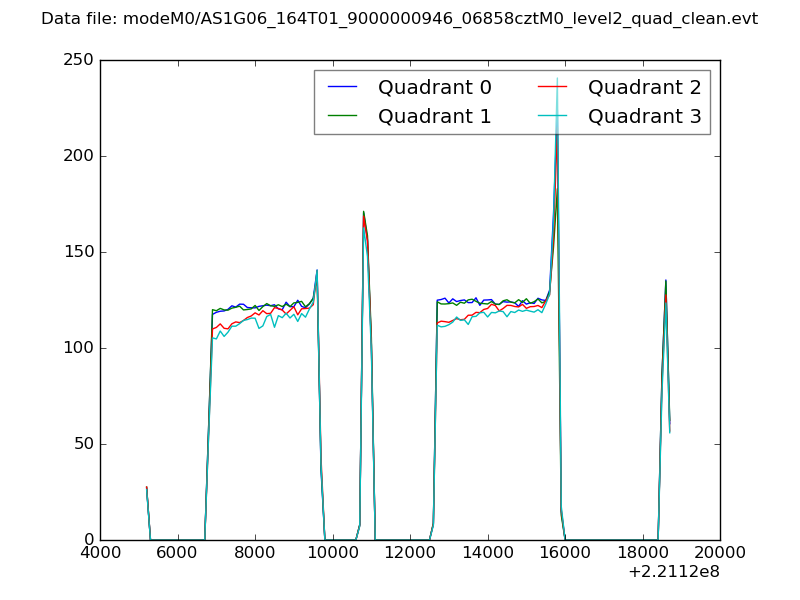 |
|
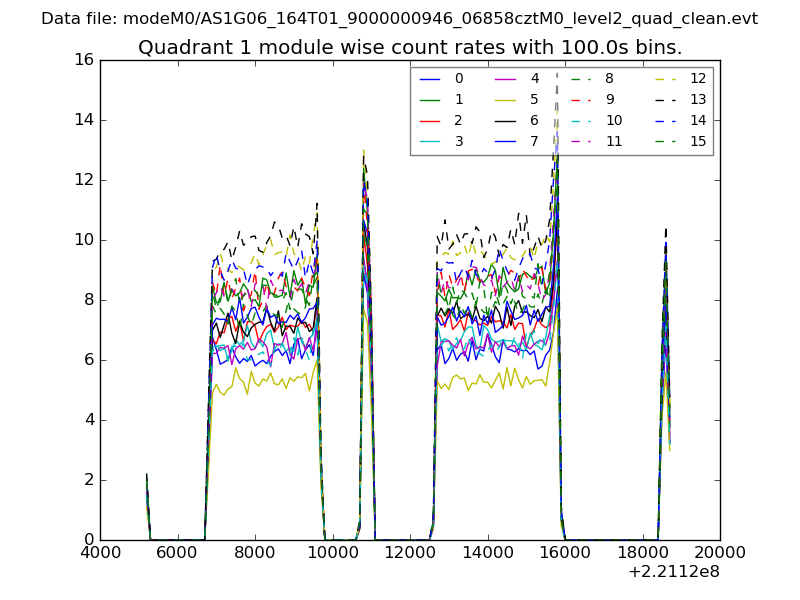
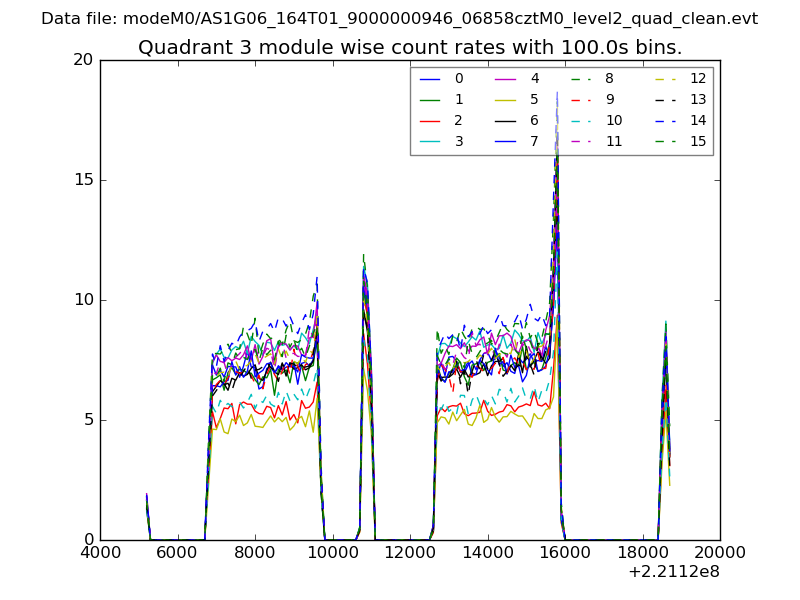
| Module-wise count rates for Quadrant A Data is divided into 100 sec bins |
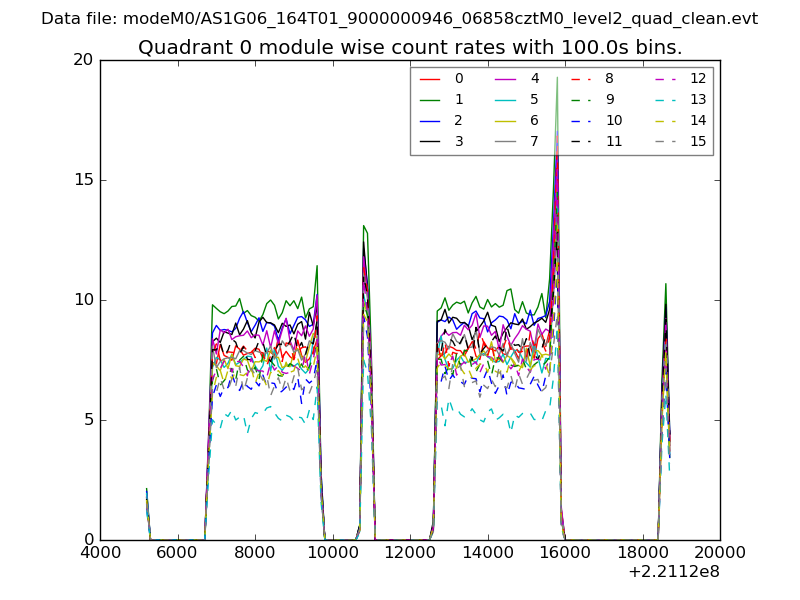 |
 |
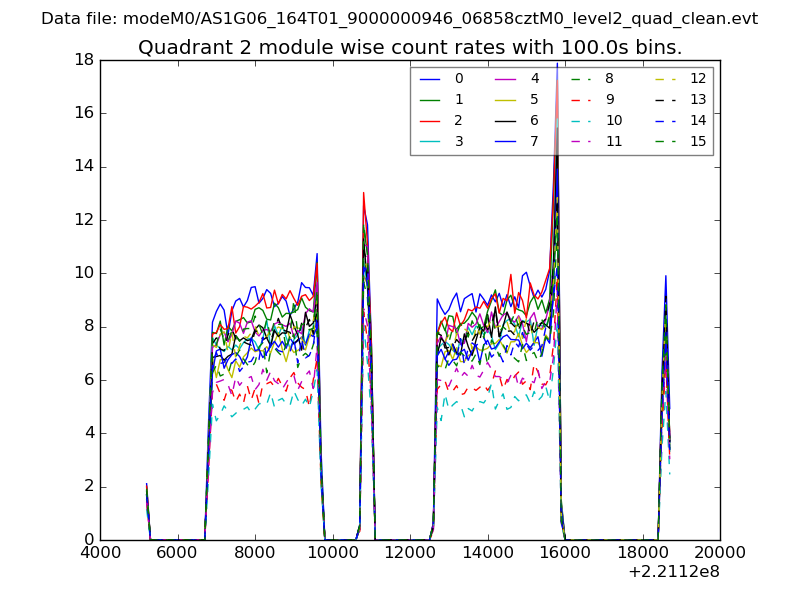
| Module-wise count rates for Quadrant B Data is divided into 100 sec bins |
 |
 |
| Module-wise count rates for Quadrant C Data is divided into 100 sec bins |
 |
 |
| Module-wise count rates for Quadrant D Data is divided into 100 sec bins |
 |
 |
| Parameter | Plot |
|---|---|
| CZT HV Monitor | 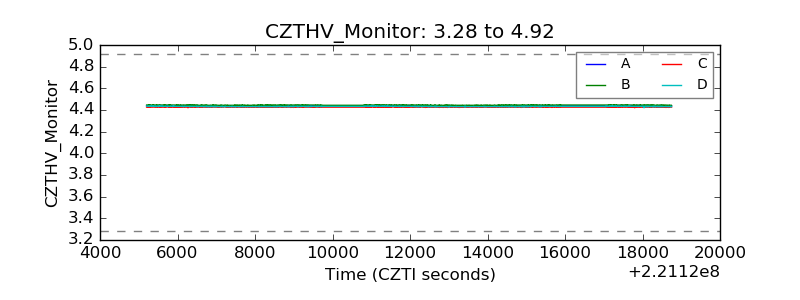 |
| D_VDD |  |
| Temperature 1 | 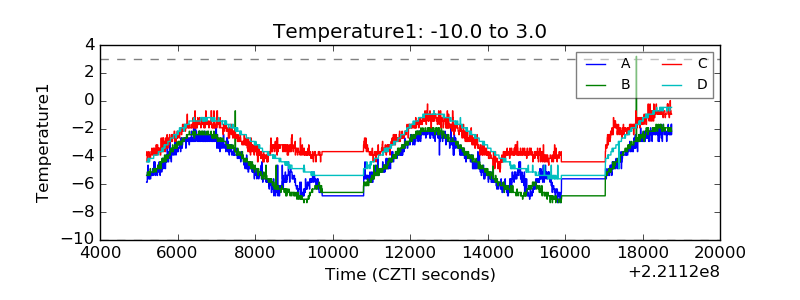 |
| Veto HV Monitor | 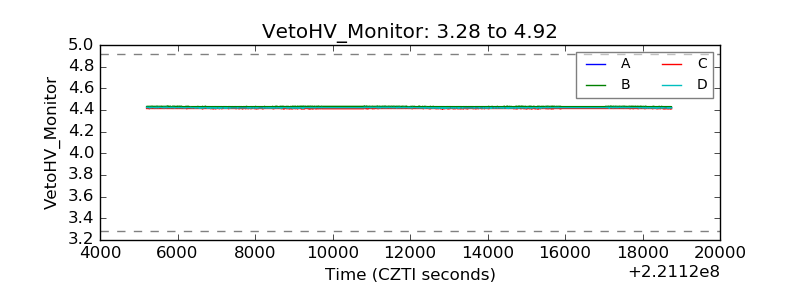 |
| Veto LLD | 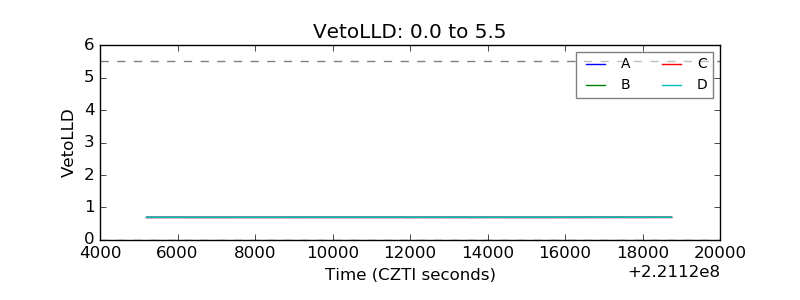 |
| Alpha Counter | 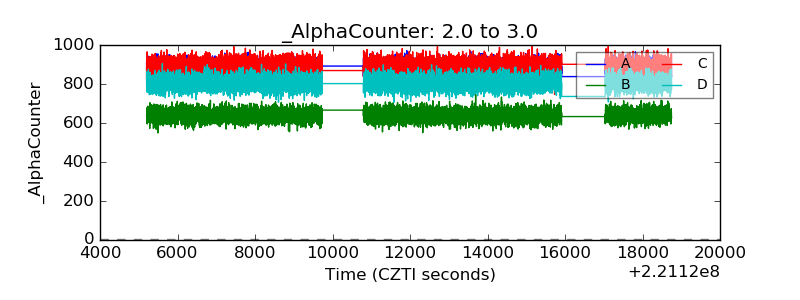 |
| _CPM_Rate | 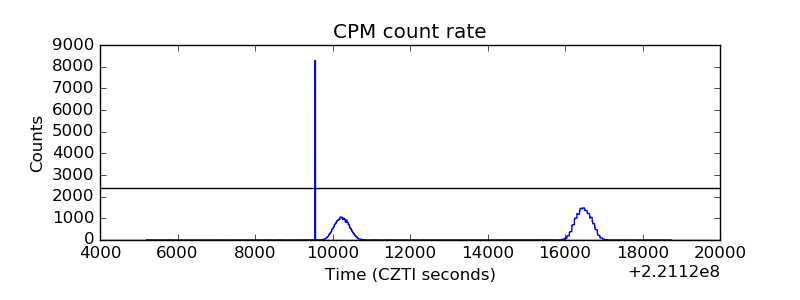 |
| CZT Counter | 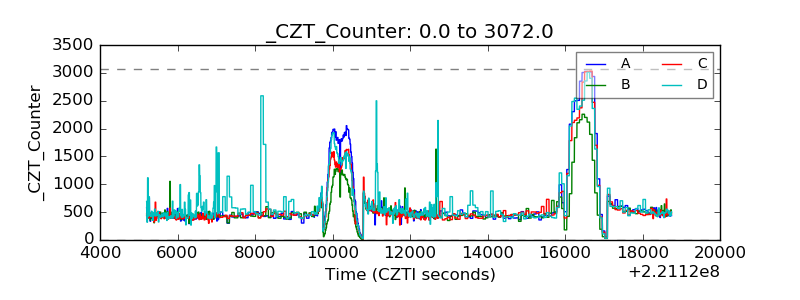 |
| +2.5 Volts monitor |  |
| +5 Volts monitor |  |
| _ROLL_ROT | 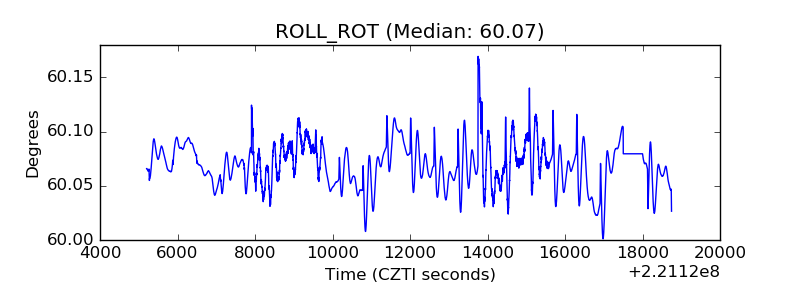 |
| _Roll_DEC | 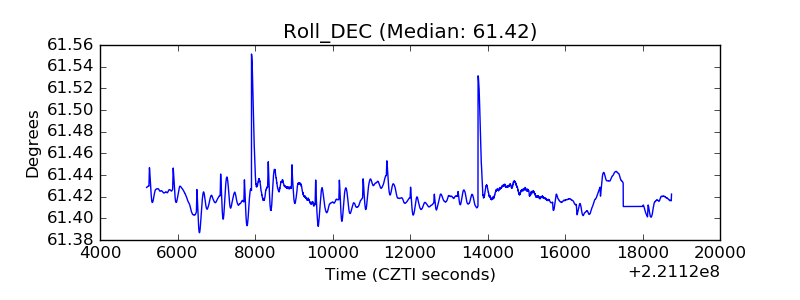 |
| _Roll_RA | 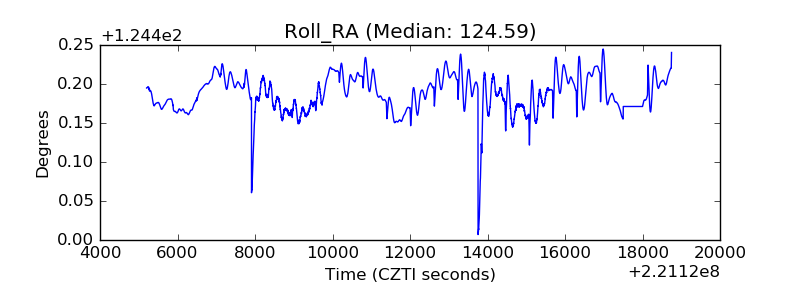 |
| Veto Counter | 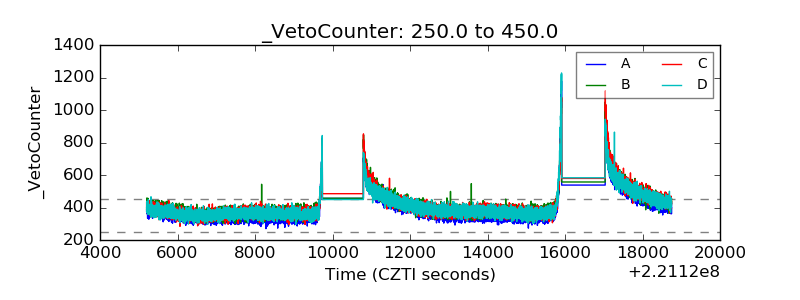 |