| Param | Original file | Final file |
|---|---|---|
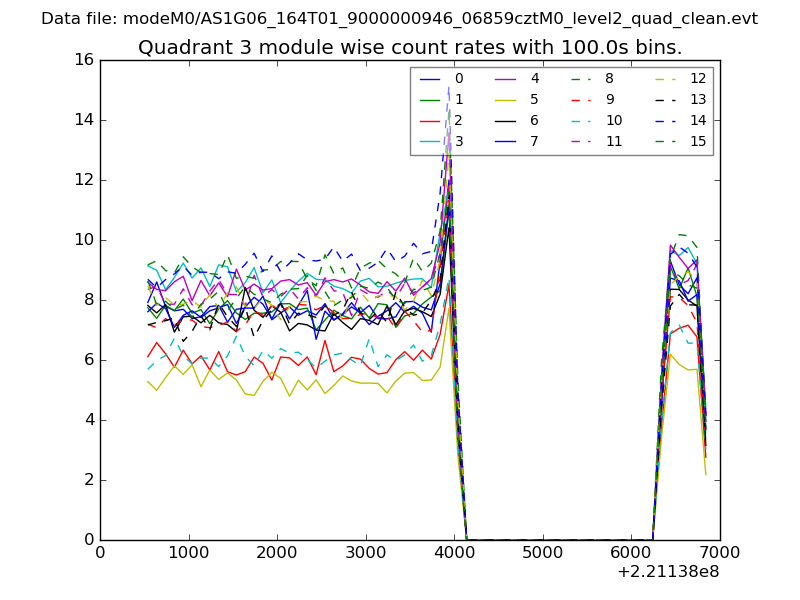
| Filename | modeM0/AS1G06_164T01_9000000946_06859cztM0_level2.evt | modeM0/AS1G06_164T01_9000000946_06859cztM0_level2_quad_clean.evt |
| Size (bytes) | 472,302,720 | 84,660,480 |
| Size | 450.4 MB | 80.7 MB |
| Events in quadrant A | 3,356,990 | 537,152 |
| Events in quadrant B | 3,424,716 | 535,947 |
| Events in quadrant C | 3,394,867 | 519,230 |
| Events in quadrant D | 3,676,682 | 509,217 |
| Mode M0 | |||
|---|---|---|---|
| Quadrant | BADHDUFLAG | Total packets | Discarded packets |
| A | 0 | 14260 | 3 |
| B | 0 | 14359 | 2 |
| C | 0 | 14189 | 2 |
| D | 0 | 15105 | 2 |
| Mode M9 | |||
|---|---|---|---|
| Quadrant | BADHDUFLAG | Total packets | Discarded packets |
| A | 0 | 20 | 0 |
| B | 0 | 20 | 0 |
| C | 0 | 20 | 0 |
| D | 0 | 21 | 0 |
| Mode SS | |||
|---|---|---|---|
| Quadrant | BADHDUFLAG | Total packets | Discarded packets |
| A | 0 | 132 | 0 |
| B | 0 | 132 | 0 |
| C | 0 | 132 | 0 |
| D | 0 | 132 | 0 |
| Quadrant | Total seconds | Saturated seconds | Saturation percentage |
|---|---|---|---|
| A | 6637 | 147 | 2.214856% |
| B | 6637 | 148 | 2.229923% |
| C | 6637 | 126 | 1.898448% |
| D | 6637 | 132 | 1.988850% |
Noise dominated data is calculated using 1-second bins in cleaned event files. If a bin has >2000 counts, and if more than 50% of those come from <1% of pixels, then it is considered to be noise-dominated and hence unusable.
| Quadrant | # 1 sec bins | Bins with >0 counts | Bins with >2000 counts | High rate bins dominated by noise | Noise dominated (total time) | Noise dominated (detector-on time) | Marked lightcurve |
|---|---|---|---|---|---|---|---|
| A | 7847 | 6637 | 0 | 0 | 0.00% | 0.00% | 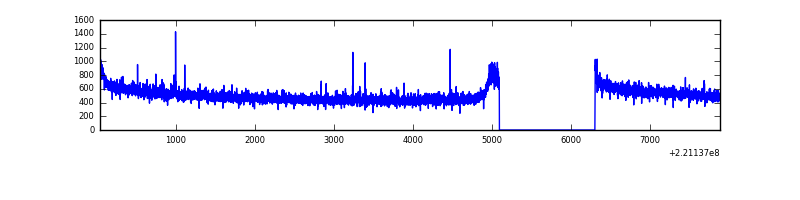 |
| B | 7847 | 6638 | 7 | 7 | 0.09% | 0.11% | 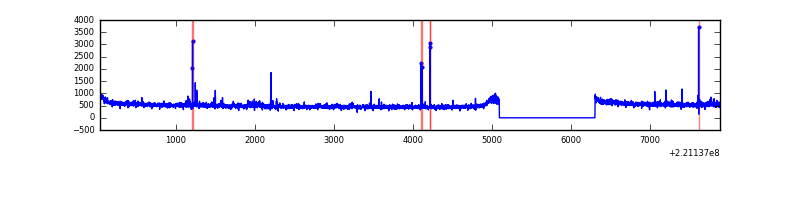 |
| C | 7847 | 6638 | 0 | 0 | 0.00% | 0.00% | 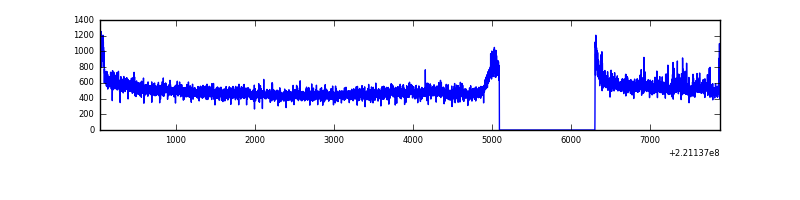 |
| D | 7847 | 6638 | 10 | 10 | 0.13% | 0.15% | 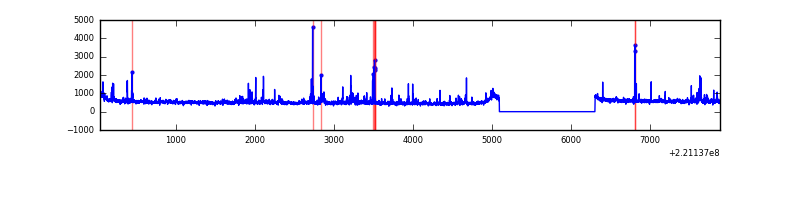 |
Top three noisy pixels from each quadrant. If the there are fewer than three noisy pixels in the level2.evt file, extra rows are filled as -1
| Pixel properties | Quadrant properties | ||||||
|---|---|---|---|---|---|---|---|
| Quadrant | DetID | PixID | Counts | Sigma | Mean | Median | Sigma |
| A | 13 | 251 | 31746 | 179.53 | 858 | 840 | 172.1 |
| A | 13 | 248 | 11062 | 59.38 | 858 | 840 | 172.1 |
| A | 0 | 226 | 8283 | 43.24 | 858 | 840 | 172.1 |
| B | 4 | 48 | 33137 | 202.45 | 855 | 836 | 159.6 |
| B | 15 | 204 | 30792 | 187.75 | 855 | 836 | 159.6 |
| B | 0 | 219 | 25766 | 156.25 | 855 | 836 | 159.6 |
| C | 9 | 247 | 110838 | 580.5 | 827 | 832 | 189.5 |
| C | 9 | 68 | 39629 | 204.73 | 827 | 832 | 189.5 |
| C | 9 | 16 | 14477 | 72.0 | 827 | 832 | 189.5 |
| D | 8 | 195 | 253749 | 1260.26 | 833 | 808 | 200.7 |
| D | 13 | 169 | 76021 | 374.74 | 833 | 808 | 200.7 |
| D | 14 | 34 | 50277 | 246.48 | 833 | 808 | 200.7 |
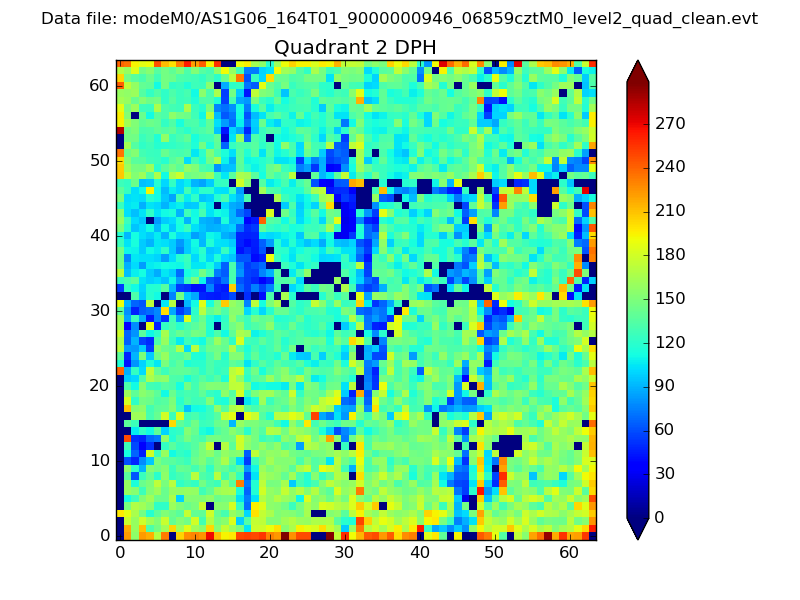
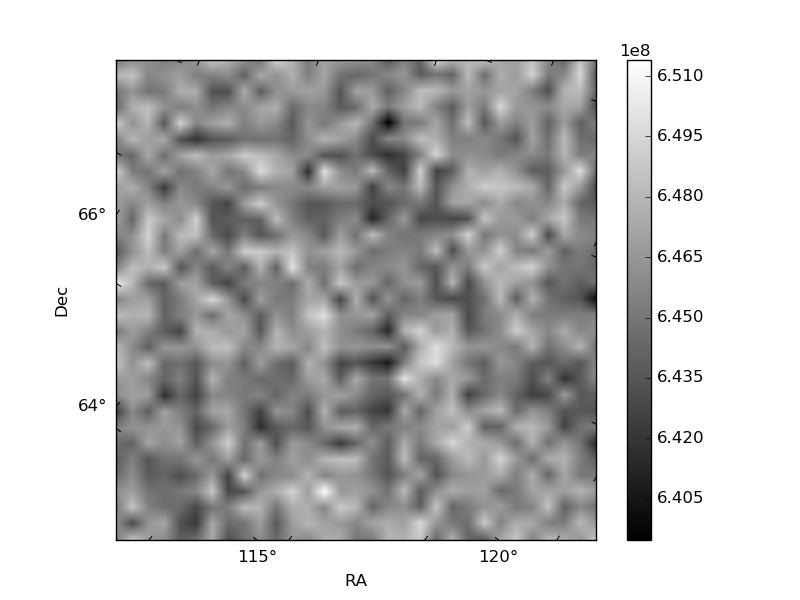
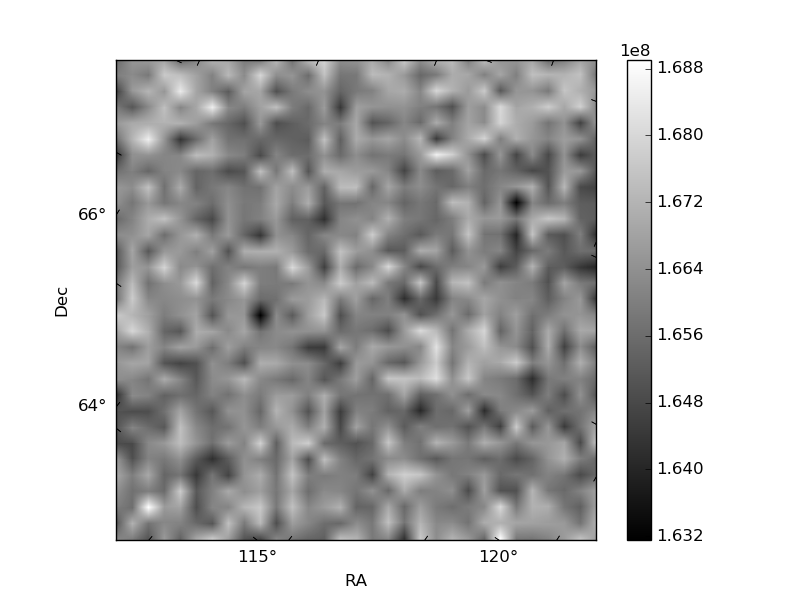
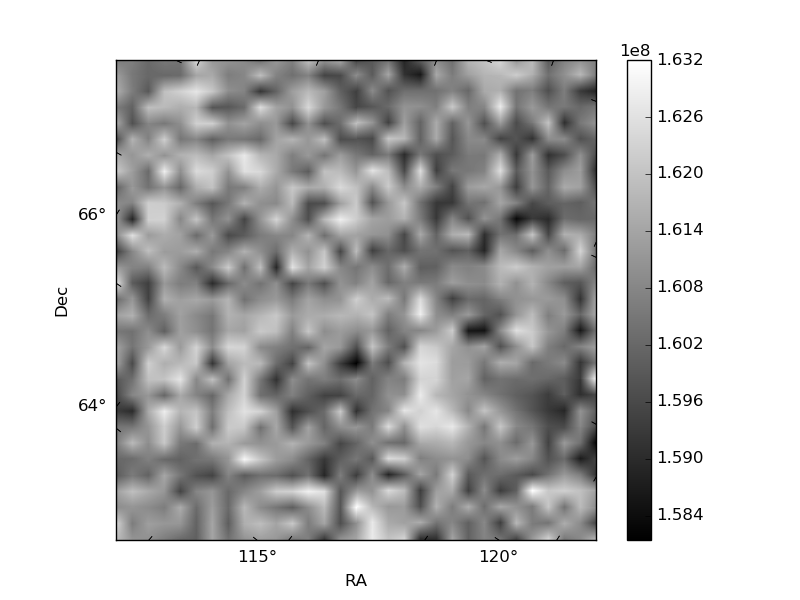
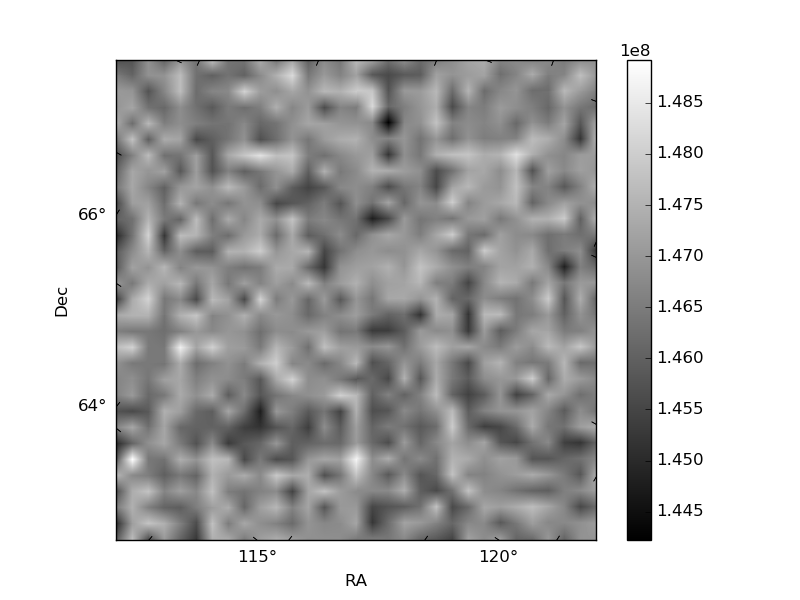
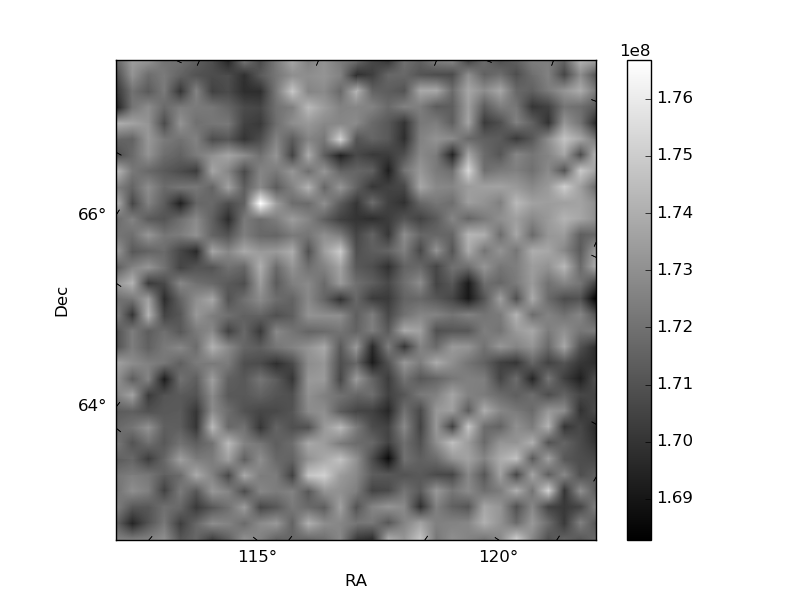
Histogram calculated using DETX and DETY for each event in the final _common_clean file
| Quadrant A | 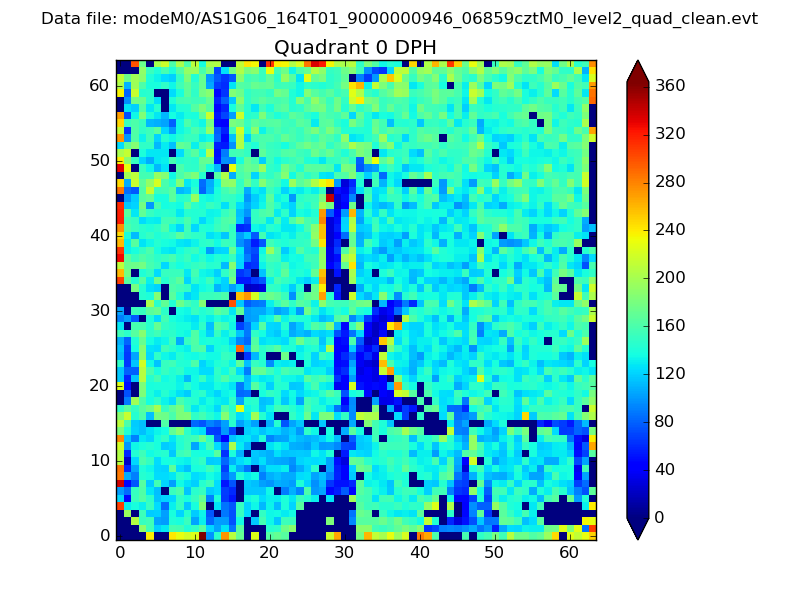 |
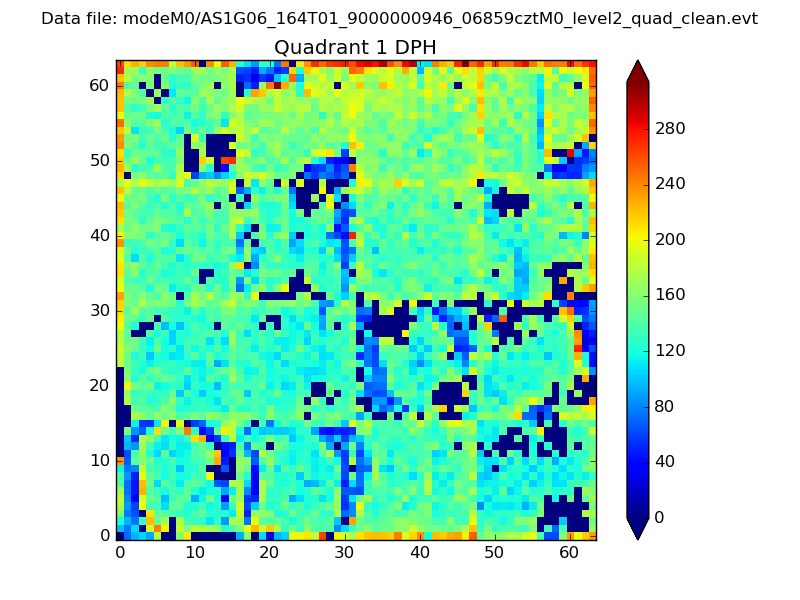 |
Quadrant B |
|---|---|---|---|
| Quadrant D | 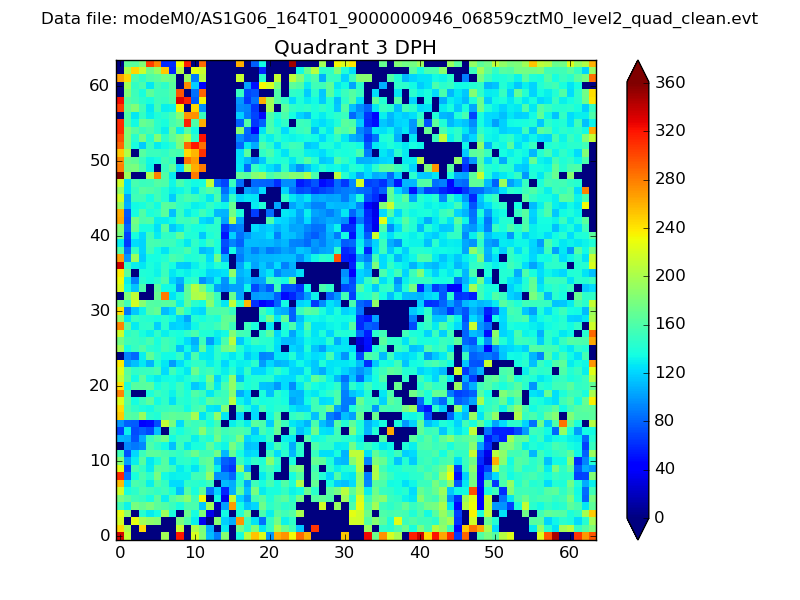 |
 |
Quadrant C |
| Plot type | Count rate plots | Images |
|---|---|---|
| Comparison with Poisson distribution Blue bars denote a histogram of data divided into 1 sec bins. Red curve is a Poisson curve with rate = median count rate of data. |
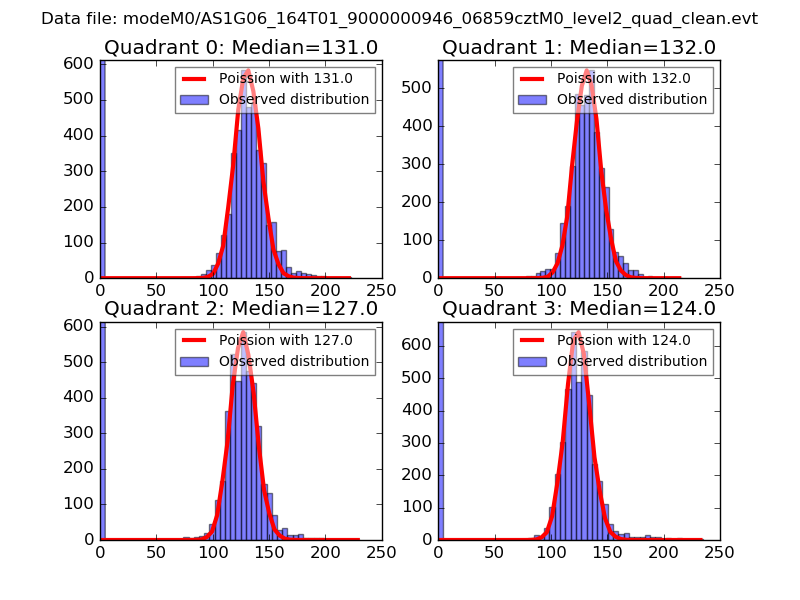 |
 |
| Quadrant-wise count rates Data is divided into 100 sec bins |
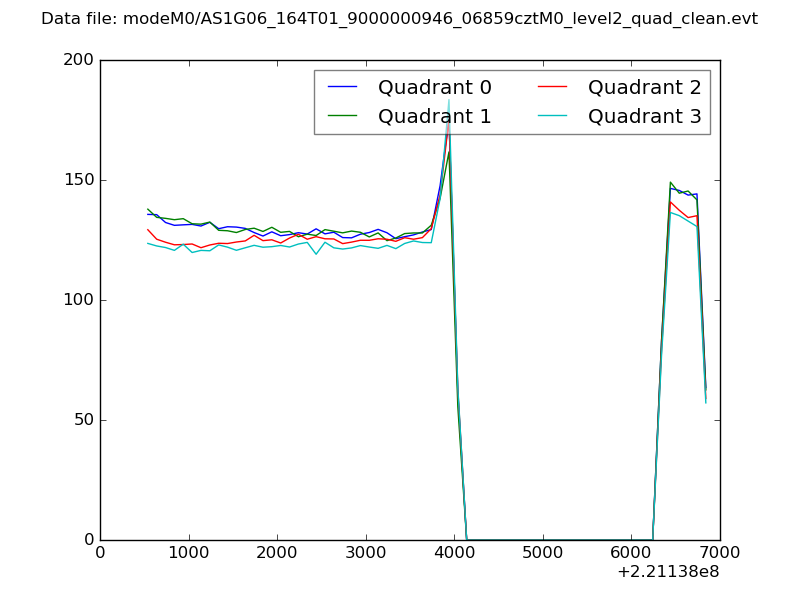 |
|
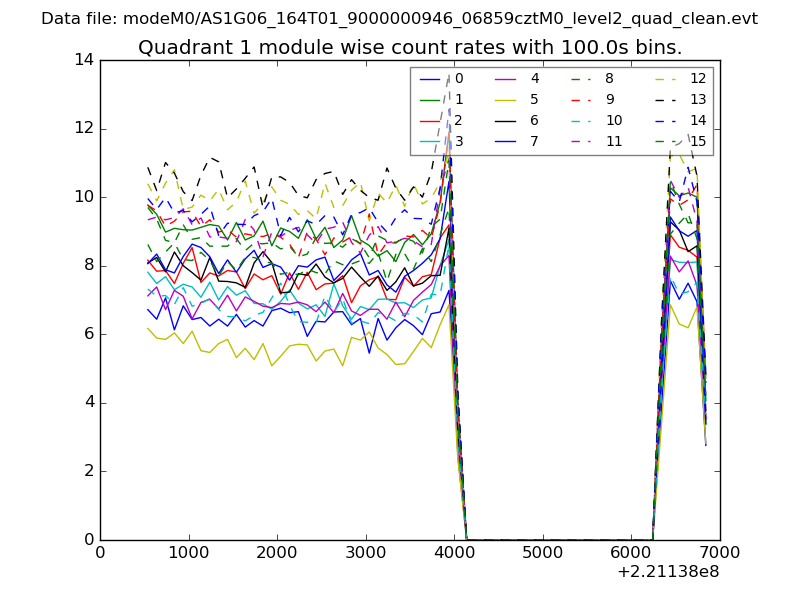
| Module-wise count rates for Quadrant A Data is divided into 100 sec bins |
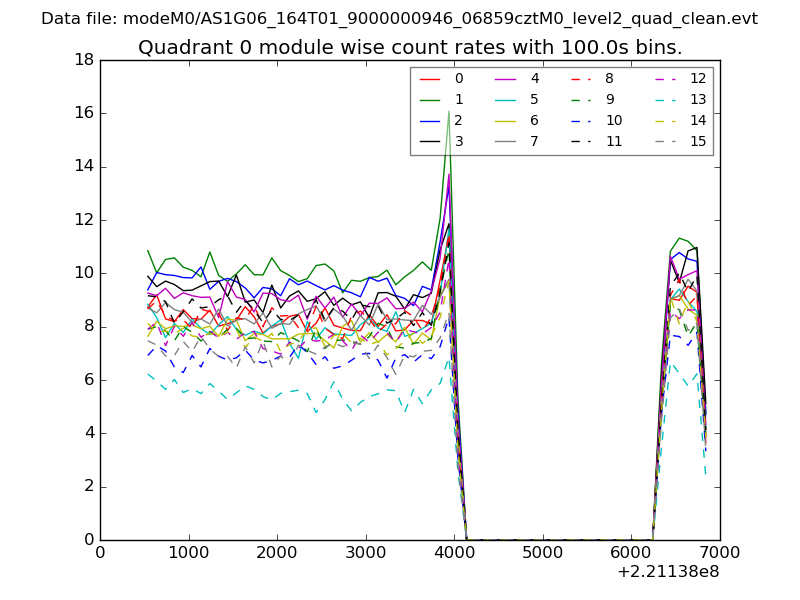 |
 |
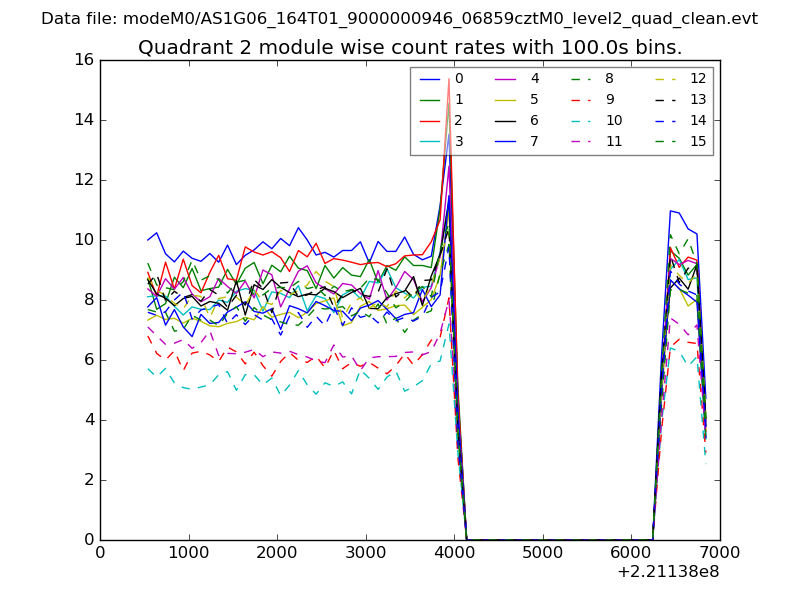
| Module-wise count rates for Quadrant B Data is divided into 100 sec bins |
 |
 |
| Module-wise count rates for Quadrant C Data is divided into 100 sec bins |
 |
 |
| Module-wise count rates for Quadrant D Data is divided into 100 sec bins |
 |
 |
| Parameter | Plot |
|---|---|
| CZT HV Monitor | 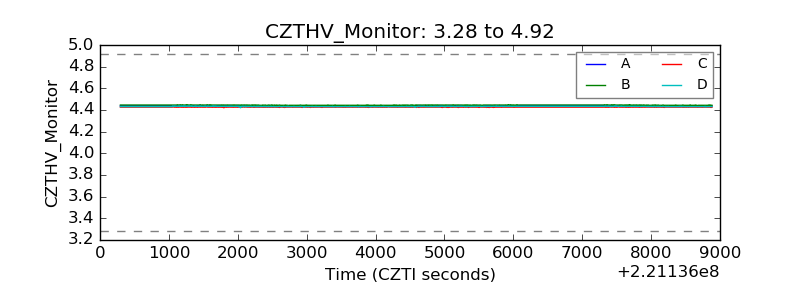 |
| D_VDD | 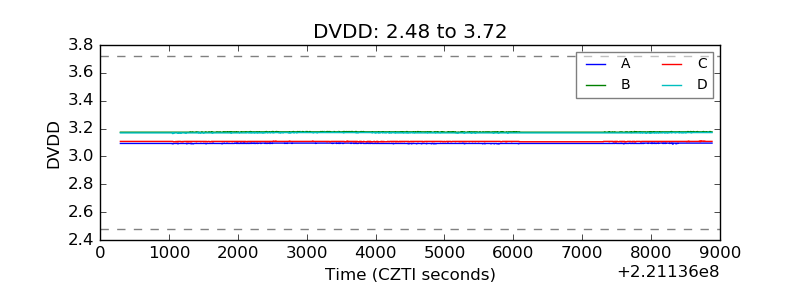 |
| Temperature 1 | 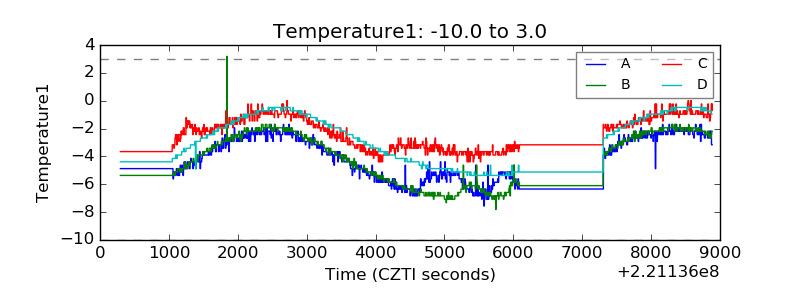 |
| Veto HV Monitor | 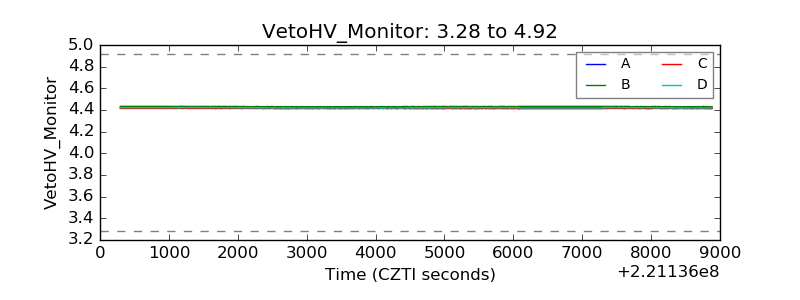 |
| Veto LLD | 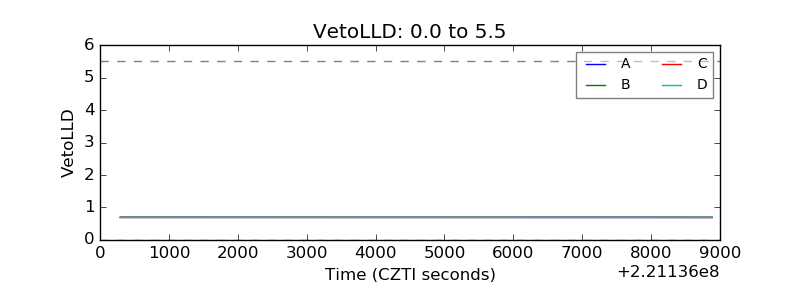 |
| Alpha Counter | 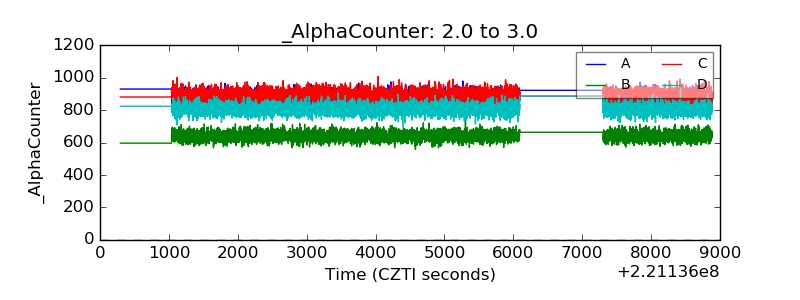 |
| _CPM_Rate | 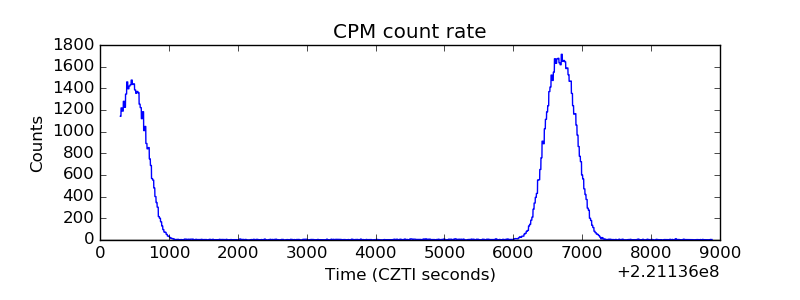 |
| CZT Counter | 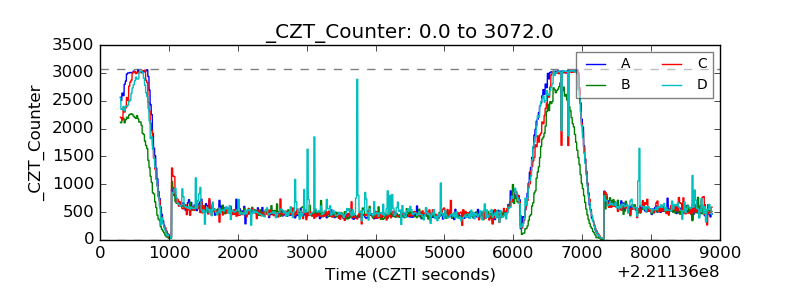 |
| +2.5 Volts monitor |  |
| +5 Volts monitor |  |
| _ROLL_ROT | 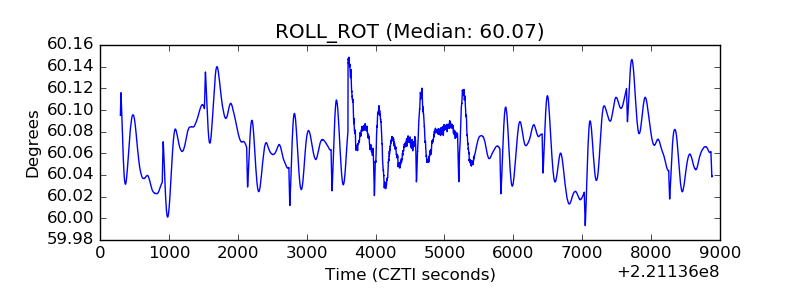 |
| _Roll_DEC | 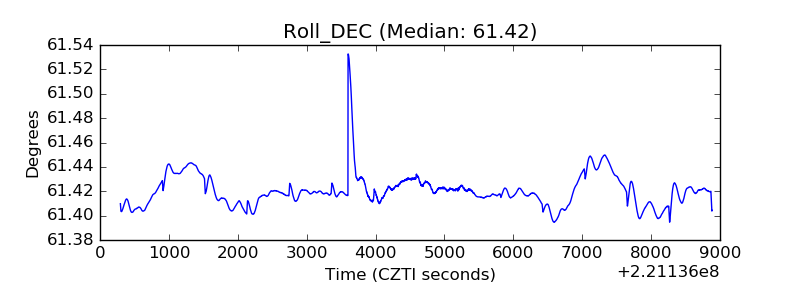 |
| _Roll_RA | 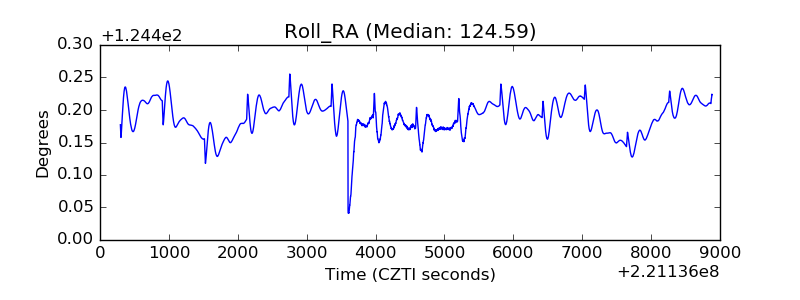 |
| Veto Counter | 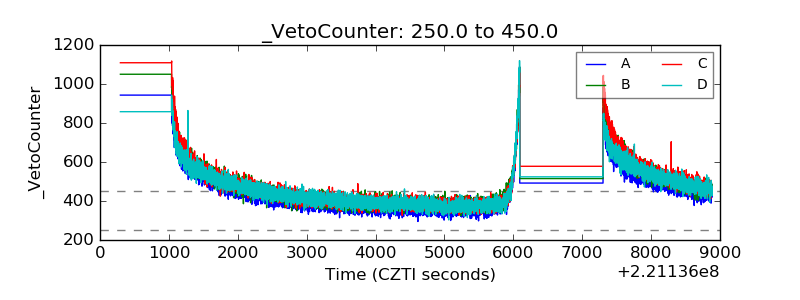 |