| Param | Original file | Final file |
|---|---|---|
| Filename | modeM0/AS1A02_103T01_9000000950_06932cztM0_level2.evt | modeM0/AS1A02_103T01_9000000950_06932cztM0_level2_quad_clean.evt |
| Size (bytes) | 704,013,120 | 62,173,440 |
| Size | 671.4 MB | 59.3 MB |
| Events in quadrant A | 3,288,507 | 393,361 |
| Events in quadrant B | 3,765,721 | 394,127 |
| Events in quadrant C | 10,026,470 | 266,826 |
| Events in quadrant D | 3,803,914 | 377,275 |
| Mode SS | |||
|---|---|---|---|
| Quadrant | BADHDUFLAG | Total packets | Discarded packets |
| A | 0 | 130 | 0 |
| B | 0 | 130 | 0 |
| C | 0 | 130 | 0 |
| D | 0 | 130 | 0 |
| Mode M9 | |||
|---|---|---|---|
| Quadrant | BADHDUFLAG | Total packets | Discarded packets |
| A | 0 | 18 | 0 |
| B | 0 | 18 | 0 |
| C | 0 | 18 | 0 |
| D | 0 | 19 | 0 |
| Mode M0 | |||
|---|---|---|---|
| Quadrant | BADHDUFLAG | Total packets | Discarded packets |
| A | 0 | 13703 | 3 |
| B | 0 | 15245 | 2 |
| C | 0 | 34321 | 2 |
| D | 0 | 15350 | 2 |
| Quadrant | Total seconds | Saturated seconds | Saturation percentage |
|---|---|---|---|
| A | 6453 | 89 | 1.379203% |
| B | 6453 | 117 | 1.813110% |
| C | 6453 | 2851 | 44.181001% |
| D | 6453 | 100 | 1.549667% |
Noise dominated data is calculated using 1-second bins in cleaned event files. If a bin has >2000 counts, and if more than 50% of those come from <1% of pixels, then it is considered to be noise-dominated and hence unusable.
| Quadrant | # 1 sec bins | Bins with >0 counts | Bins with >2000 counts | High rate bins dominated by noise | Noise dominated (total time) | Noise dominated (detector-on time) | Marked lightcurve |
|---|---|---|---|---|---|---|---|
| A | 7733 | 6454 | 0 | 0 | 0.00% | 0.00% | 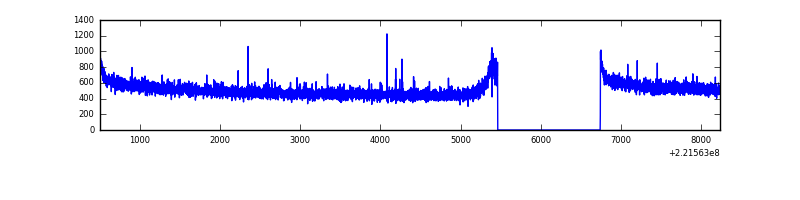 |
| B | 7733 | 6454 | 10 | 10 | 0.13% | 0.15% | 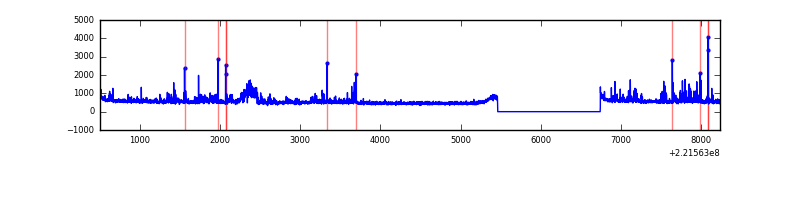 |
| C | 7733 | 6453 | 2342 | 2342 | 30.29% | 36.29% | 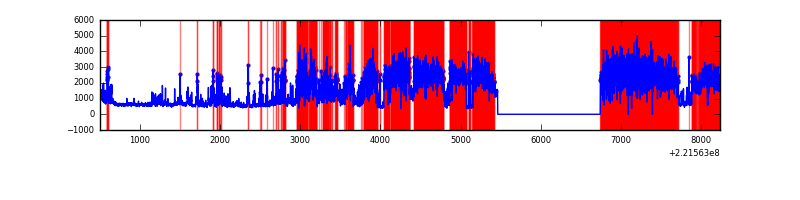 |
| D | 7733 | 6454 | 15 | 15 | 0.19% | 0.23% | 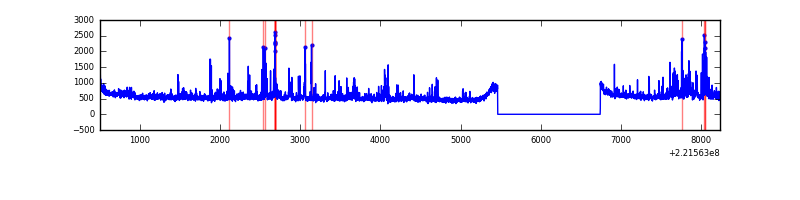 |
Top three noisy pixels from each quadrant. If the there are fewer than three noisy pixels in the level2.evt file, extra rows are filled as -1
| Pixel properties | Quadrant properties | ||||||
|---|---|---|---|---|---|---|---|
| Quadrant | DetID | PixID | Counts | Sigma | Mean | Median | Sigma |
| A | 0 | 226 | 8153 | 42.89 | 851 | 835 | 170.6 |
| A | 12 | 194 | 8126 | 42.74 | 851 | 835 | 170.6 |
| A | 13 | 14 | 4880 | 23.71 | 851 | 835 | 170.6 |
| B | 0 | 228 | 268244 | 1683.45 | 847 | 830 | 158.8 |
| B | 4 | 48 | 124844 | 780.71 | 847 | 830 | 158.8 |
| B | 0 | 214 | 32942 | 202.15 | 847 | 830 | 158.8 |
| C | 9 | 247 | 7604142 | 53946.8 | 615 | 619 | 140.9 |
| C | 10 | 22 | 13547 | 91.72 | 615 | 619 | 140.9 |
| C | 12 | 4 | 6972 | 45.07 | 615 | 619 | 140.9 |
| D | 8 | 195 | 218878 | 1092.05 | 829 | 805 | 199.7 |
| D | 2 | 136 | 169884 | 846.7 | 829 | 805 | 199.7 |
| D | 2 | 152 | 93386 | 463.62 | 829 | 805 | 199.7 |
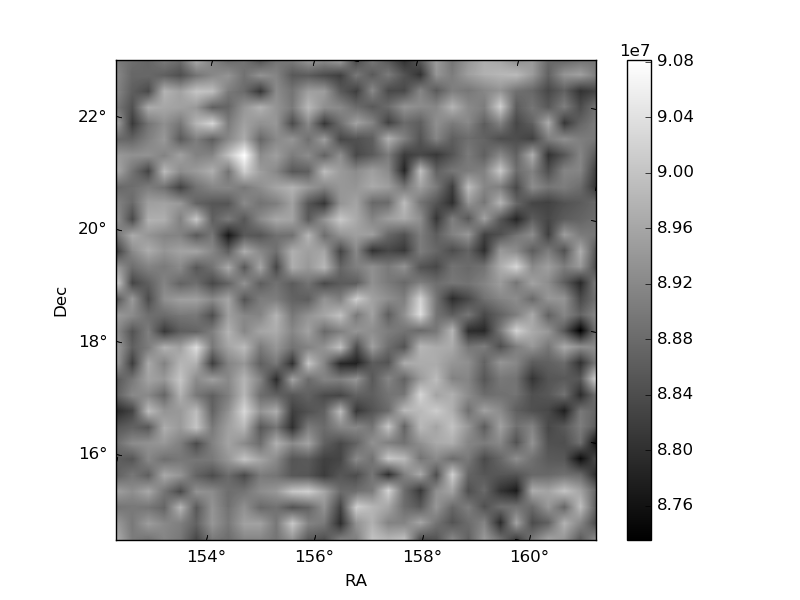
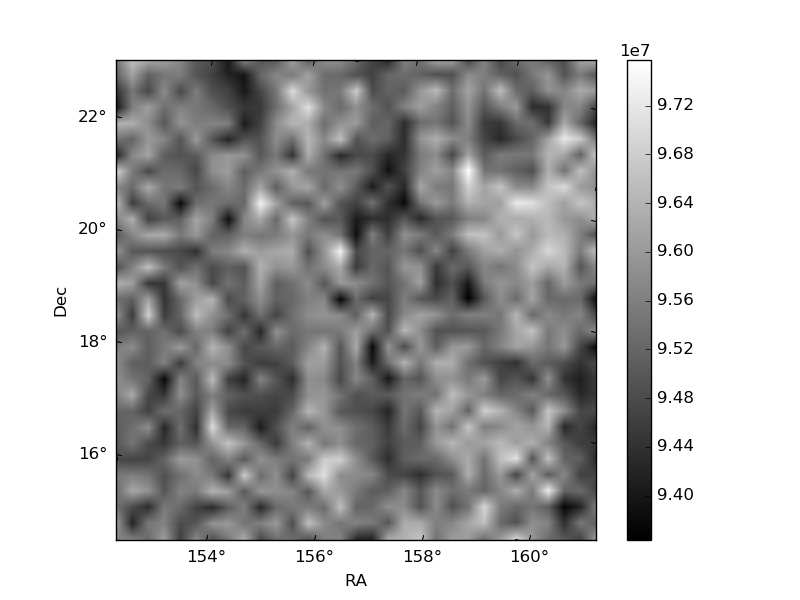
Histogram calculated using DETX and DETY for each event in the final _common_clean file
| Quadrant A | 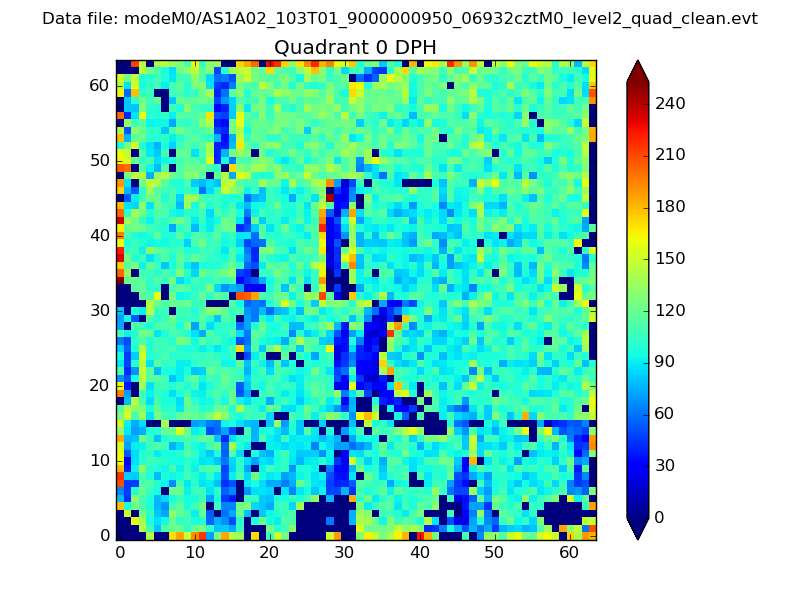 |
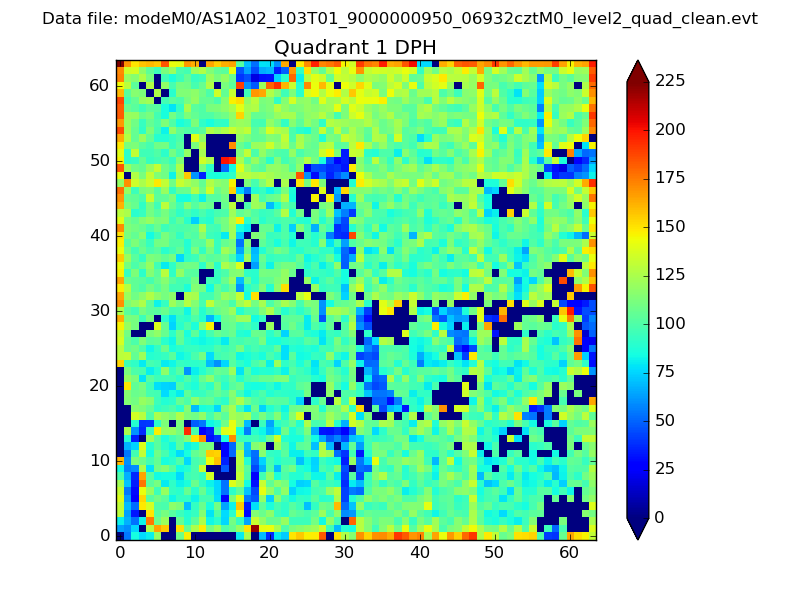 |
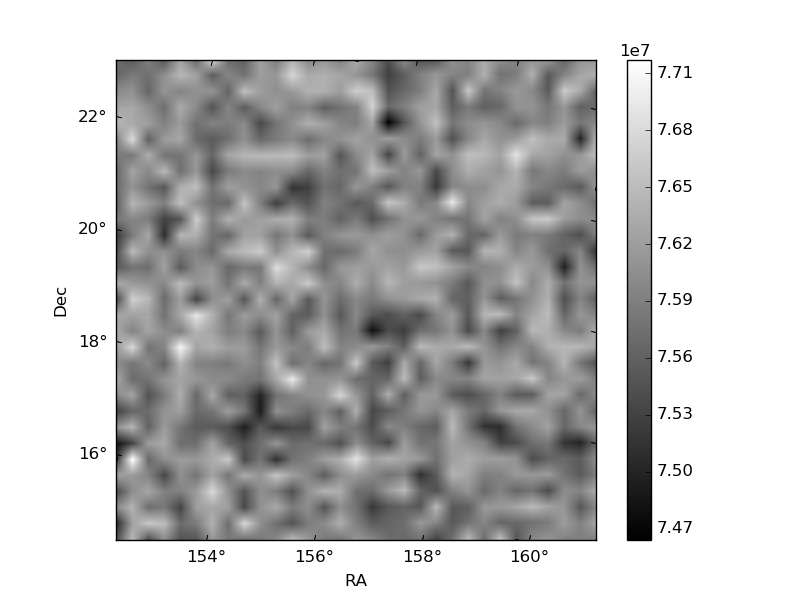
Quadrant B |
|---|---|---|---|
| Quadrant D | 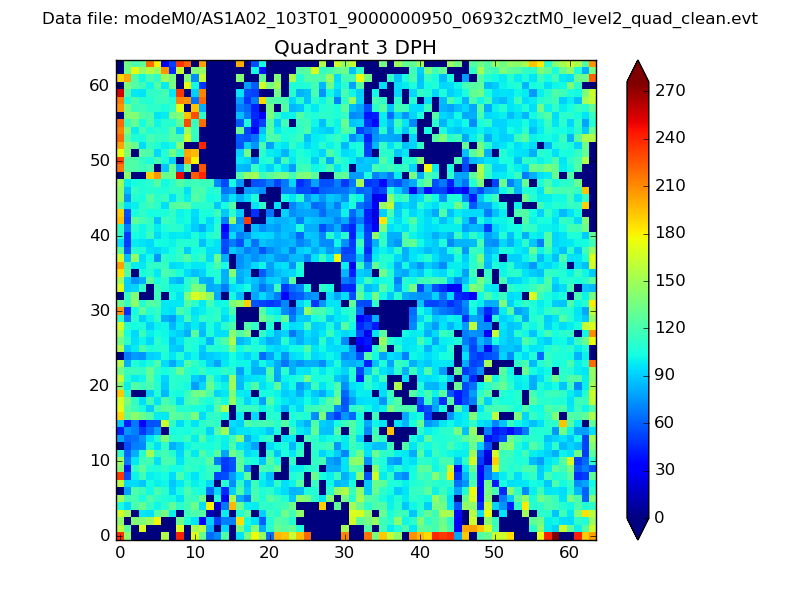 |
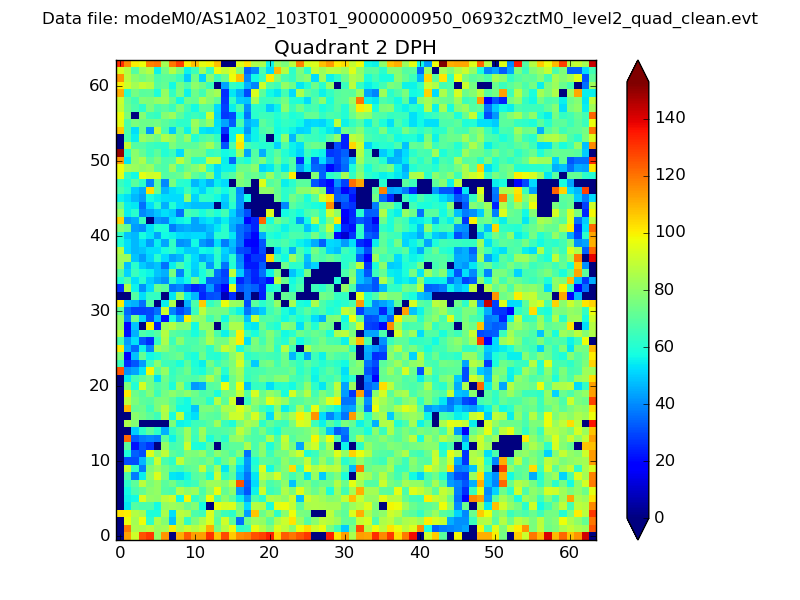 |
Quadrant C |
| Plot type | Count rate plots | Images |
|---|---|---|
| Comparison with Poisson distribution Blue bars denote a histogram of data divided into 1 sec bins. Red curve is a Poisson curve with rate = median count rate of data. |
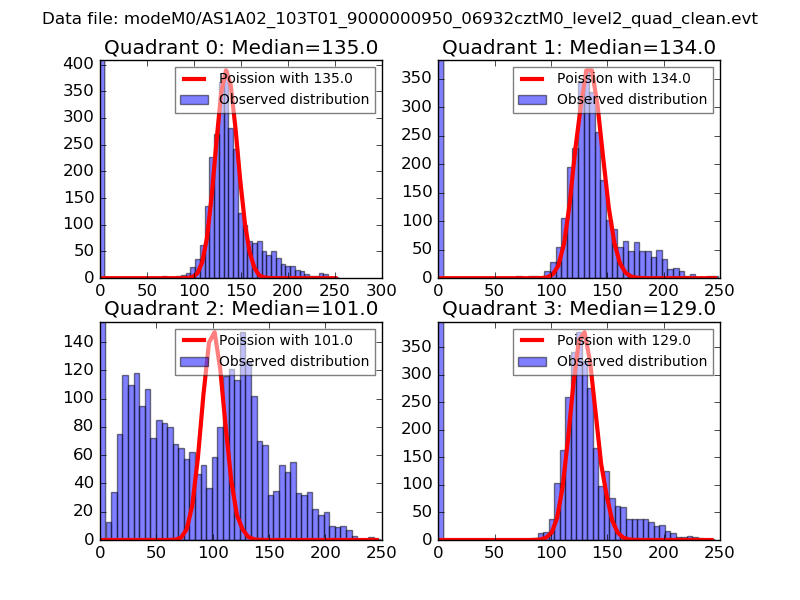 |
 |
| Quadrant-wise count rates Data is divided into 100 sec bins |
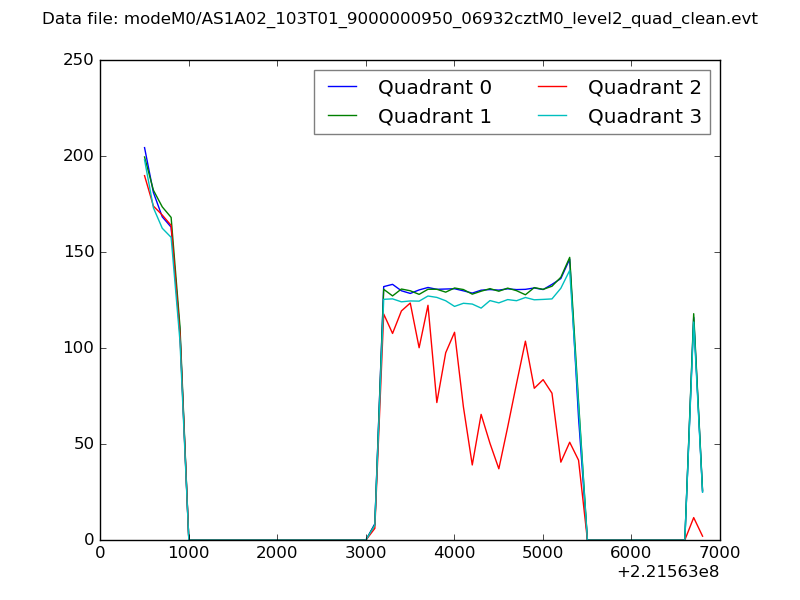 |
|
| Module-wise count rates for Quadrant A Data is divided into 100 sec bins |
 |
 |
| Module-wise count rates for Quadrant B Data is divided into 100 sec bins |
 |
 |
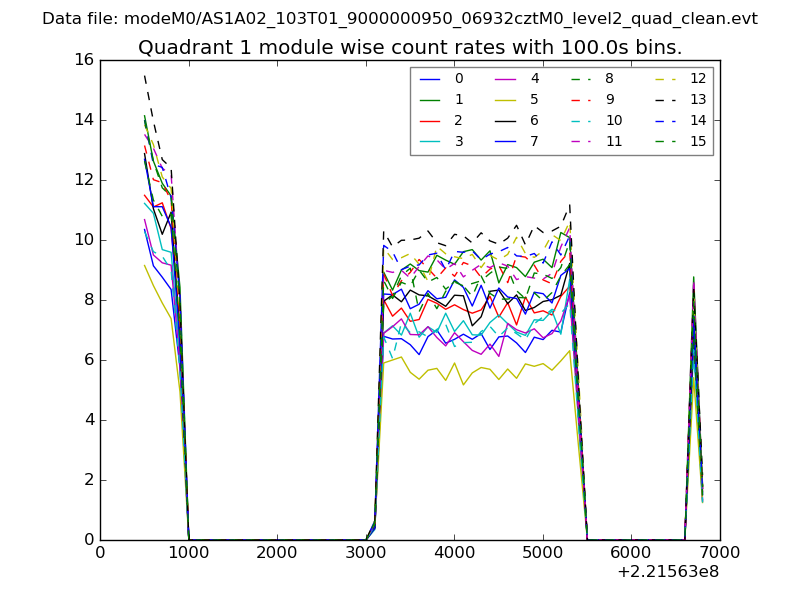
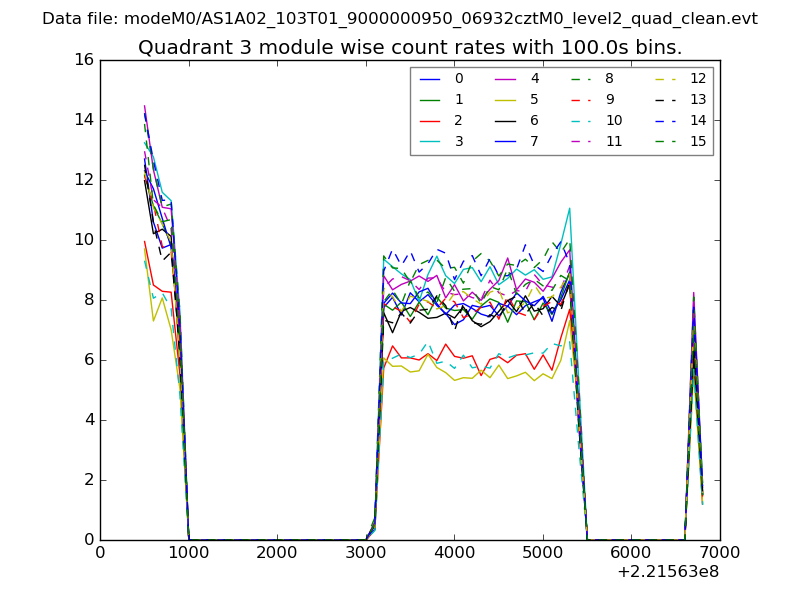
| Module-wise count rates for Quadrant C Data is divided into 100 sec bins |
 |
 |
| Module-wise count rates for Quadrant D Data is divided into 100 sec bins |
 |
 |
| Parameter | Plot |
|---|---|
| CZT HV Monitor | 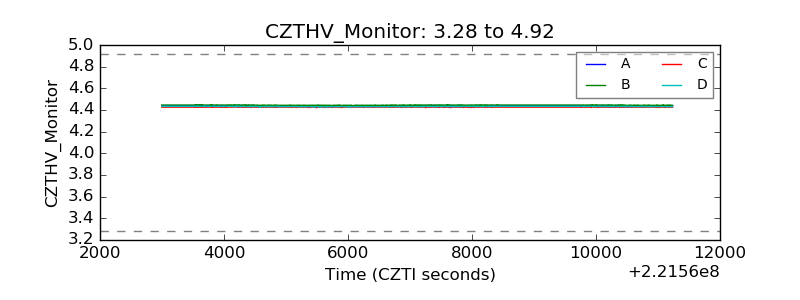 |
| D_VDD | 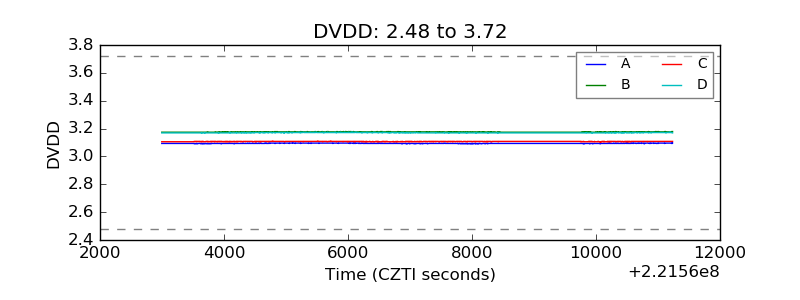 |
| Temperature 1 | 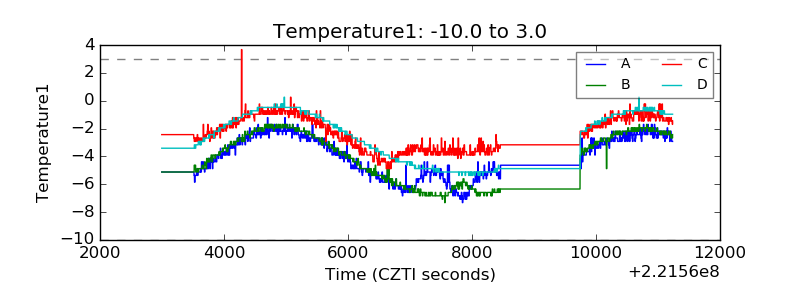 |
| Veto HV Monitor | 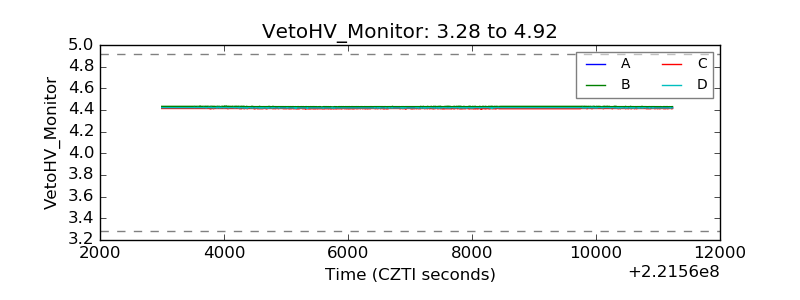 |
| Veto LLD | 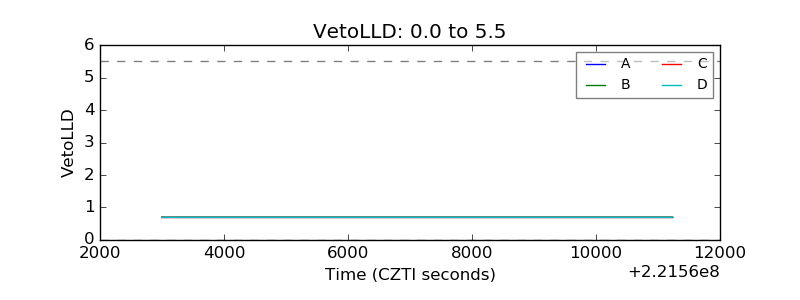 |
| Alpha Counter | 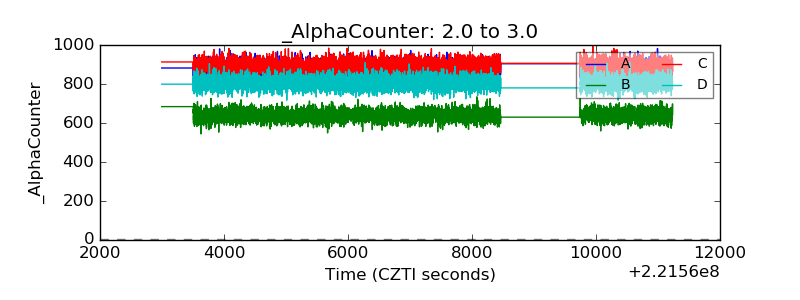 |
| _CPM_Rate | 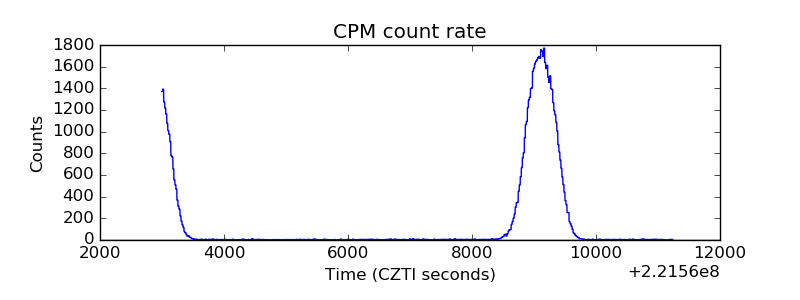 |
| CZT Counter | 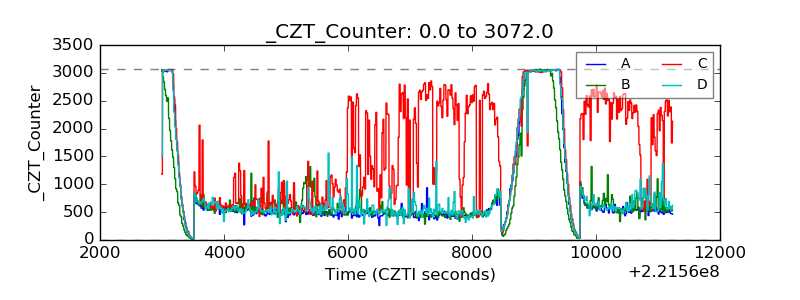 |
| +2.5 Volts monitor |  |
| +5 Volts monitor | 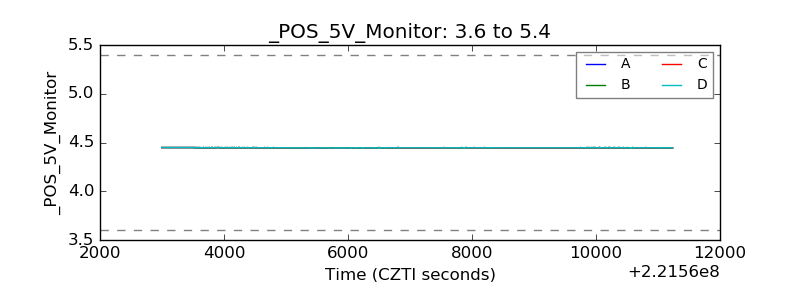 |
| _ROLL_ROT | 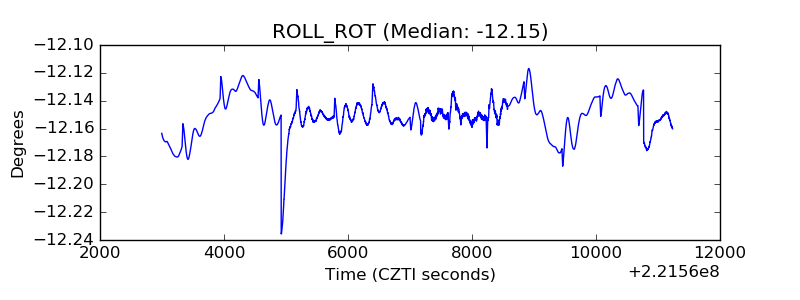 |
| _Roll_DEC | 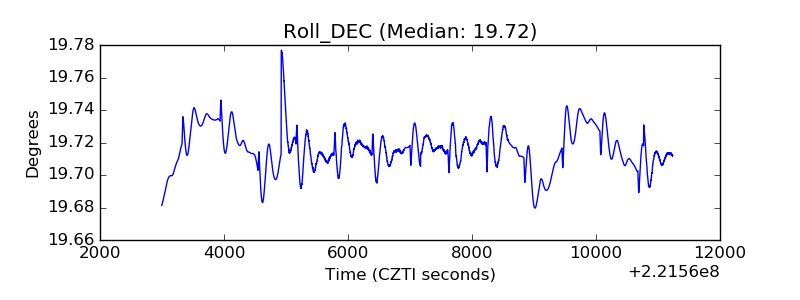 |
| _Roll_RA | 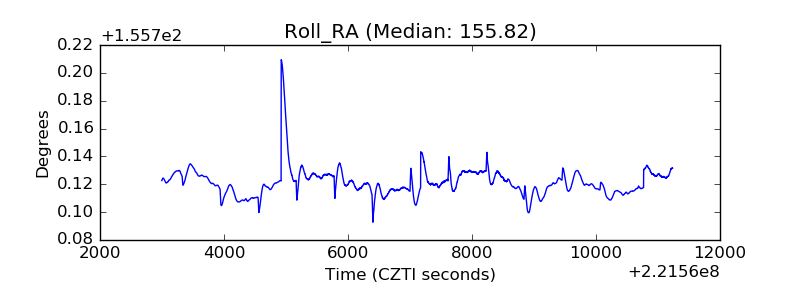 |
| Veto Counter | 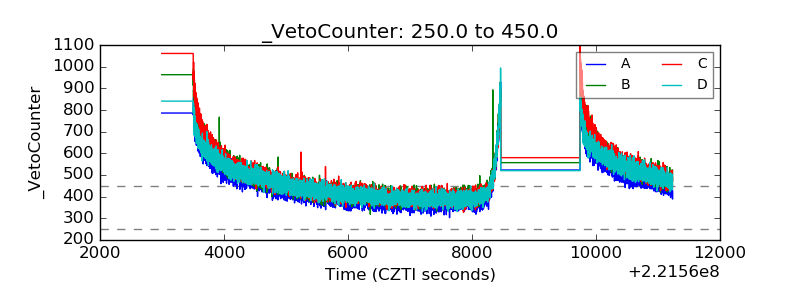 |