| Param | Original file | Final file |
|---|---|---|
| Filename | modeM0/AS1A02_103T01_9000000950_06933cztM0_level2.evt | modeM0/AS1A02_103T01_9000000950_06933cztM0_level2_quad_clean.evt |
| Size (bytes) | 751,386,240 | 61,493,760 |
| Size | 716.6 MB | 58.6 MB |
| Events in quadrant A | 3,352,359 | 366,242 |
| Events in quadrant B | 3,796,880 | 367,840 |
| Events in quadrant C | 11,090,534 | 318,441 |
| Events in quadrant D | 4,074,019 | 353,405 |
| Mode SS | |||
|---|---|---|---|
| Quadrant | BADHDUFLAG | Total packets | Discarded packets |
| A | 0 | 134 | 0 |
| B | 0 | 134 | 0 |
| C | 0 | 134 | 0 |
| D | 0 | 134 | 0 |
| Mode M9 | |||
|---|---|---|---|
| Quadrant | BADHDUFLAG | Total packets | Discarded packets |
| A | 0 | 18 | 0 |
| B | 0 | 18 | 0 |
| C | 0 | 18 | 0 |
| D | 0 | 19 | 0 |
| Mode M0 | |||
|---|---|---|---|
| Quadrant | BADHDUFLAG | Total packets | Discarded packets |
| A | 0 | 13918 | 3 |
| B | 0 | 15405 | 2 |
| C | 0 | 37569 | 2 |
| D | 0 | 16438 | 2 |
| Quadrant | Total seconds | Saturated seconds | Saturation percentage |
|---|---|---|---|
| A | 6527 | 122 | 1.869159% |
| B | 6527 | 170 | 2.604566% |
| C | 6527 | 3415 | 52.321128% |
| D | 6527 | 149 | 2.282825% |
Noise dominated data is calculated using 1-second bins in cleaned event files. If a bin has >2000 counts, and if more than 50% of those come from <1% of pixels, then it is considered to be noise-dominated and hence unusable.
| Quadrant | # 1 sec bins | Bins with >0 counts | Bins with >2000 counts | High rate bins dominated by noise | Noise dominated (total time) | Noise dominated (detector-on time) | Marked lightcurve |
|---|---|---|---|---|---|---|---|
| A | 7807 | 6528 | 0 | 0 | 0.00% | 0.00% | 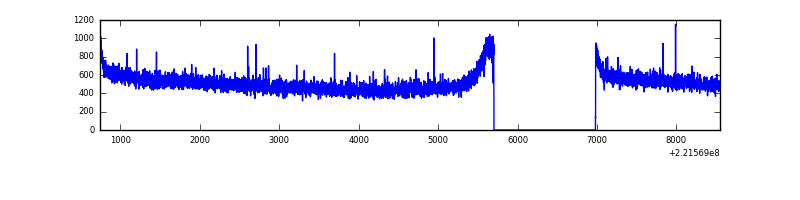 |
| B | 7807 | 6528 | 31 | 31 | 0.40% | 0.47% | 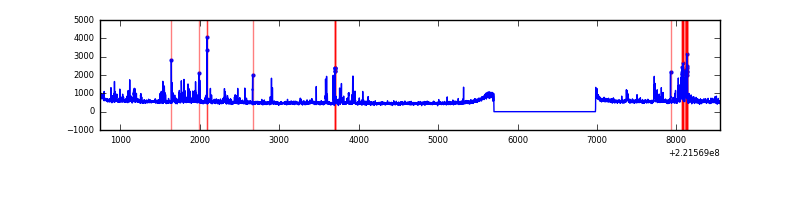 |
| C | 7807 | 6527 | 2745 | 2745 | 35.16% | 42.06% | 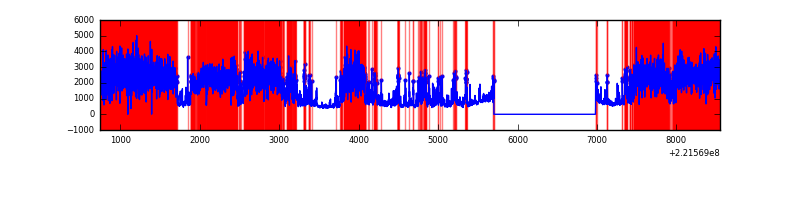 |
| D | 7807 | 6528 | 29 | 29 | 0.37% | 0.44% | 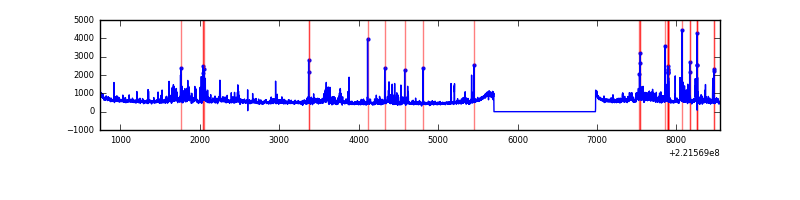 |
Top three noisy pixels from each quadrant. If the there are fewer than three noisy pixels in the level2.evt file, extra rows are filled as -1
| Pixel properties | Quadrant properties | ||||||
|---|---|---|---|---|---|---|---|
| Quadrant | DetID | PixID | Counts | Sigma | Mean | Median | Sigma |
| A | 13 | 14 | 9966 | 52.42 | 865 | 849 | 173.9 |
| A | 0 | 128 | 9222 | 48.14 | 865 | 849 | 173.9 |
| A | 0 | 226 | 8456 | 43.74 | 865 | 849 | 173.9 |
| B | 4 | 48 | 195562 | 1189.79 | 864 | 845 | 163.7 |
| B | 0 | 228 | 164421 | 999.5 | 864 | 845 | 163.7 |
| B | 0 | 214 | 45776 | 274.54 | 864 | 845 | 163.7 |
| C | 9 | 247 | 8741828 | 63396.06 | 597 | 601 | 137.9 |
| C | 1 | 16 | 14252 | 99.0 | 597 | 601 | 137.9 |
| C | 13 | 61 | 4579 | 28.85 | 597 | 601 | 137.9 |
| D | 8 | 195 | 231042 | 1119.54 | 847 | 823 | 205.6 |
| D | 2 | 136 | 201343 | 975.11 | 847 | 823 | 205.6 |
| D | 12 | 233 | 186519 | 903.03 | 847 | 823 | 205.6 |
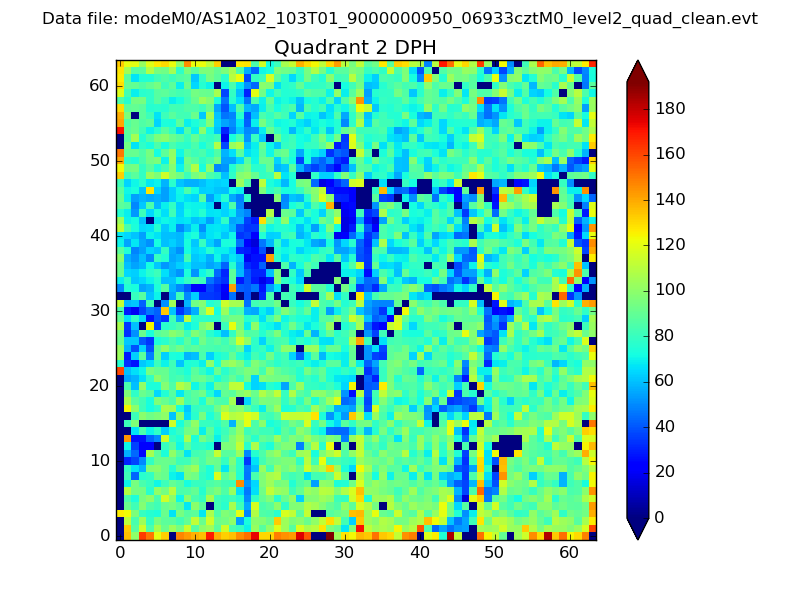
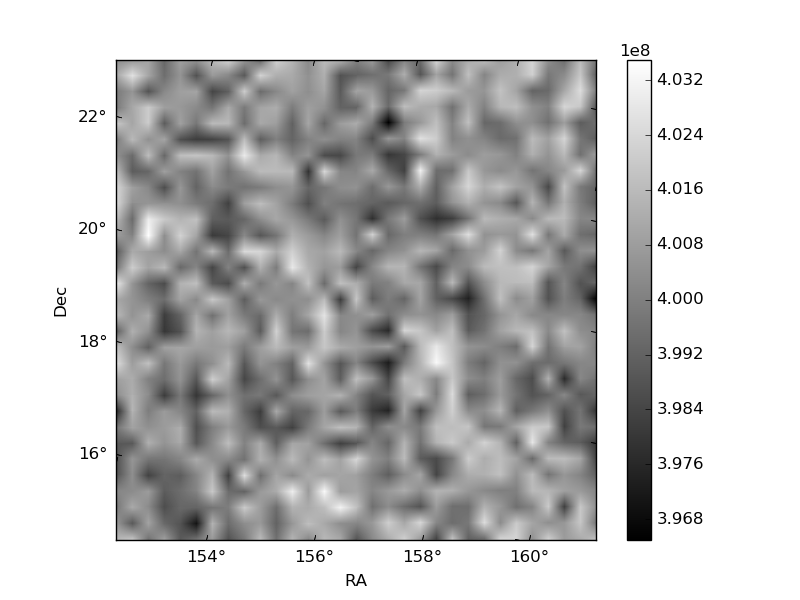
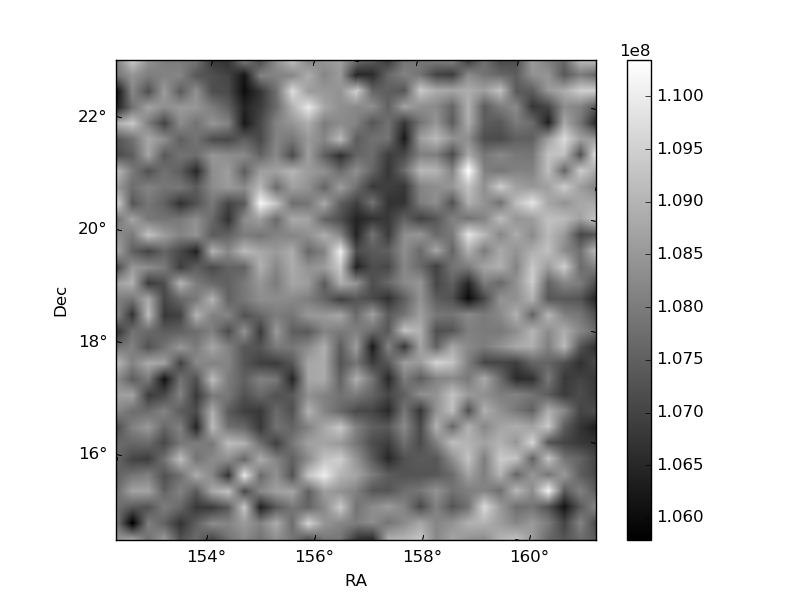
Histogram calculated using DETX and DETY for each event in the final _common_clean file
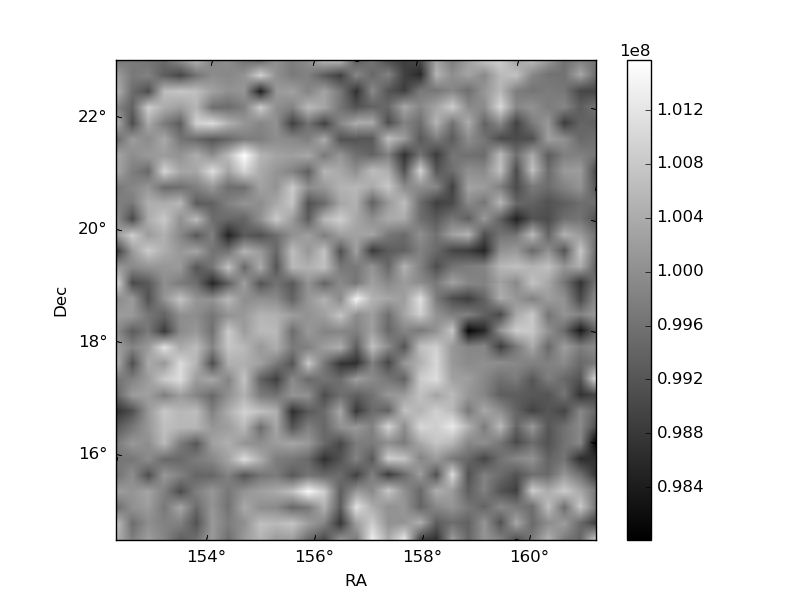
| Quadrant A | 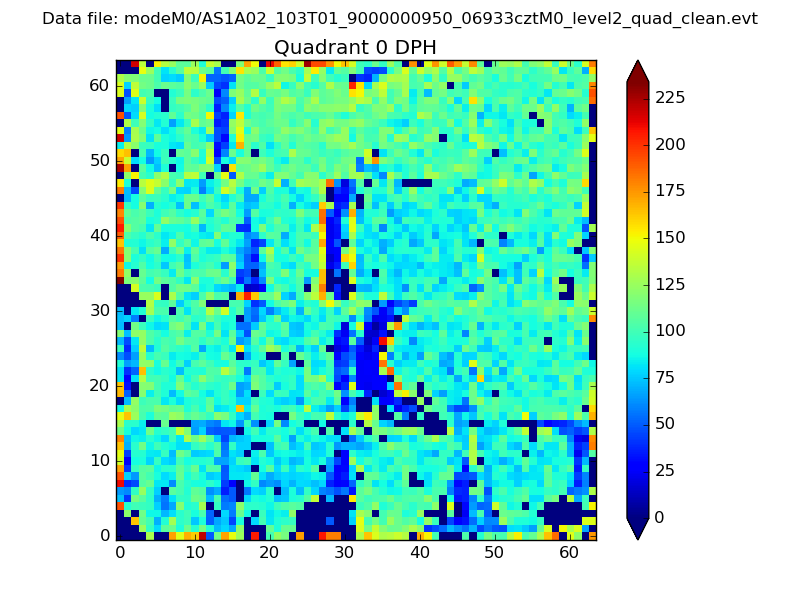 |
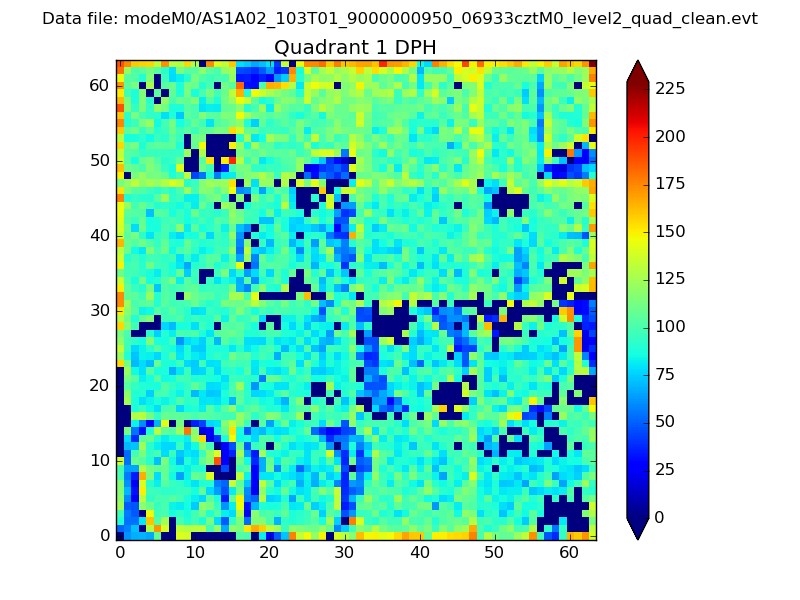 |
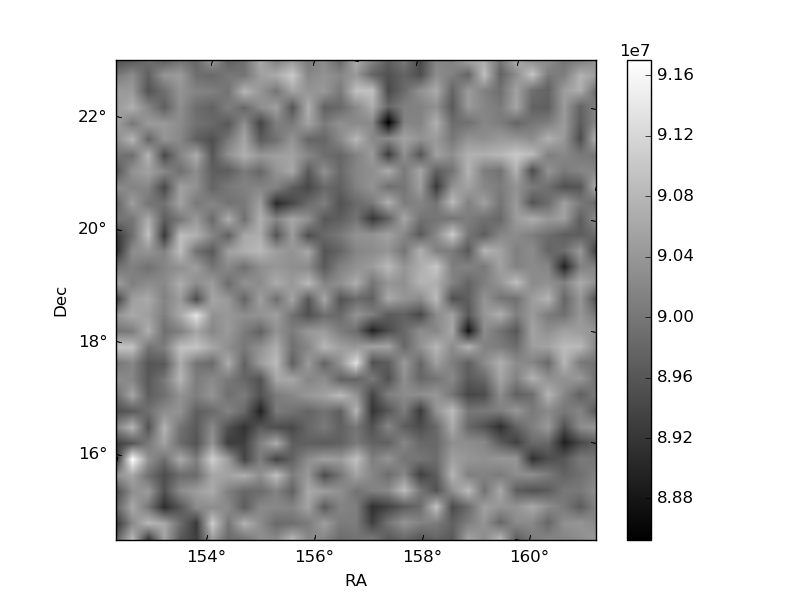
Quadrant B |
|---|---|---|---|
| Quadrant D | 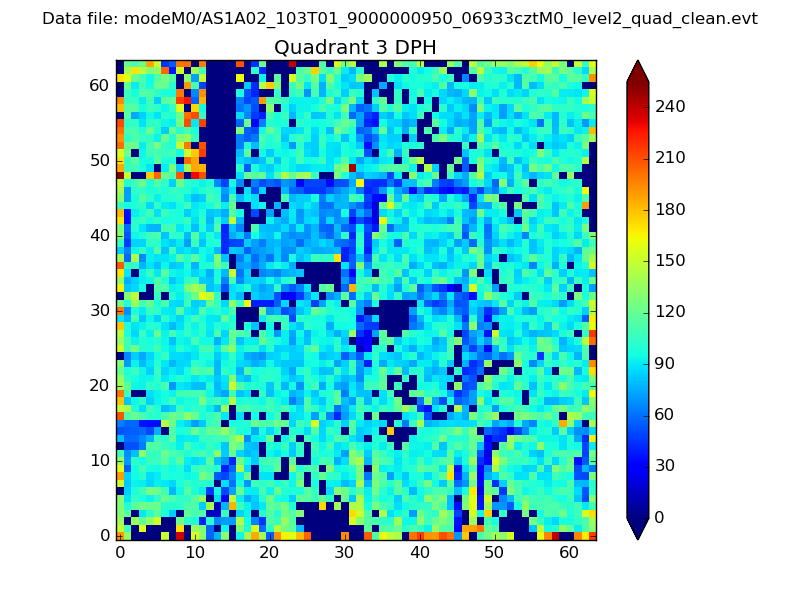 |
 |
Quadrant C |
| Plot type | Count rate plots | Images |
|---|---|---|
| Comparison with Poisson distribution Blue bars denote a histogram of data divided into 1 sec bins. Red curve is a Poisson curve with rate = median count rate of data. |
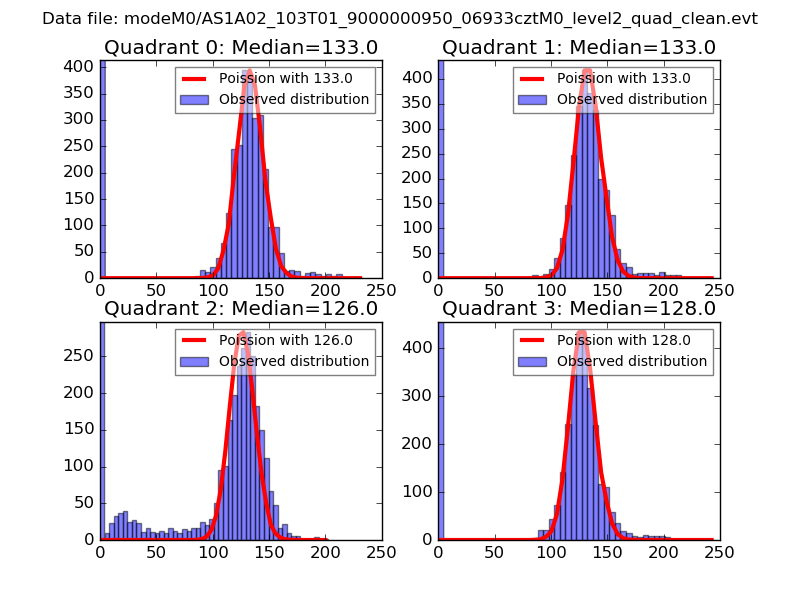 |
 |
| Quadrant-wise count rates Data is divided into 100 sec bins |
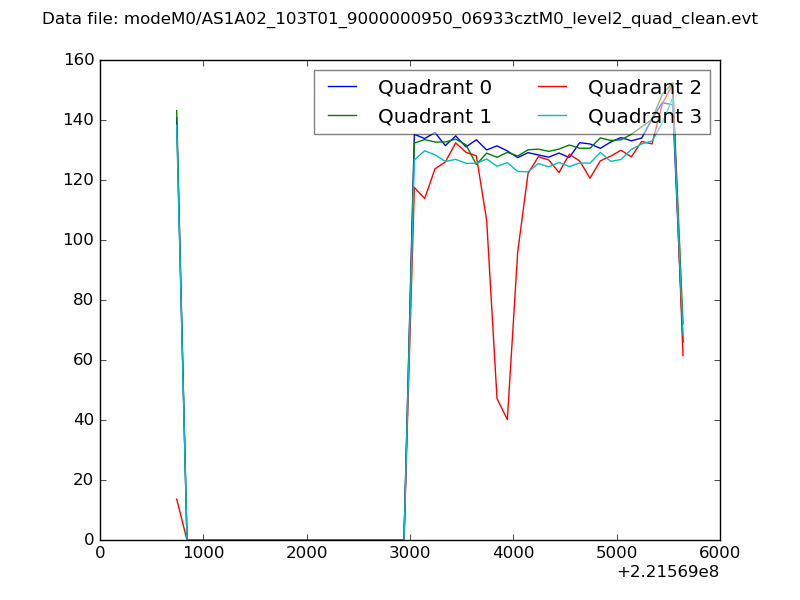 |
|
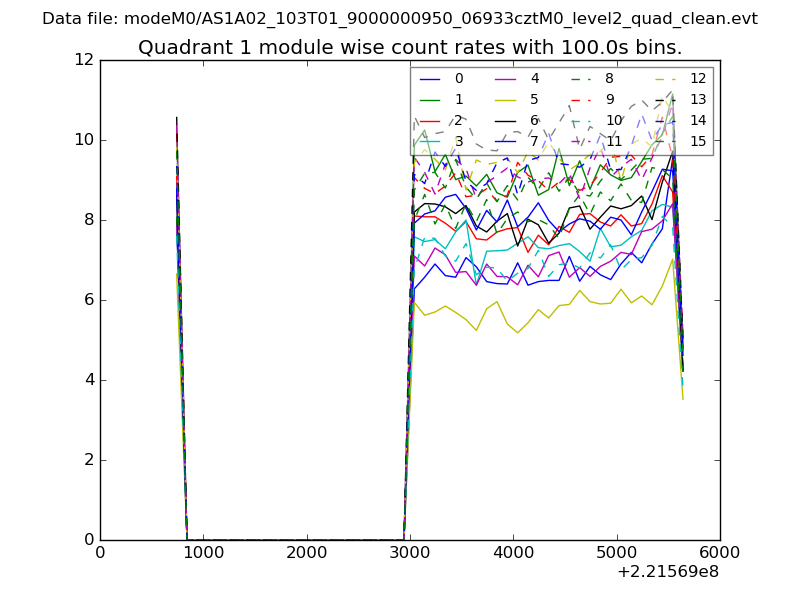
| Module-wise count rates for Quadrant A Data is divided into 100 sec bins |
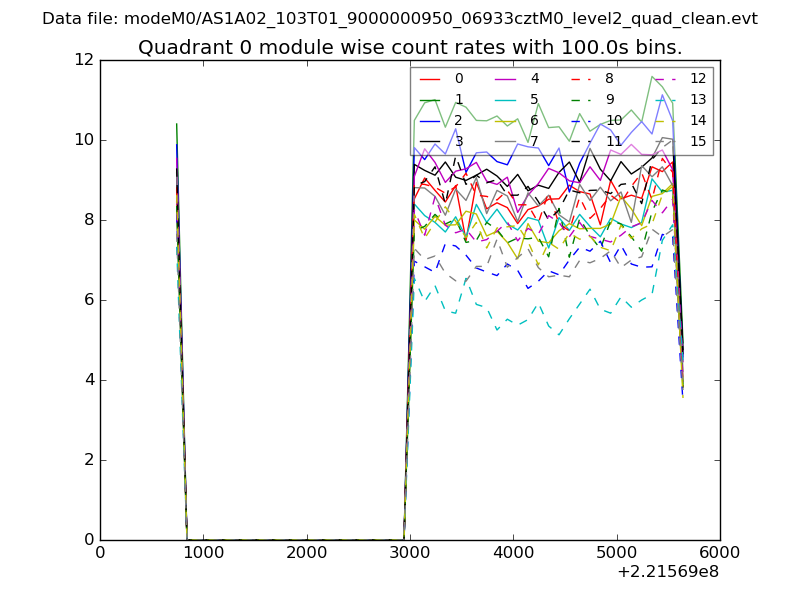 |
 |
| Module-wise count rates for Quadrant B Data is divided into 100 sec bins |
 |
 |
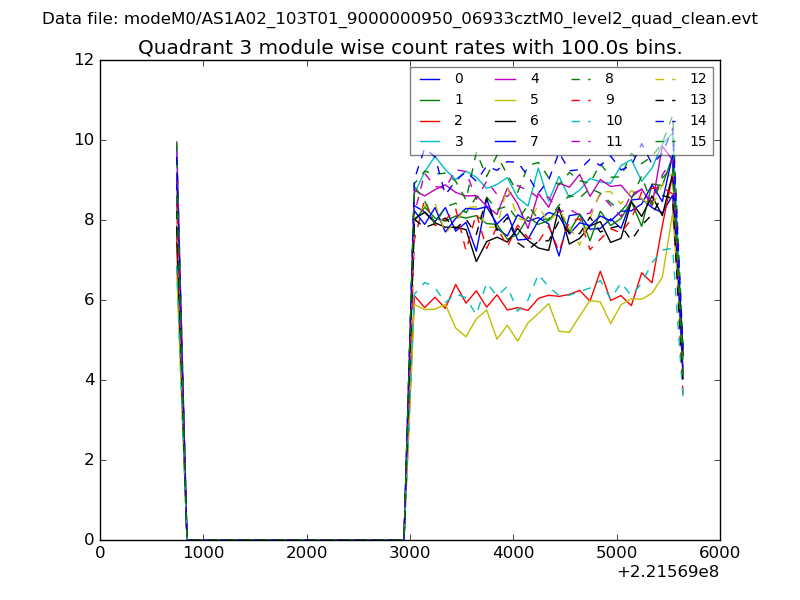
| Module-wise count rates for Quadrant C Data is divided into 100 sec bins |
 |
 |
| Module-wise count rates for Quadrant D Data is divided into 100 sec bins |
 |
 |
| Parameter | Plot |
|---|---|
| CZT HV Monitor | 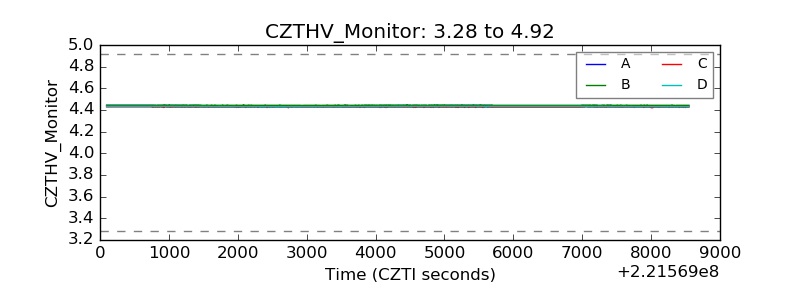 |
| D_VDD | 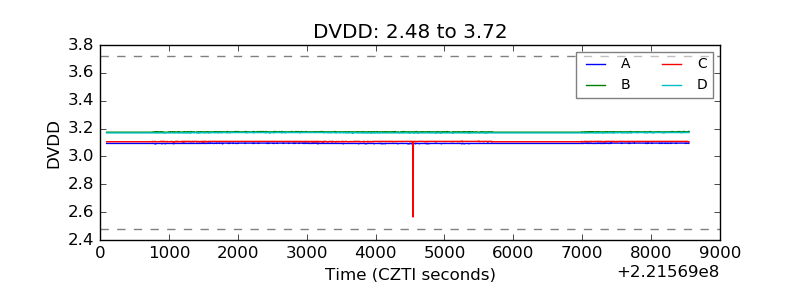 |
| Temperature 1 | 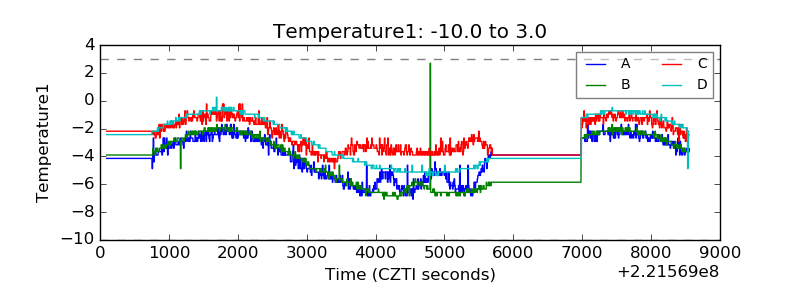 |
| Veto HV Monitor | 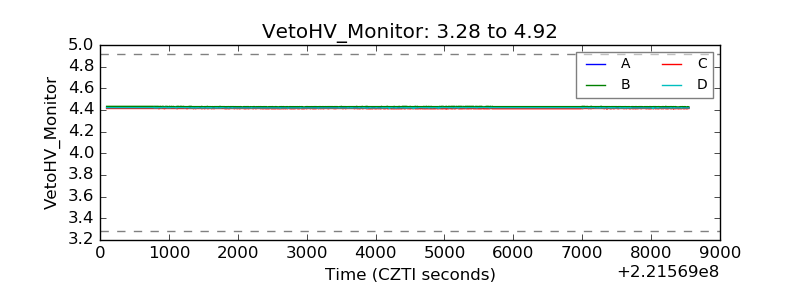 |
| Veto LLD | 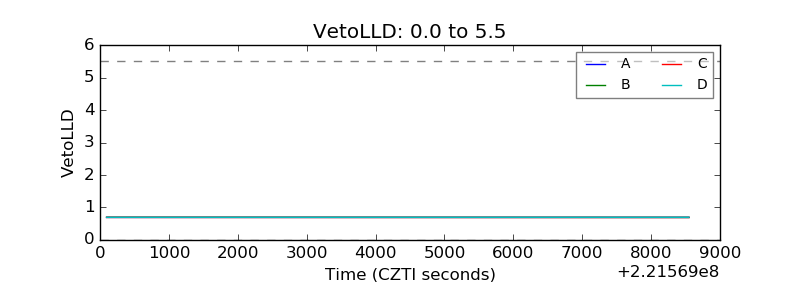 |
| Alpha Counter | 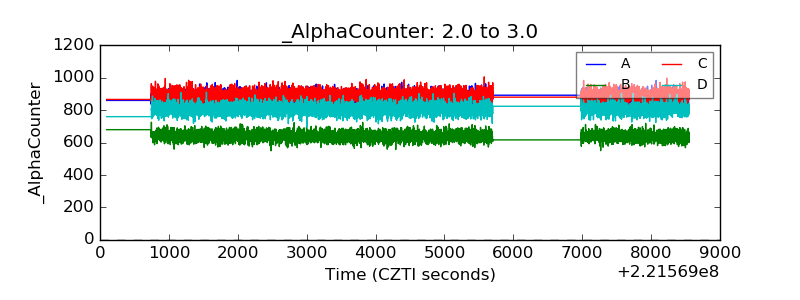 |
| _CPM_Rate | 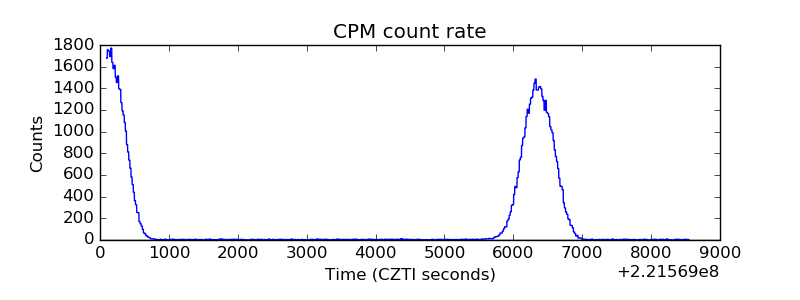 |
| CZT Counter | 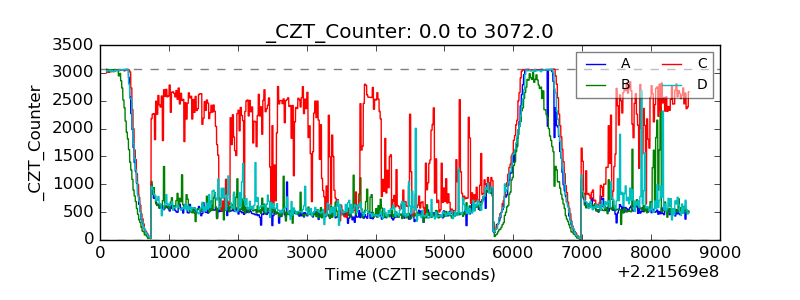 |
| +2.5 Volts monitor |  |
| +5 Volts monitor | 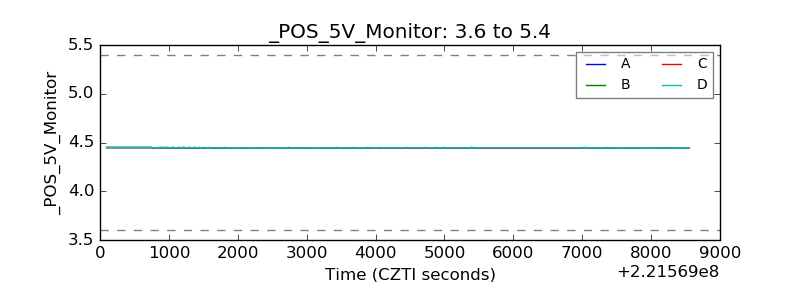 |
| _ROLL_ROT | 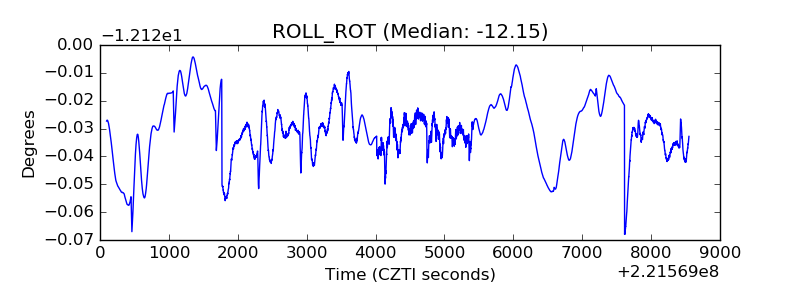 |
| _Roll_DEC | 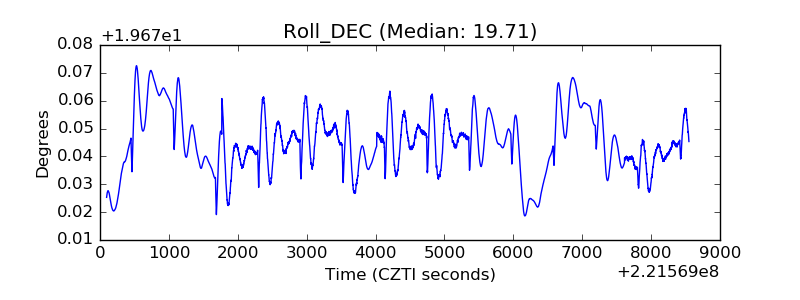 |
| _Roll_RA | 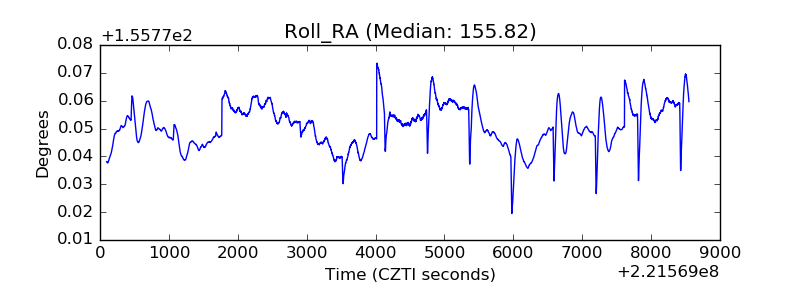 |
| Veto Counter | 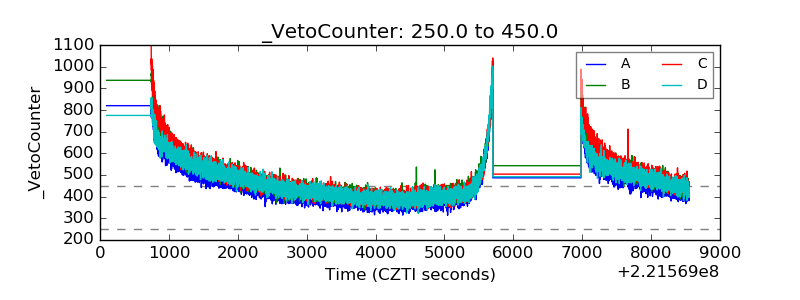 |