| Param | Original file | Final file |
|---|---|---|
| Filename | modeM0/AS1A02_103T01_9000000950_06935cztM0_level2.evt | modeM0/AS1A02_103T01_9000000950_06935cztM0_level2_quad_clean.evt |
| Size (bytes) | 812,998,080 | 69,831,360 |
| Size | 775.3 MB | 66.6 MB |
| Events in quadrant A | 3,056,416 | 486,477 |
| Events in quadrant B | 3,796,806 | 488,410 |
| Events in quadrant C | 13,633,727 | 218,610 |
| Events in quadrant D | 3,700,719 | 471,852 |
| Mode SS | |||
|---|---|---|---|
| Quadrant | BADHDUFLAG | Total packets | Discarded packets |
| A | 0 | 130 | 0 |
| B | 0 | 130 | 0 |
| C | 0 | 130 | 0 |
| D | 0 | 130 | 0 |
| Mode M9 | |||
|---|---|---|---|
| Quadrant | BADHDUFLAG | Total packets | Discarded packets |
| A | 0 | 10 | 0 |
| B | 0 | 10 | 0 |
| C | 0 | 10 | 0 |
| D | 0 | 10 | 0 |
| Mode M0 | |||
|---|---|---|---|
| Quadrant | BADHDUFLAG | Total packets | Discarded packets |
| A | 0 | 13332 | 2 |
| B | 0 | 15628 | 1 |
| C | 0 | 44896 | 1 |
| D | 0 | 15330 | 1 |
| Quadrant | Total seconds | Saturated seconds | Saturation percentage |
|---|---|---|---|
| A | 6415 | 78 | 1.215900% |
| B | 6415 | 165 | 2.572097% |
| C | 6415 | 4840 | 75.448168% |
| D | 6415 | 84 | 1.309431% |
Noise dominated data is calculated using 1-second bins in cleaned event files. If a bin has >2000 counts, and if more than 50% of those come from <1% of pixels, then it is considered to be noise-dominated and hence unusable.
| Quadrant | # 1 sec bins | Bins with >0 counts | Bins with >2000 counts | High rate bins dominated by noise | Noise dominated (total time) | Noise dominated (detector-on time) | Marked lightcurve |
|---|---|---|---|---|---|---|---|
| A | 7390 | 6416 | 5 | 5 | 0.07% | 0.08% | 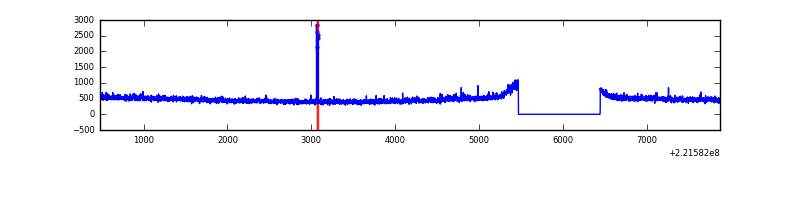 |
| B | 7390 | 6416 | 16 | 16 | 0.22% | 0.25% | 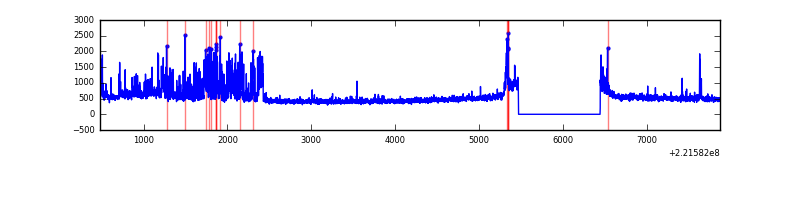 |
| C | 7389 | 6414 | 3952 | 3952 | 53.48% | 61.62% |  |
| D | 7390 | 6416 | 16 | 16 | 0.22% | 0.25% | 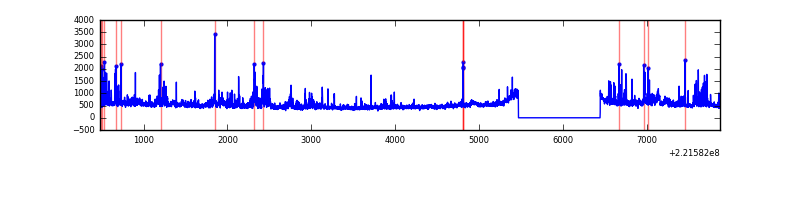 |
Top three noisy pixels from each quadrant. If the there are fewer than three noisy pixels in the level2.evt file, extra rows are filled as -1
| Pixel properties | Quadrant properties | ||||||
|---|---|---|---|---|---|---|---|
| Quadrant | DetID | PixID | Counts | Sigma | Mean | Median | Sigma |
| A | 4 | 2 | 20212 | 120.51 | 786 | 769 | 161.3 |
| A | 0 | 226 | 7596 | 42.31 | 786 | 769 | 161.3 |
| A | 12 | 194 | 7319 | 40.6 | 786 | 769 | 161.3 |
| B | 0 | 228 | 632935 | 4171.75 | 787 | 768 | 151.5 |
| B | 0 | 229 | 37426 | 241.91 | 787 | 768 | 151.5 |
| B | 4 | 48 | 34903 | 225.26 | 787 | 768 | 151.5 |
| C | 9 | 247 | 11990086 | 123720.62 | 418 | 419 | 96.9 |
| C | 10 | 22 | 3976 | 36.7 | 418 | 419 | 96.9 |
| C | 13 | 61 | 3218 | 28.88 | 418 | 419 | 96.9 |
| D | 2 | 136 | 363620 | 1911.64 | 768 | 743 | 189.8 |
| D | 8 | 195 | 221096 | 1160.82 | 768 | 743 | 189.8 |
| D | 2 | 152 | 91177 | 476.41 | 768 | 743 | 189.8 |
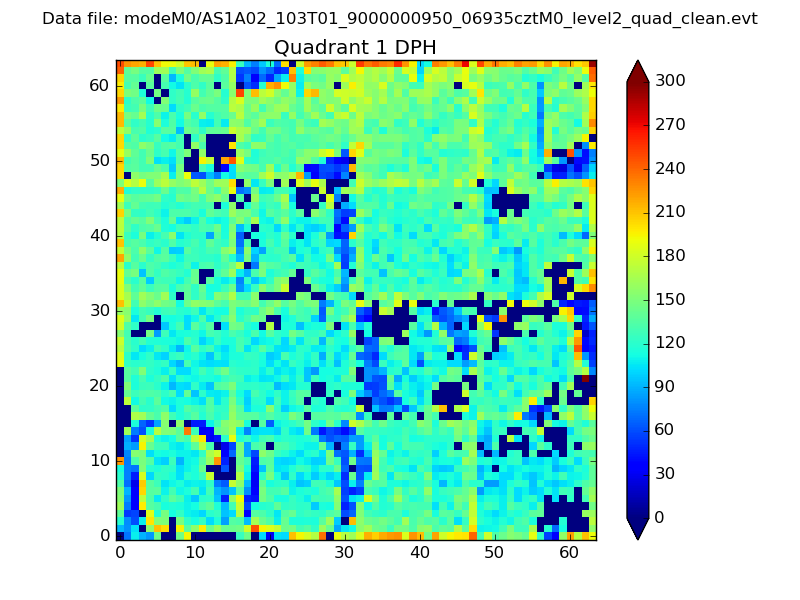
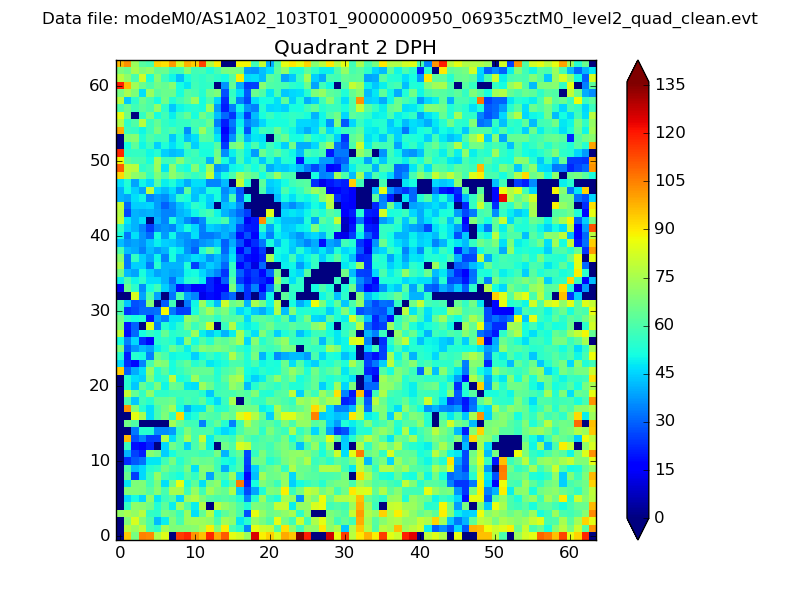
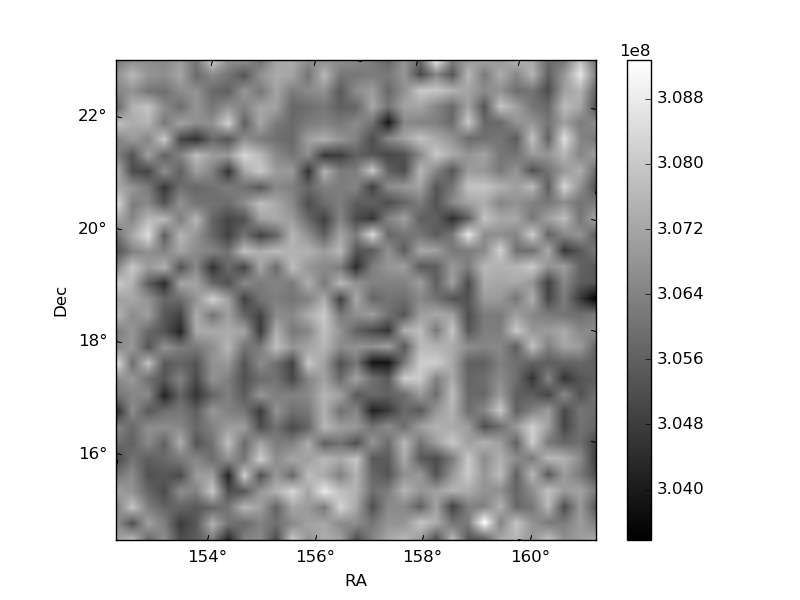
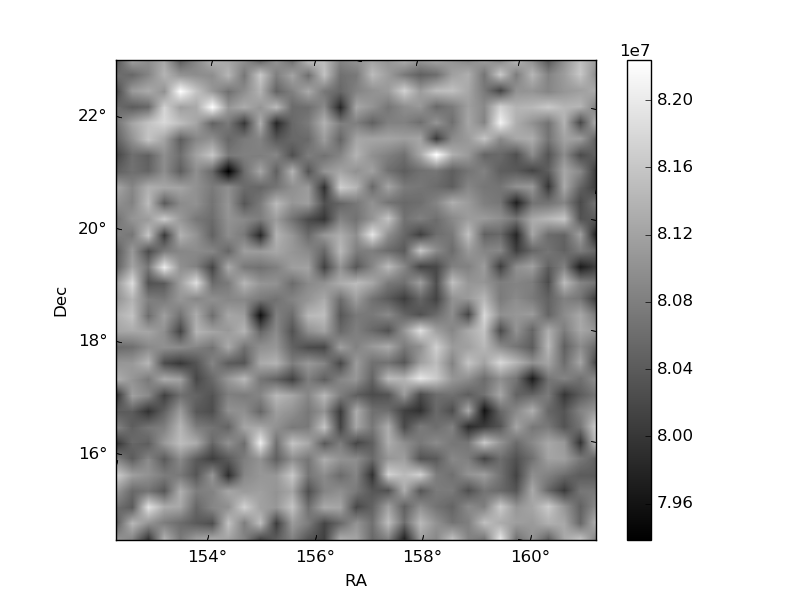
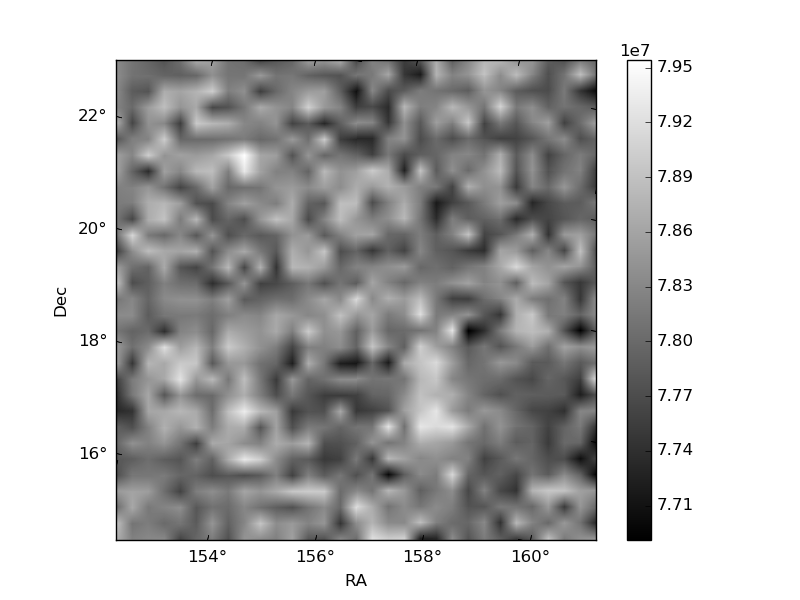
Histogram calculated using DETX and DETY for each event in the final _common_clean file
| Quadrant A | 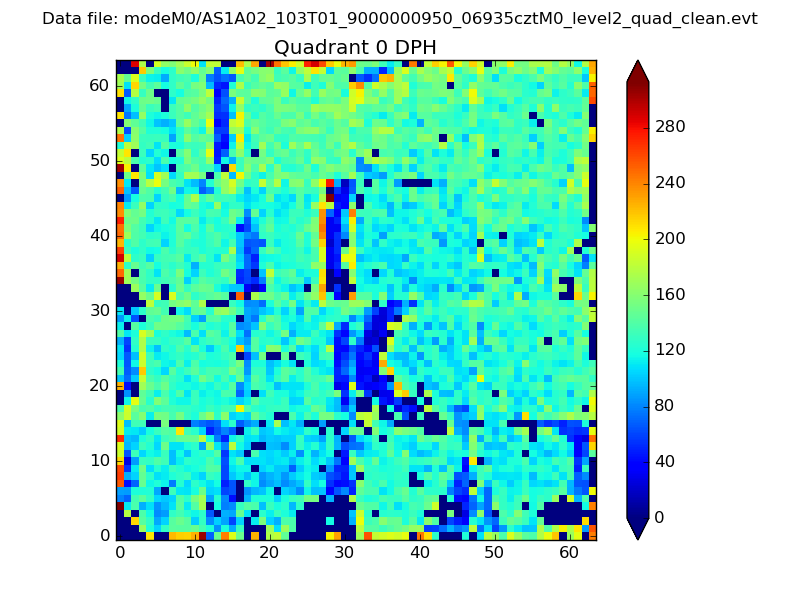 |
 |
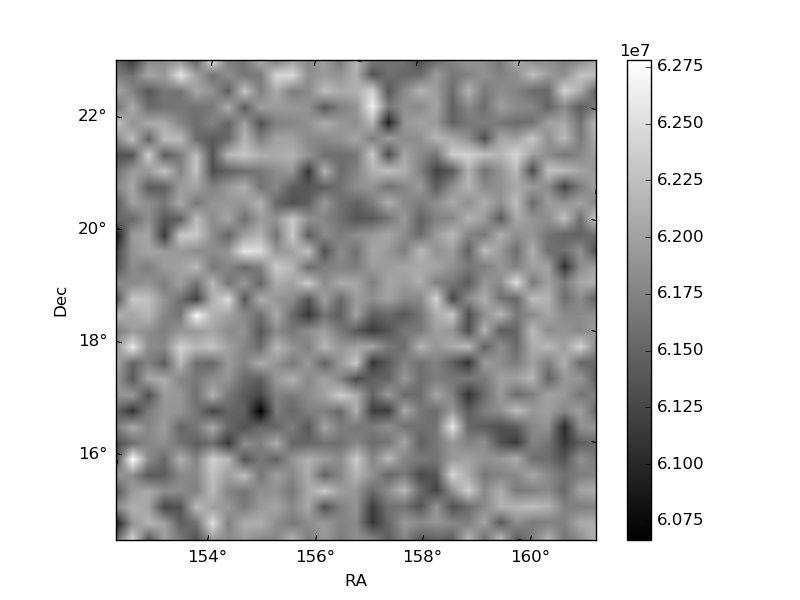
Quadrant B |
|---|---|---|---|
| Quadrant D | 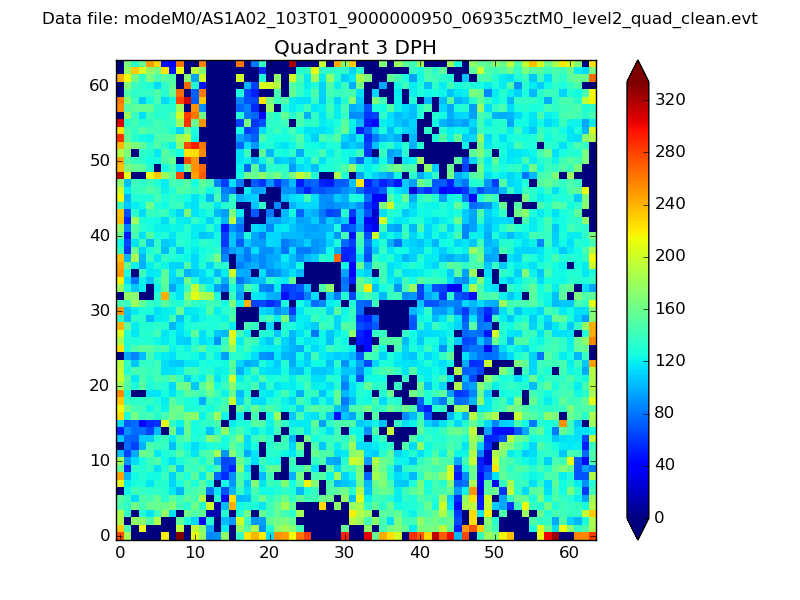 |
 |
Quadrant C |
| Plot type | Count rate plots | Images |
|---|---|---|
| Comparison with Poisson distribution Blue bars denote a histogram of data divided into 1 sec bins. Red curve is a Poisson curve with rate = median count rate of data. |
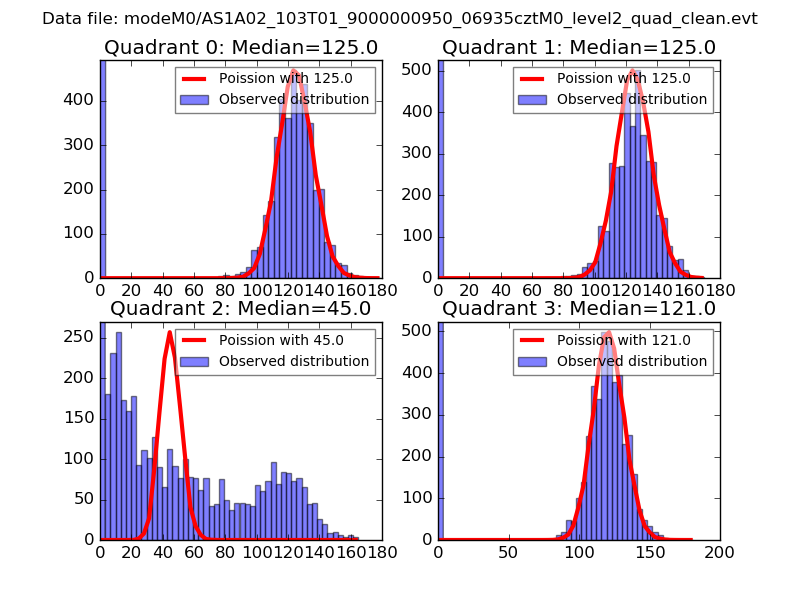 |
 |
| Quadrant-wise count rates Data is divided into 100 sec bins |
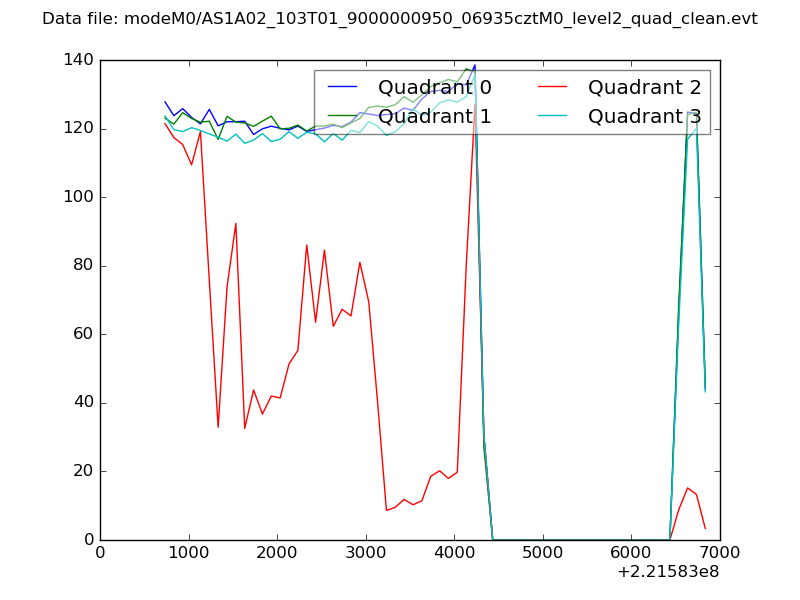 |
|
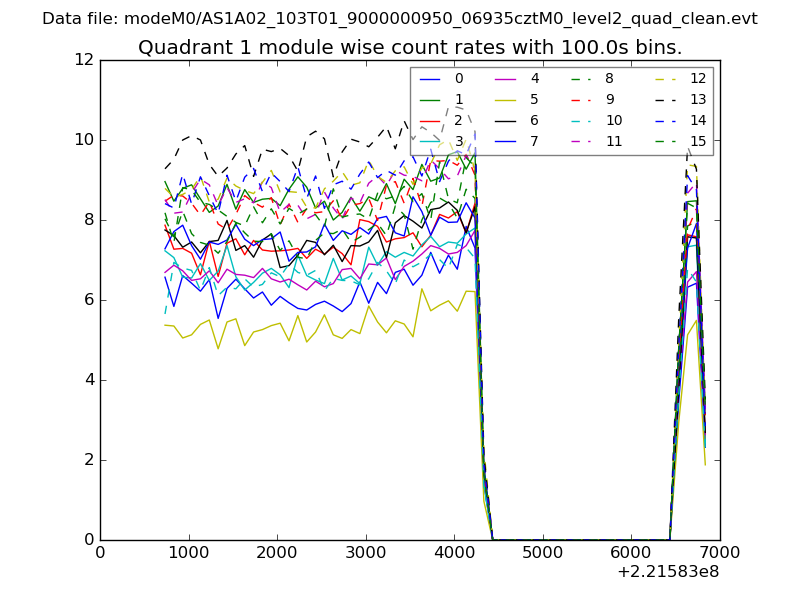
| Module-wise count rates for Quadrant A Data is divided into 100 sec bins |
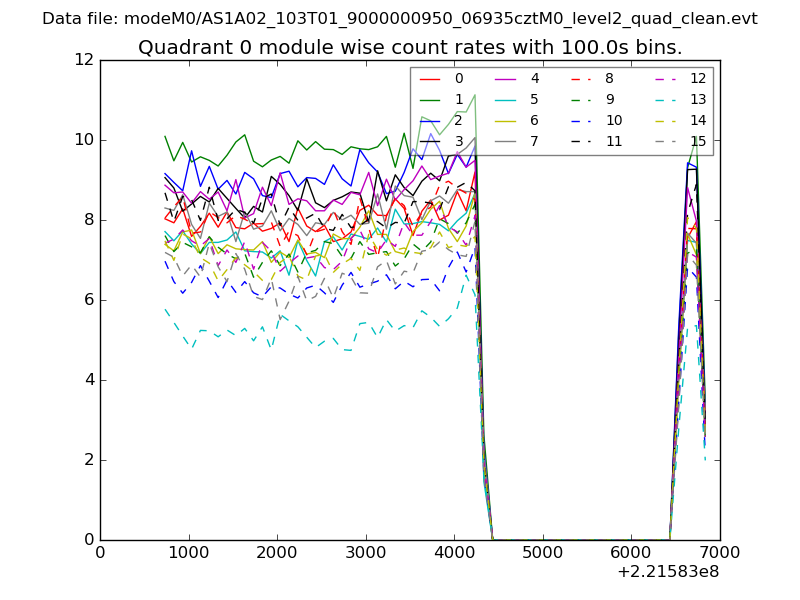 |
 |
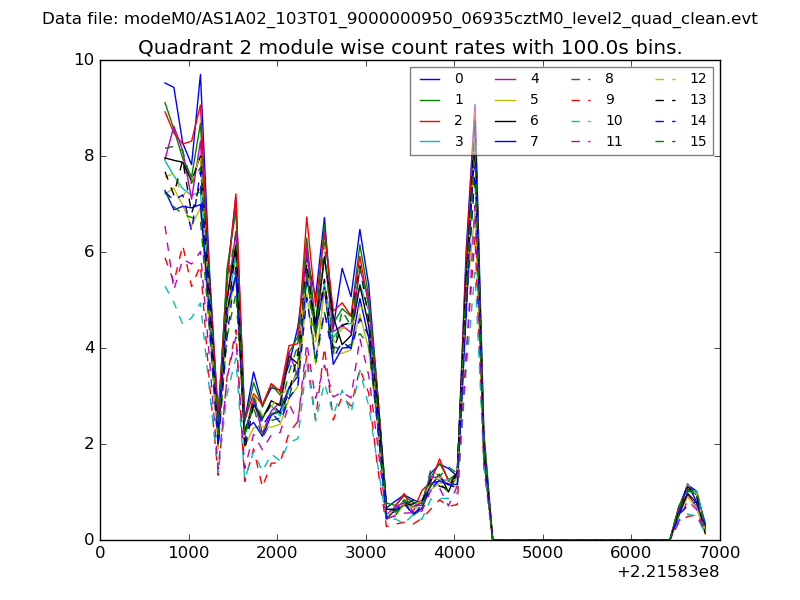
| Module-wise count rates for Quadrant B Data is divided into 100 sec bins |
 |
 |
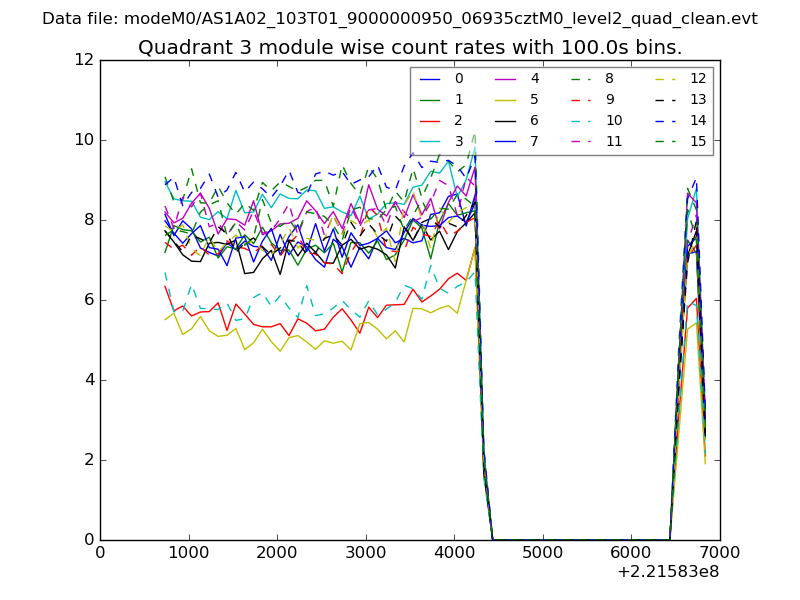
| Module-wise count rates for Quadrant C Data is divided into 100 sec bins |
 |
 |
| Module-wise count rates for Quadrant D Data is divided into 100 sec bins |
 |
 |
| Parameter | Plot |
|---|---|
| CZT HV Monitor | 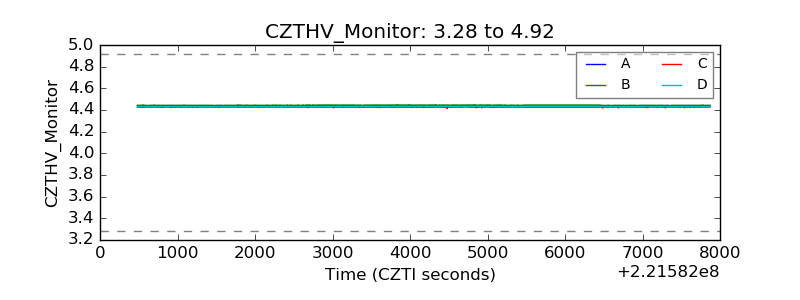 |
| D_VDD | 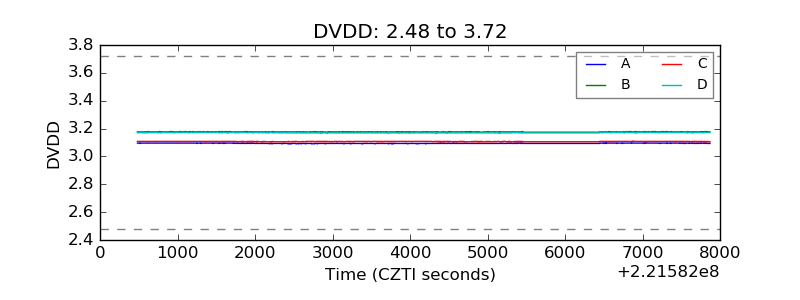 |
| Temperature 1 | 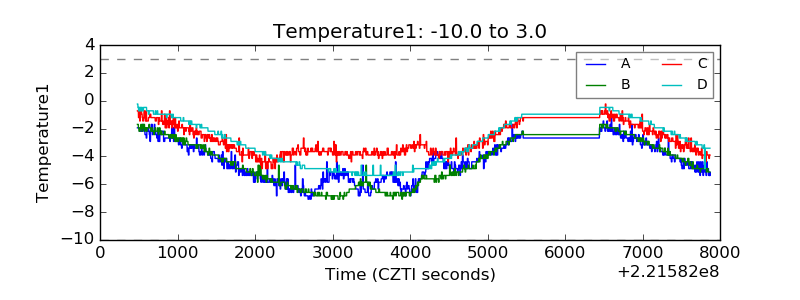 |
| Veto HV Monitor |  |
| Veto LLD |  |
| Alpha Counter | 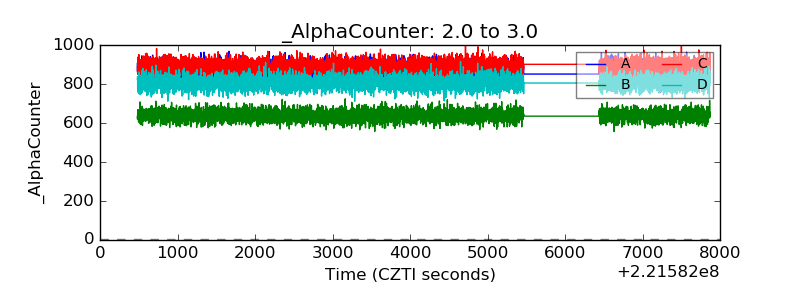 |
| _CPM_Rate | 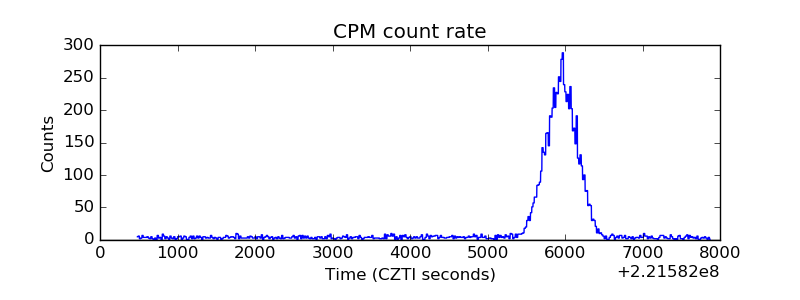 |
| CZT Counter | 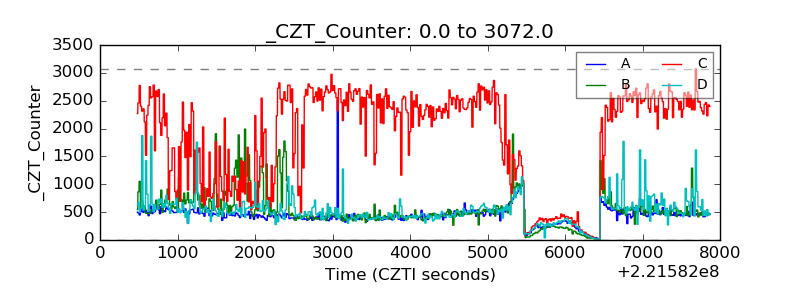 |
| +2.5 Volts monitor |  |
| +5 Volts monitor | 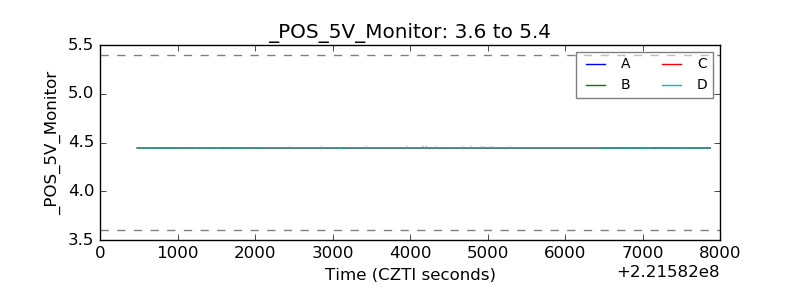 |
| _ROLL_ROT | 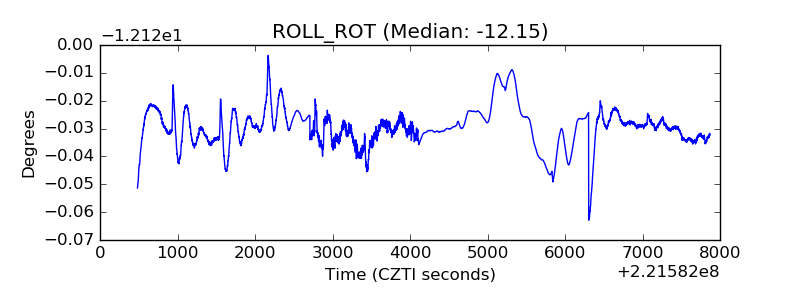 |
| _Roll_DEC | 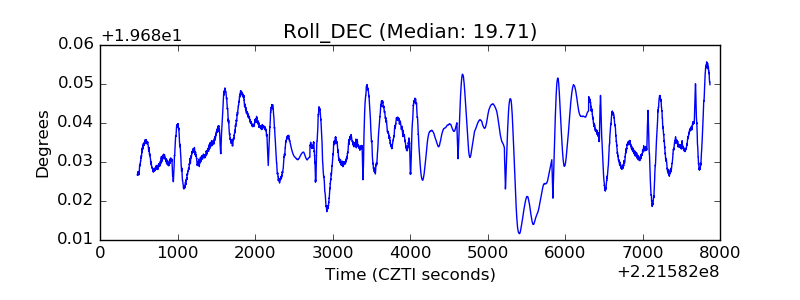 |
| _Roll_RA | 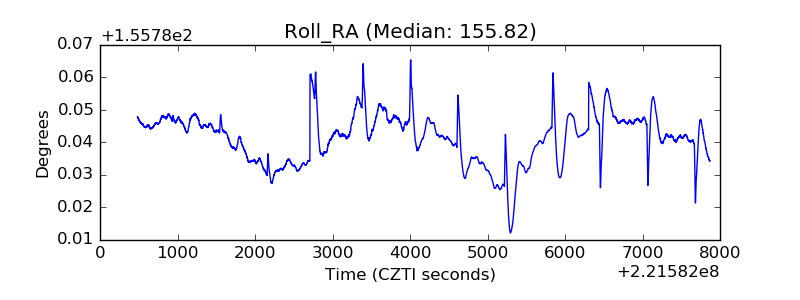 |
| Veto Counter | 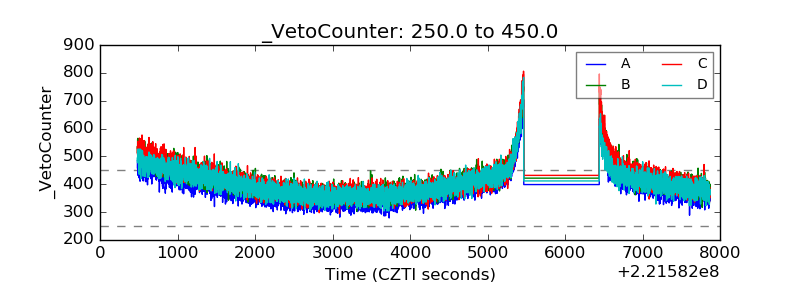 |