| Param | Original file | Final file |
|---|---|---|
| Filename | modeM0/AS1A02_103T01_9000000950_06937cztM0_level2.evt | modeM0/AS1A02_103T01_9000000950_06937cztM0_level2_quad_clean.evt |
| Size (bytes) | 1,007,112,960 | 79,064,640 |
| Size | 960.5 MB | 75.4 MB |
| Events in quadrant A | 3,307,029 | 561,971 |
| Events in quadrant B | 4,988,358 | 562,722 |
| Events in quadrant C | 16,303,352 | 248,304 |
| Events in quadrant D | 5,417,358 | 519,764 |
| Mode SS | |||
|---|---|---|---|
| Quadrant | BADHDUFLAG | Total packets | Discarded packets |
| A | 0 | 144 | 0 |
| B | 0 | 144 | 0 |
| C | 0 | 144 | 0 |
| D | 0 | 144 | 0 |
| Mode M9 | |||
|---|---|---|---|
| Quadrant | BADHDUFLAG | Total packets | Discarded packets |
| A | 0 | 2 | 0 |
| B | 0 | 2 | 0 |
| C | 0 | 2 | 0 |
| D | 0 | 2 | 0 |
| Mode M0 | |||
|---|---|---|---|
| Quadrant | BADHDUFLAG | Total packets | Discarded packets |
| A | 0 | 14852 | 2 |
| B | 0 | 20018 | 1 |
| C | 0 | 53343 | 1 |
| D | 0 | 20966 | 1 |
| Quadrant | Total seconds | Saturated seconds | Saturation percentage |
|---|---|---|---|
| A | 7175 | 45 | 0.627178% |
| B | 7175 | 505 | 7.038328% |
| C | 7175 | 6390 | 89.059233% |
| D | 7175 | 865 | 12.055749% |
Noise dominated data is calculated using 1-second bins in cleaned event files. If a bin has >2000 counts, and if more than 50% of those come from <1% of pixels, then it is considered to be noise-dominated and hence unusable.
| Quadrant | # 1 sec bins | Bins with >0 counts | Bins with >2000 counts | High rate bins dominated by noise | Noise dominated (total time) | Noise dominated (detector-on time) | Marked lightcurve |
|---|---|---|---|---|---|---|---|
| A | 7360 | 7176 | 1 | 1 | 0.01% | 0.01% | 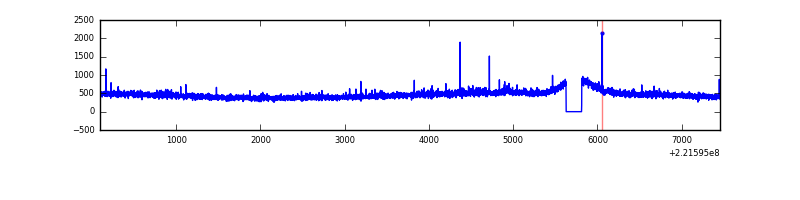 |
| B | 7360 | 7176 | 65 | 65 | 0.88% | 0.91% | 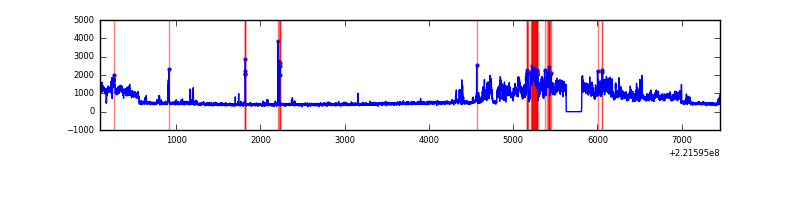 |
| C | 7360 | 7175 | 5194 | 5194 | 70.57% | 72.39% | 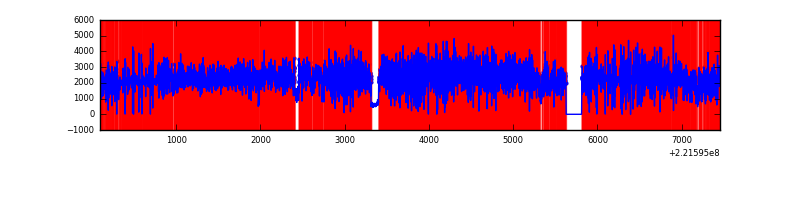 |
| D | 7360 | 7176 | 587 | 587 | 7.98% | 8.18% | 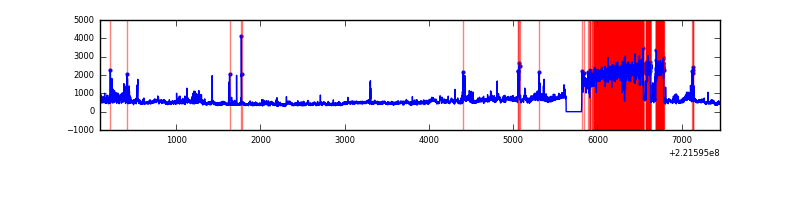 |
Top three noisy pixels from each quadrant. If the there are fewer than three noisy pixels in the level2.evt file, extra rows are filled as -1
| Pixel properties | Quadrant properties | ||||||
|---|---|---|---|---|---|---|---|
| Quadrant | DetID | PixID | Counts | Sigma | Mean | Median | Sigma |
| A | 13 | 248 | 15150 | 82.55 | 849 | 832 | 173.4 |
| A | 8 | 15 | 10653 | 56.63 | 849 | 832 | 173.4 |
| A | 0 | 226 | 8155 | 42.22 | 849 | 832 | 173.4 |
| B | 0 | 228 | 1451771 | 8987.28 | 841 | 820 | 161.4 |
| B | 4 | 48 | 121049 | 744.71 | 841 | 820 | 161.4 |
| B | 4 | 81 | 88821 | 545.08 | 841 | 820 | 161.4 |
| C | 9 | 247 | 14988166 | 194352.4 | 330 | 332 | 77.1 |
| C | 10 | 22 | 11739 | 147.92 | 330 | 332 | 77.1 |
| C | 8 | 128 | 4735 | 57.1 | 330 | 332 | 77.1 |
| D | 1 | 20 | 1463906 | 7472.08 | 791 | 766 | 195.8 |
| D | 8 | 195 | 515182 | 2627.06 | 791 | 766 | 195.8 |
| D | 2 | 136 | 204789 | 1041.92 | 791 | 766 | 195.8 |
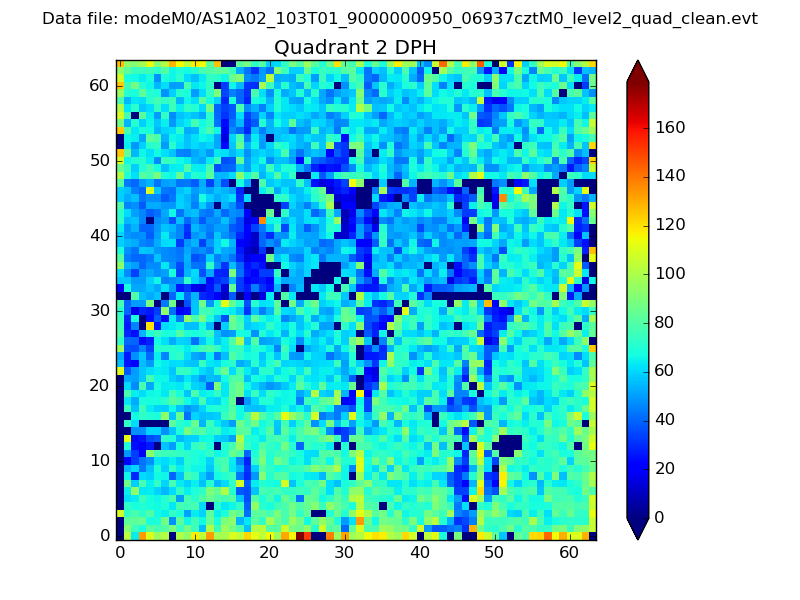
Histogram calculated using DETX and DETY for each event in the final _common_clean file
| Quadrant A | 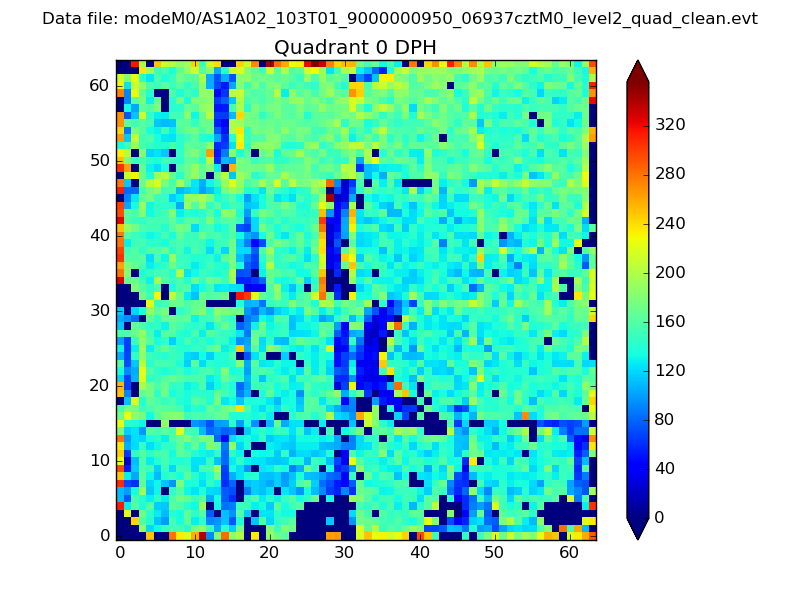 |
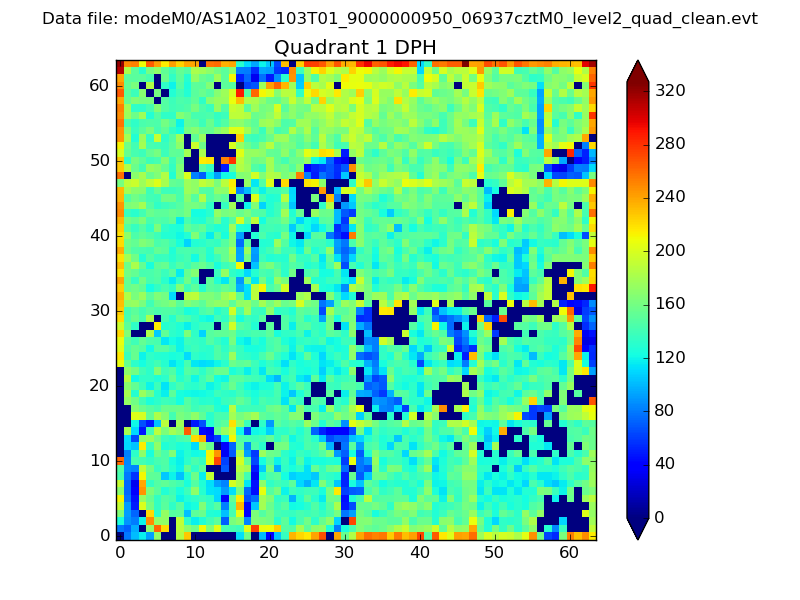 |
Quadrant B |
|---|---|---|---|
| Quadrant D | 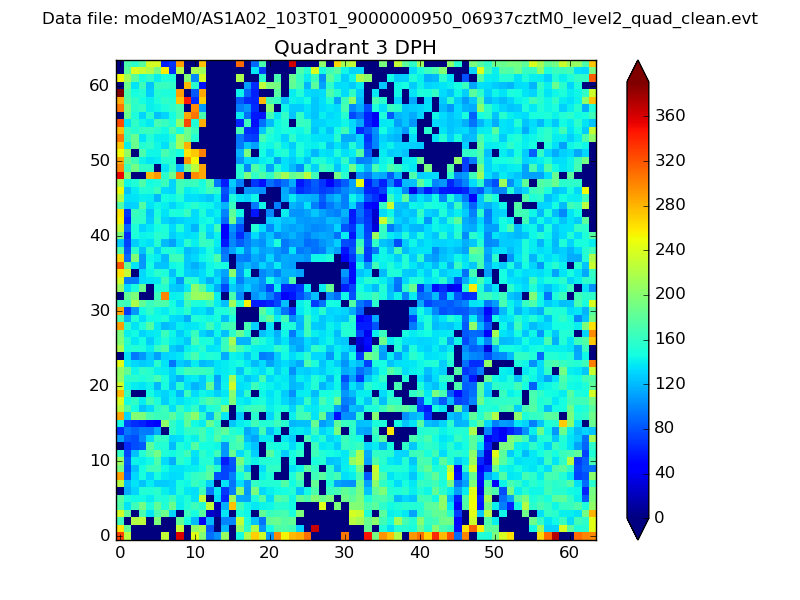 |
 |
Quadrant C |
| Plot type | Count rate plots | Images |
|---|---|---|
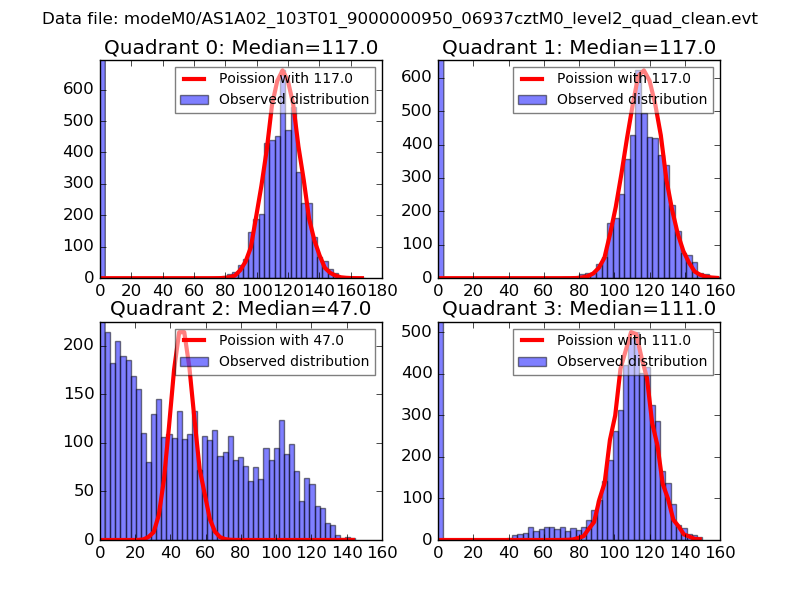
| Comparison with Poisson distribution Blue bars denote a histogram of data divided into 1 sec bins. Red curve is a Poisson curve with rate = median count rate of data. |
 |
 |
| Quadrant-wise count rates Data is divided into 100 sec bins |
 |
|
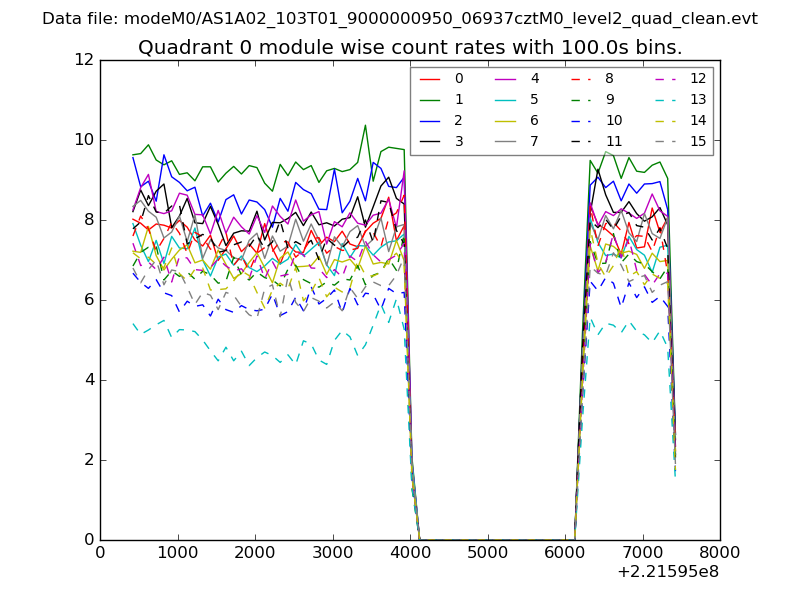
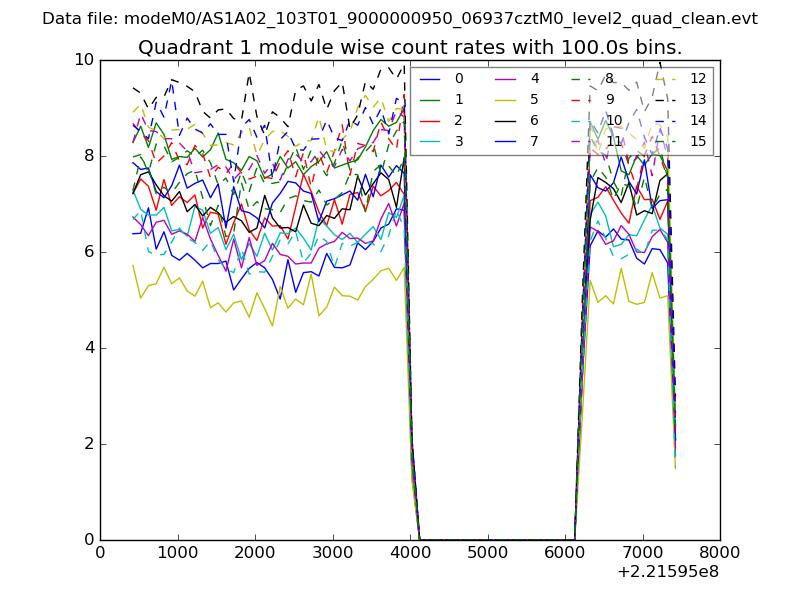
| Module-wise count rates for Quadrant A Data is divided into 100 sec bins |
 |
 |
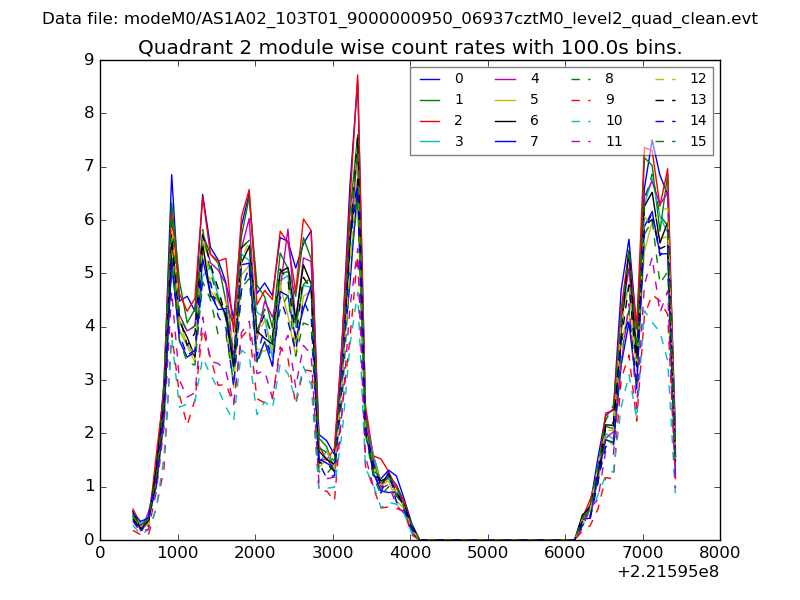
| Module-wise count rates for Quadrant B Data is divided into 100 sec bins |
 |
 |
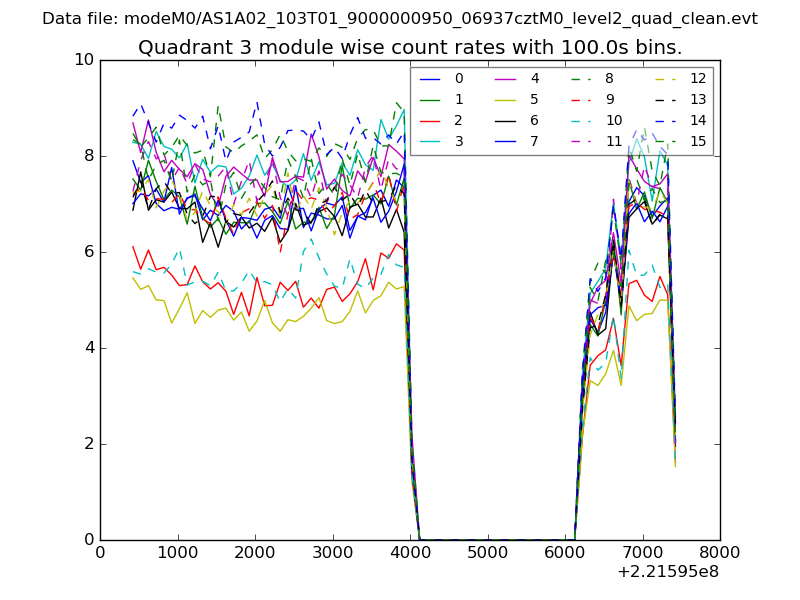
| Module-wise count rates for Quadrant C Data is divided into 100 sec bins |
 |
 |
| Module-wise count rates for Quadrant D Data is divided into 100 sec bins |
 |
 |
| Parameter | Plot |
|---|---|
| CZT HV Monitor |  |
| D_VDD | 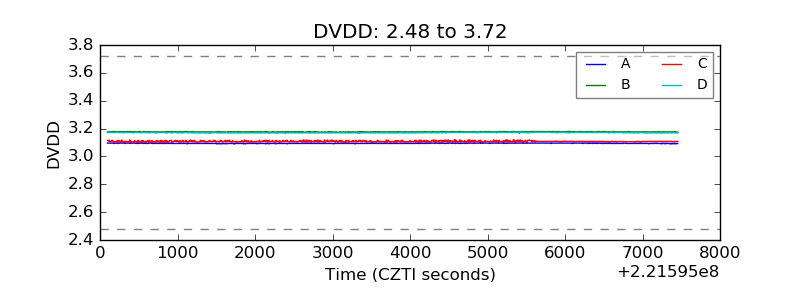 |
| Temperature 1 | 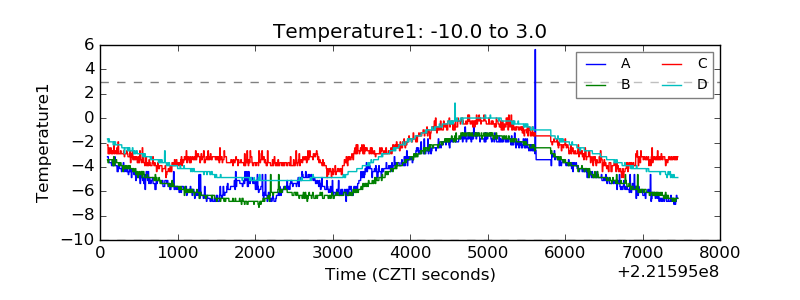 |
| Veto HV Monitor | 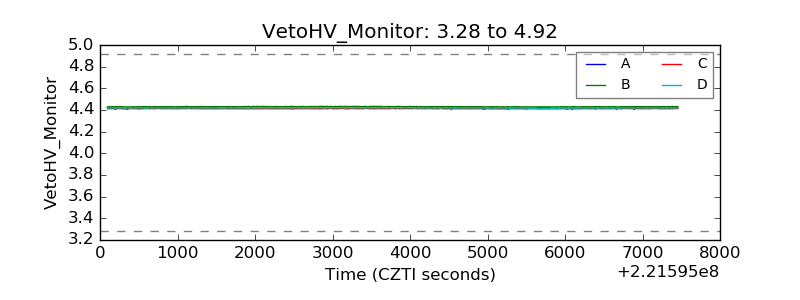 |
| Veto LLD | 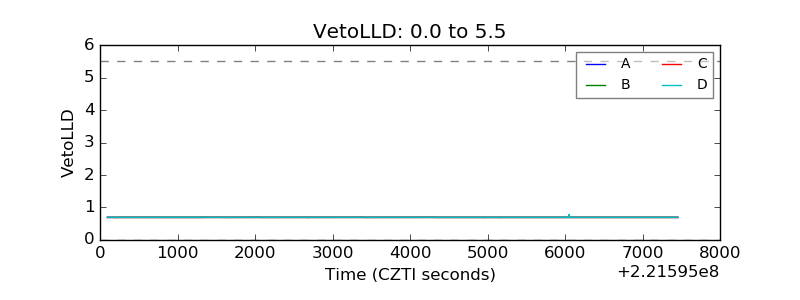 |
| Alpha Counter | 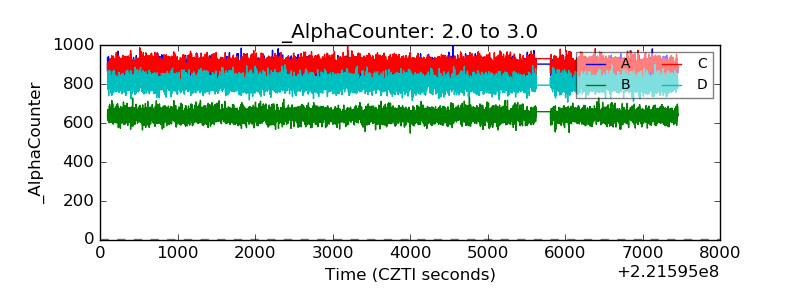 |
| _CPM_Rate | 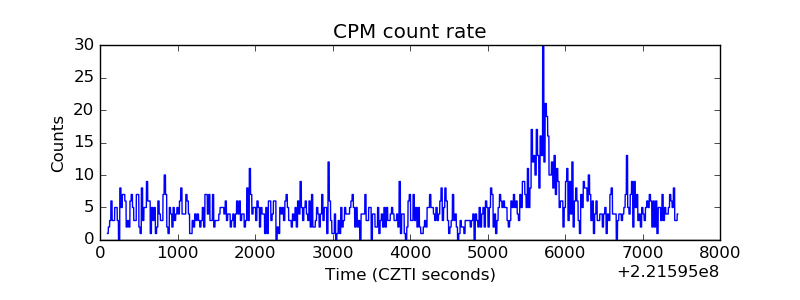 |
| CZT Counter | 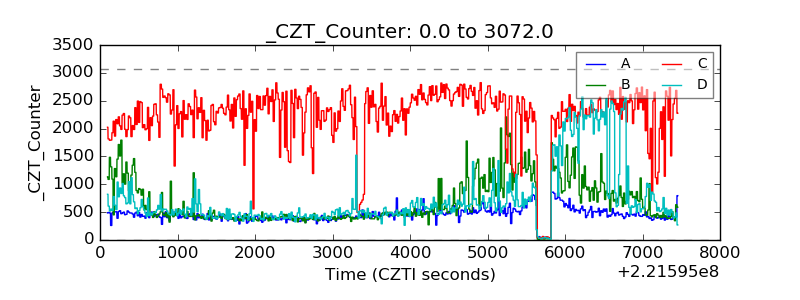 |
| +2.5 Volts monitor | 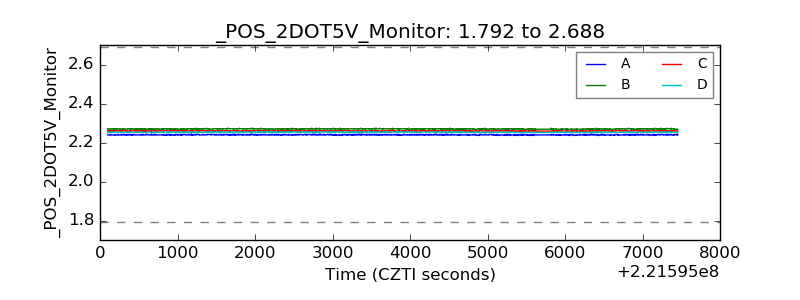 |
| +5 Volts monitor | 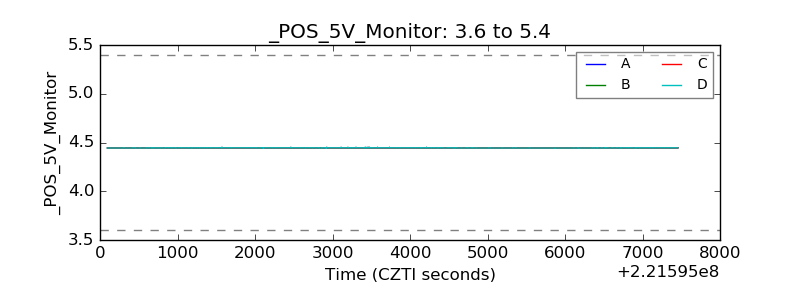 |
| _ROLL_ROT | 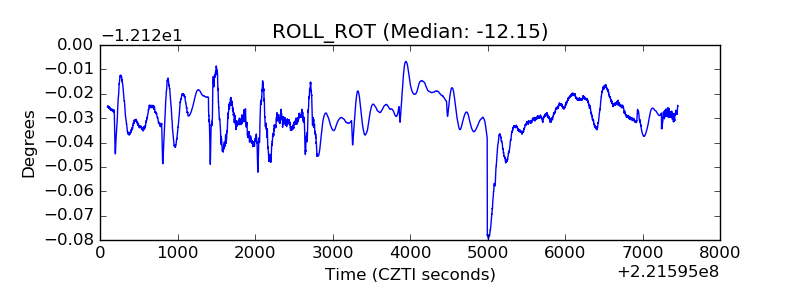 |
| _Roll_DEC | 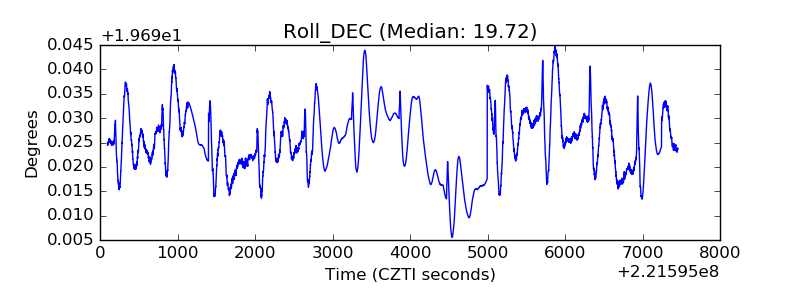 |
| _Roll_RA | 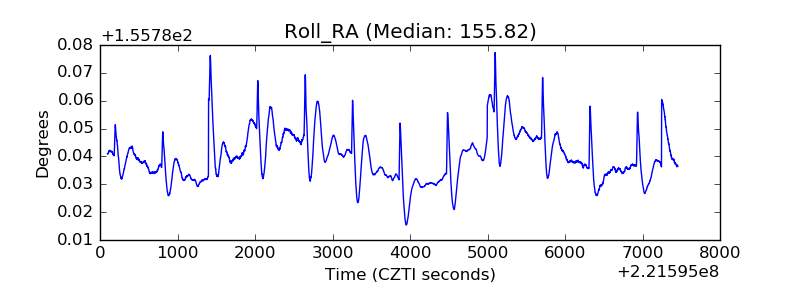 |
| Veto Counter | 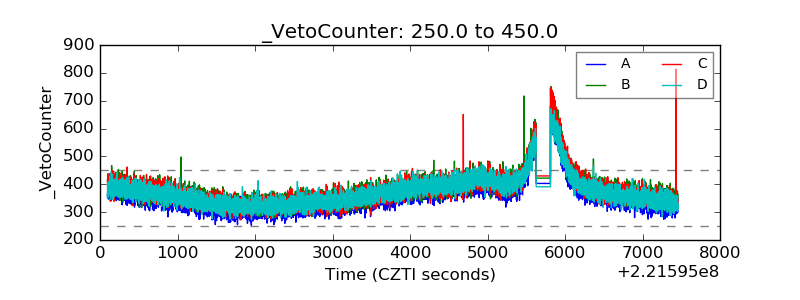 |