| Param | Original file | Final file |
|---|---|---|
| Filename | modeM0/AS1A02_103T01_9000000950_06938cztM0_level2.evt | modeM0/AS1A02_103T01_9000000950_06938cztM0_level2_quad_clean.evt |
| Size (bytes) | 381,029,760 | 38,355,840 |
| Size | 363.4 MB | 36.6 MB |
| Events in quadrant A | 1,065,204 | 289,159 |
| Events in quadrant B | 1,466,690 | 288,434 |
| Events in quadrant C | 6,046,416 | 145,078 |
| Events in quadrant D | 2,783,729 | 251,007 |
| Mode SS | |||
|---|---|---|---|
| Quadrant | BADHDUFLAG | Total packets | Discarded packets |
| A | 0 | 52 | 0 |
| B | 0 | 52 | 0 |
| C | 0 | 52 | 0 |
| D | 0 | 52 | 0 |
| Mode M0 | |||
|---|---|---|---|
| Quadrant | BADHDUFLAG | Total packets | Discarded packets |
| A | 0 | 5206 | 1 |
| B | 0 | 6359 | 0 |
| C | 0 | 19733 | 0 |
| D | 0 | 10042 | 0 |
| Quadrant | Total seconds | Saturated seconds | Saturation percentage |
|---|---|---|---|
| A | 2597 | 2 | 0.077012% |
| B | 2597 | 17 | 0.654601% |
| C | 2597 | 2201 | 84.751637% |
| D | 2597 | 568 | 21.871390% |
Noise dominated data is calculated using 1-second bins in cleaned event files. If a bin has >2000 counts, and if more than 50% of those come from <1% of pixels, then it is considered to be noise-dominated and hence unusable.
| Quadrant | # 1 sec bins | Bins with >0 counts | Bins with >2000 counts | High rate bins dominated by noise | Noise dominated (total time) | Noise dominated (detector-on time) | Marked lightcurve |
|---|---|---|---|---|---|---|---|
| A | 2597 | 2597 | 0 | 0 | 0.00% | 0.00% | 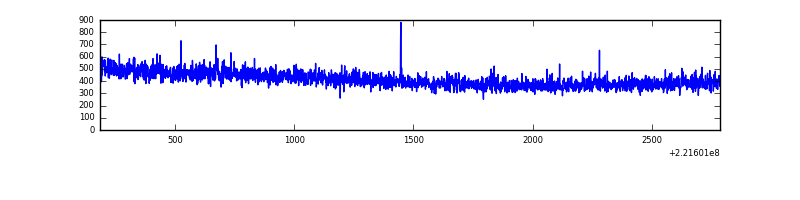 |
| B | 2597 | 2597 | 7 | 7 | 0.27% | 0.27% | 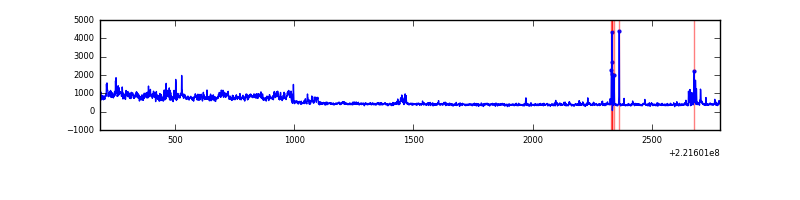 |
| C | 2597 | 2596 | 2040 | 2040 | 78.55% | 78.58% | 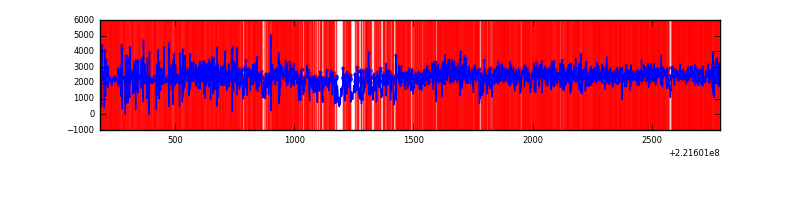 |
| D | 2597 | 2597 | 565 | 565 | 21.76% | 21.76% | 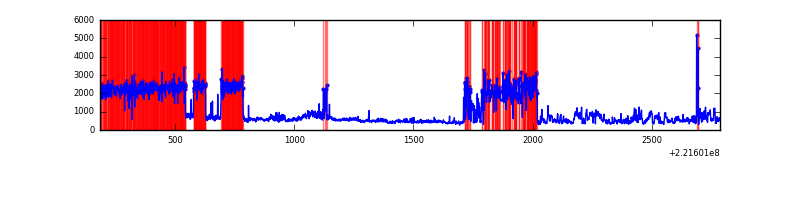 |
Top three noisy pixels from each quadrant. If the there are fewer than three noisy pixels in the level2.evt file, extra rows are filled as -1
| Pixel properties | Quadrant properties | ||||||
|---|---|---|---|---|---|---|---|
| Quadrant | DetID | PixID | Counts | Sigma | Mean | Median | Sigma |
| A | 13 | 14 | 3273 | 52.16 | 274 | 270 | 57.6 |
| A | 0 | 226 | 2697 | 42.16 | 274 | 270 | 57.6 |
| A | 12 | 194 | 2538 | 39.4 | 274 | 270 | 57.6 |
| B | 0 | 228 | 281532 | 5089.41 | 279 | 272 | 55.3 |
| B | 4 | 48 | 54285 | 977.37 | 279 | 272 | 55.3 |
| B | 0 | 219 | 21208 | 378.84 | 279 | 272 | 55.3 |
| C | 9 | 247 | 5472448 | 155116.2 | 146 | 147 | 35.3 |
| C | 13 | 61 | 1121 | 27.61 | 146 | 147 | 35.3 |
| C | 8 | 222 | 624 | 13.52 | 146 | 147 | 35.3 |
| D | 1 | 20 | 1567741 | 25195.21 | 245 | 237 | 62.2 |
| D | 8 | 195 | 143053 | 2295.55 | 245 | 237 | 62.2 |
| D | 2 | 136 | 44942 | 718.56 | 245 | 237 | 62.2 |
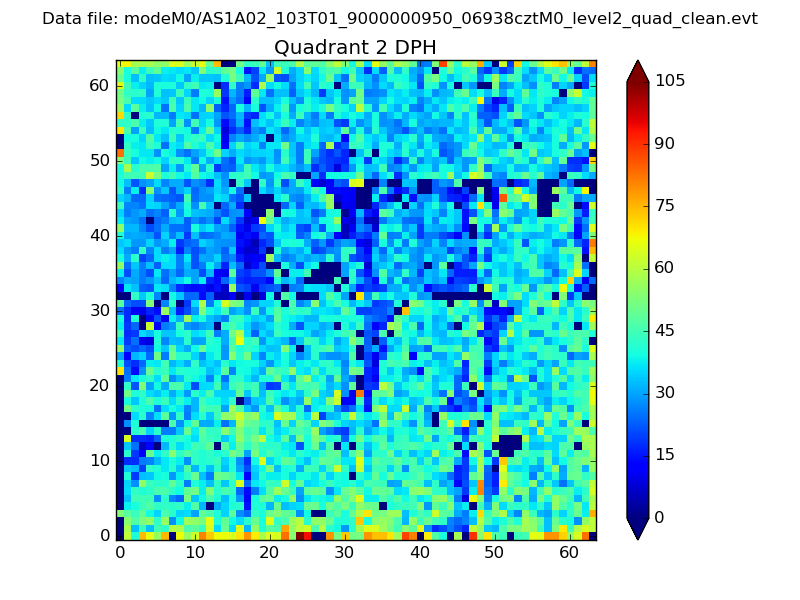
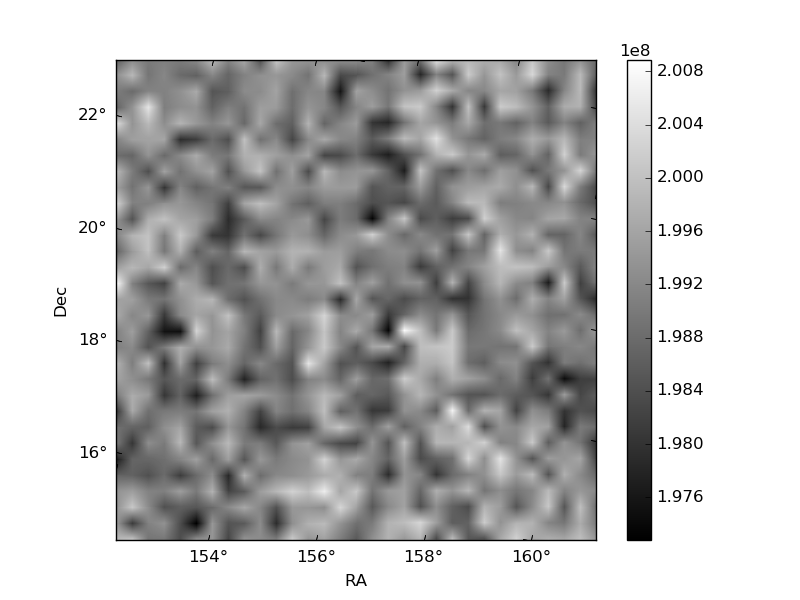
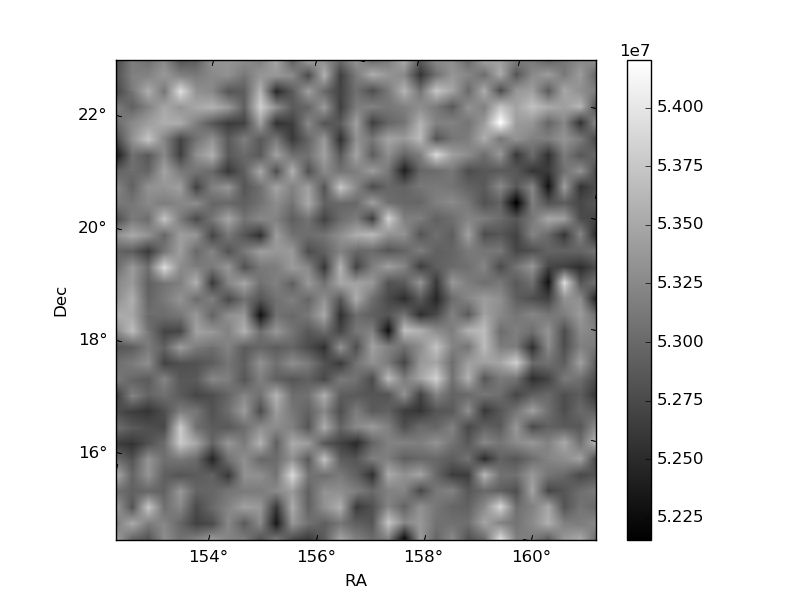
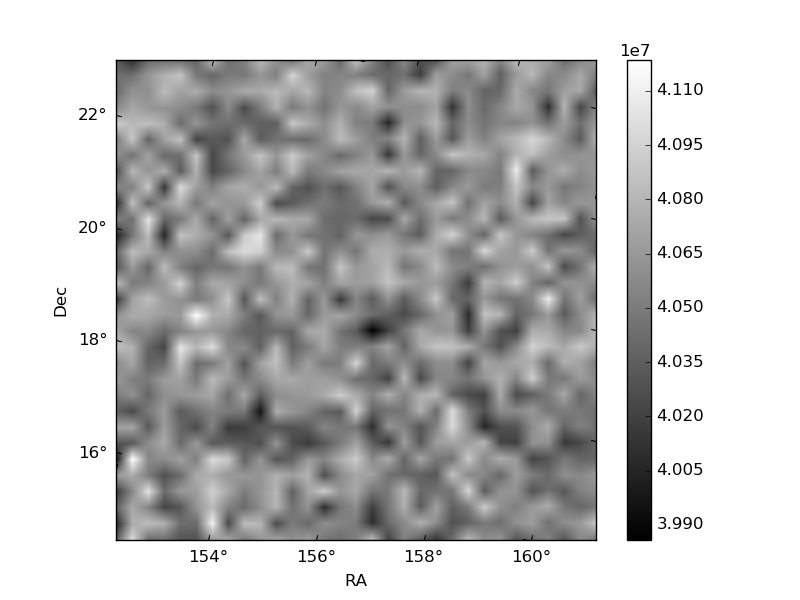
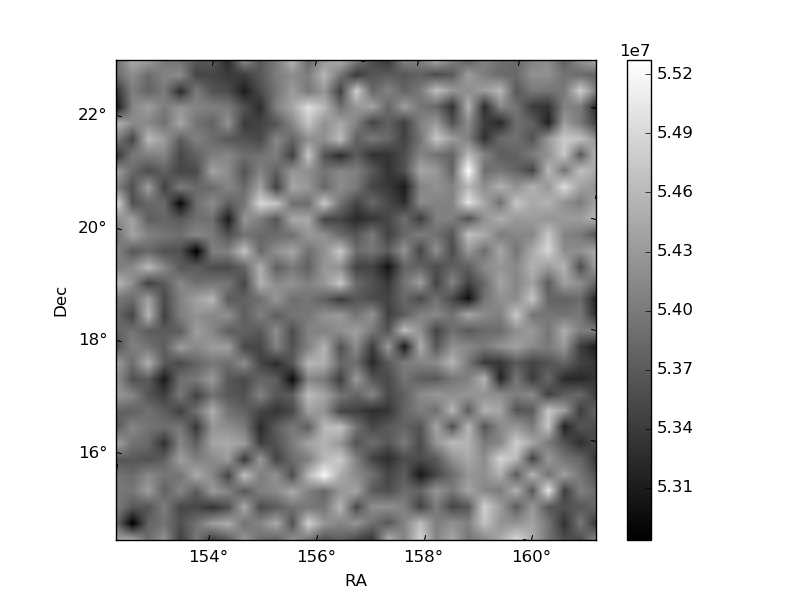
Histogram calculated using DETX and DETY for each event in the final _common_clean file
| Quadrant A | 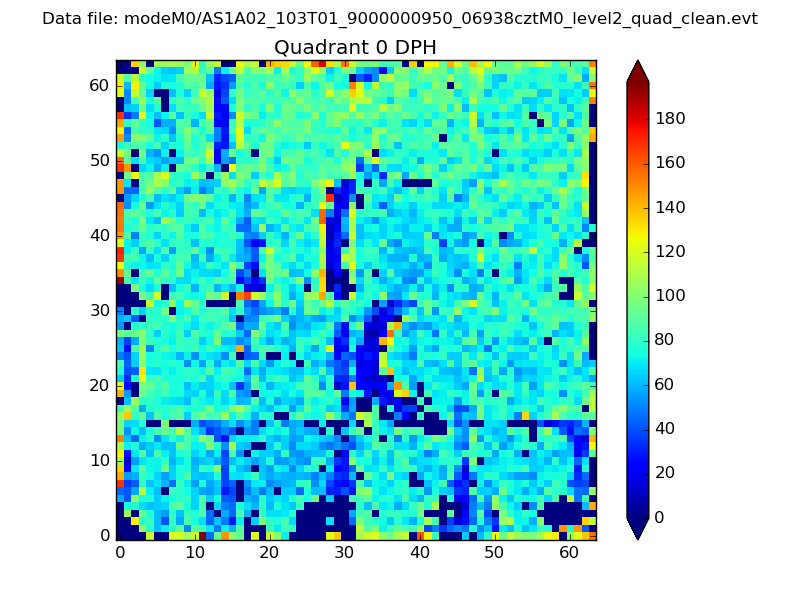 |
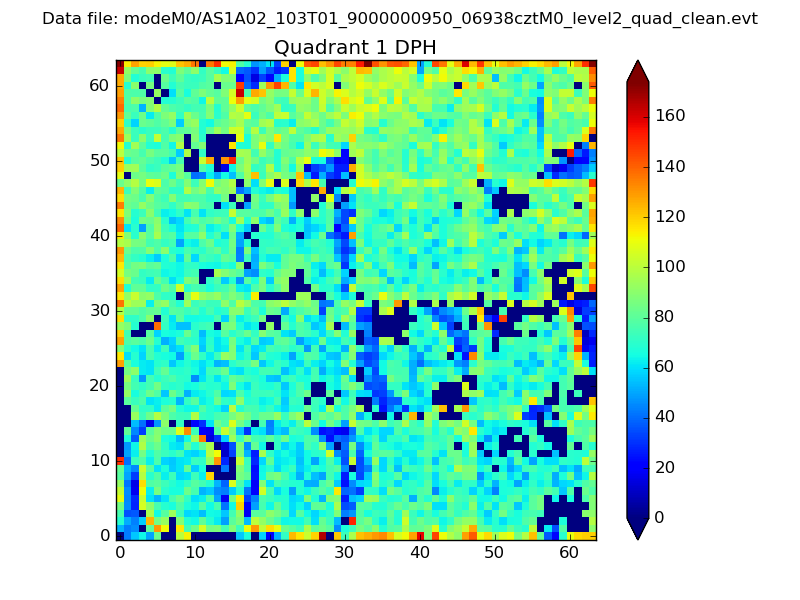 |
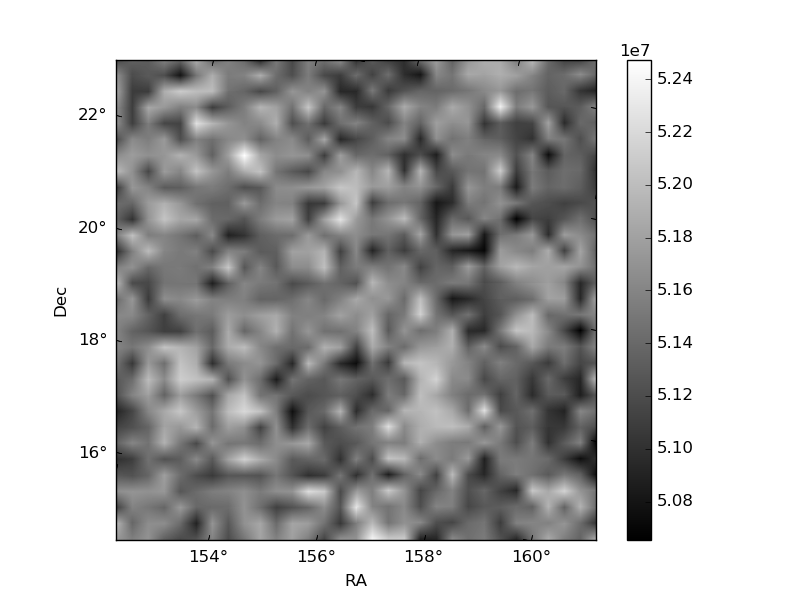
Quadrant B |
|---|---|---|---|
| Quadrant D | 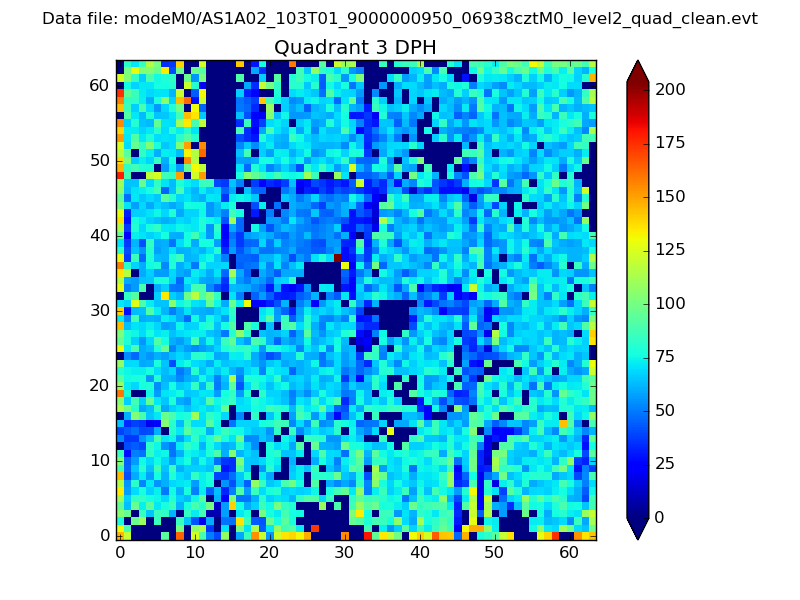 |
 |
Quadrant C |
| Plot type | Count rate plots | Images |
|---|---|---|
| Comparison with Poisson distribution Blue bars denote a histogram of data divided into 1 sec bins. Red curve is a Poisson curve with rate = median count rate of data. |
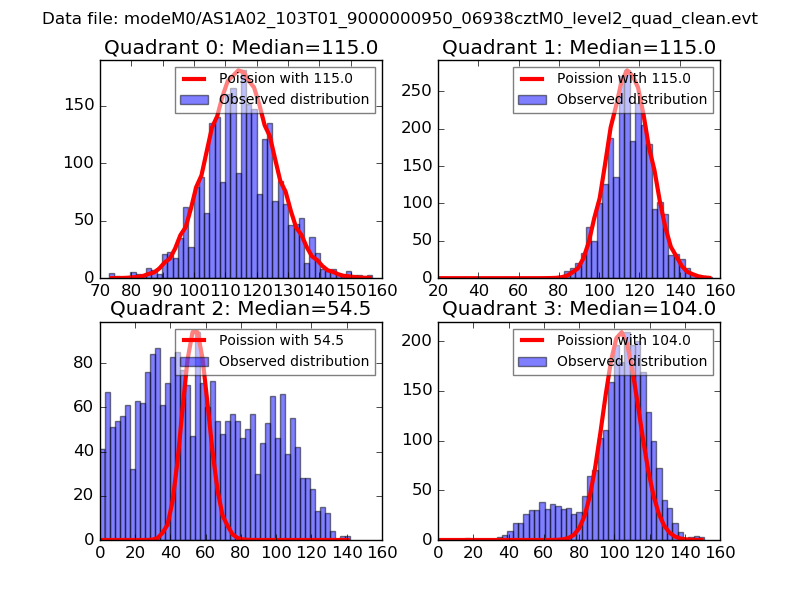 |
 |
| Quadrant-wise count rates Data is divided into 100 sec bins |
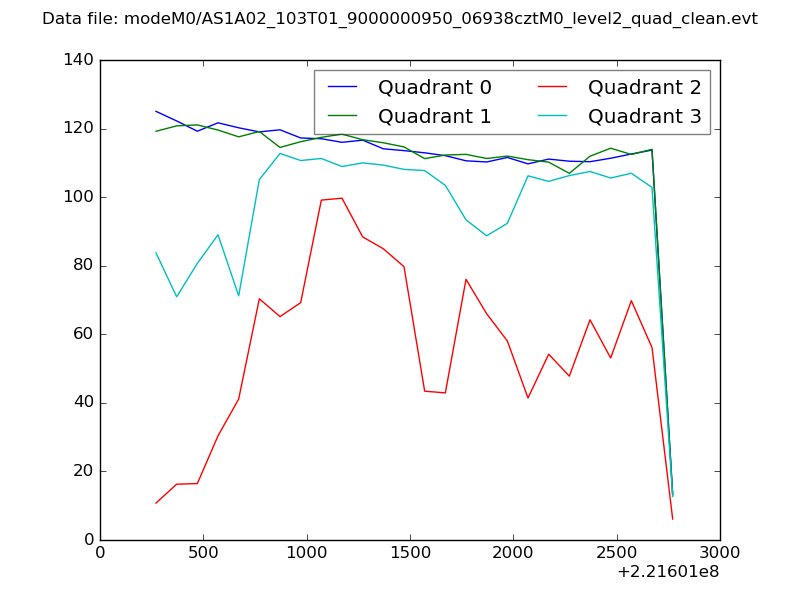 |
|
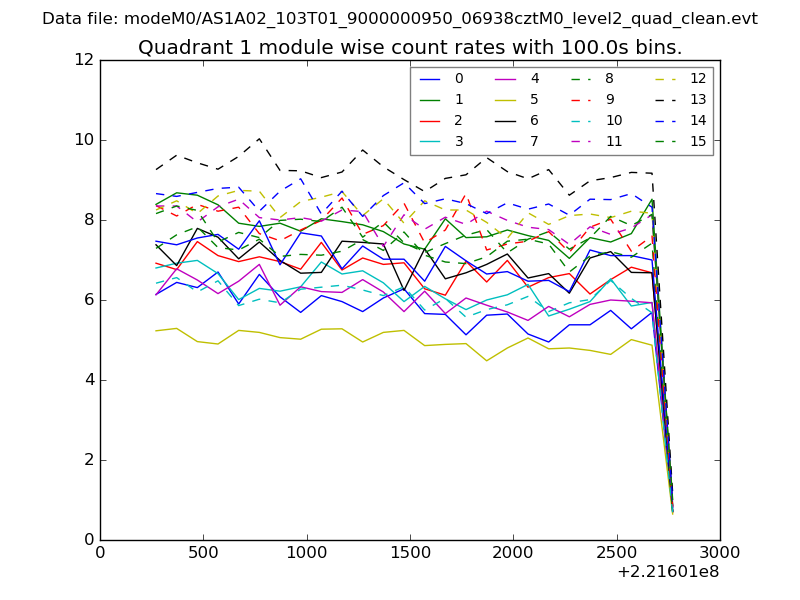
| Module-wise count rates for Quadrant A Data is divided into 100 sec bins |
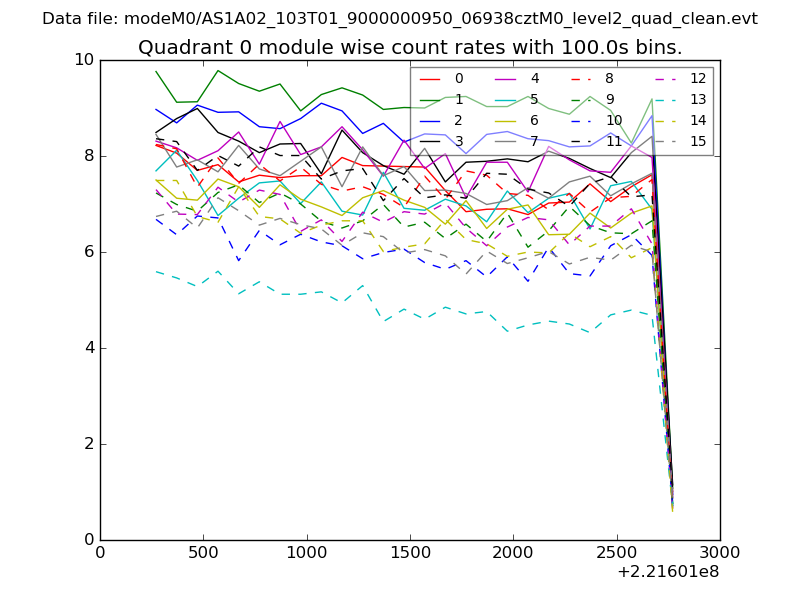 |
 |
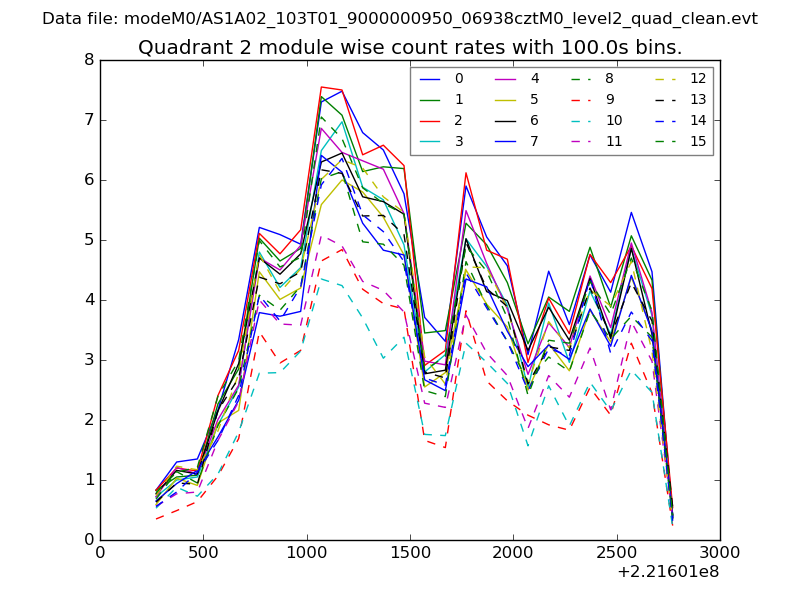
| Module-wise count rates for Quadrant B Data is divided into 100 sec bins |
 |
 |
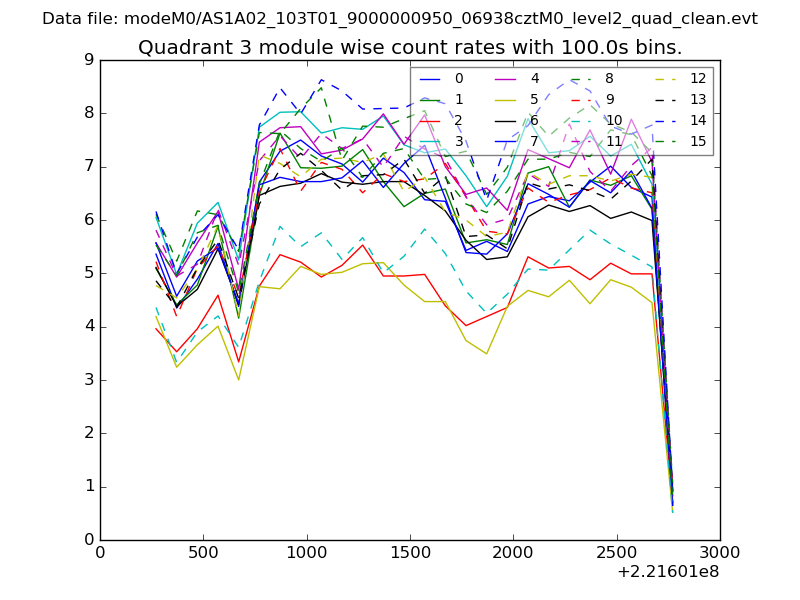
| Module-wise count rates for Quadrant C Data is divided into 100 sec bins |
 |
 |
| Module-wise count rates for Quadrant D Data is divided into 100 sec bins |
 |
 |
| Parameter | Plot |
|---|---|
| CZT HV Monitor | 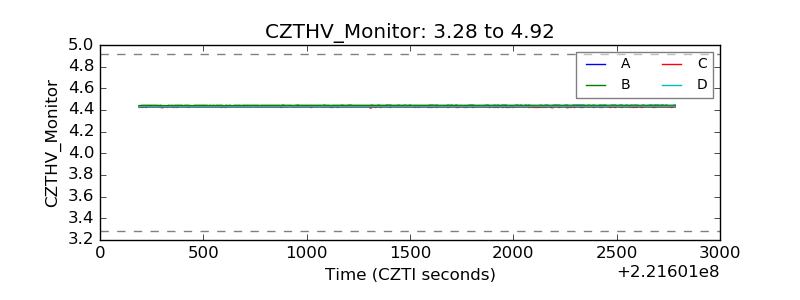 |
| D_VDD | 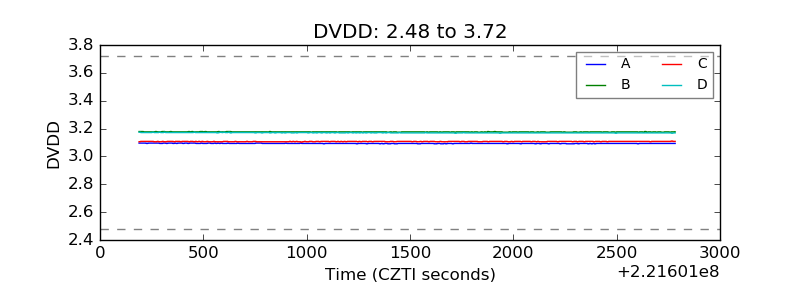 |
| Temperature 1 | 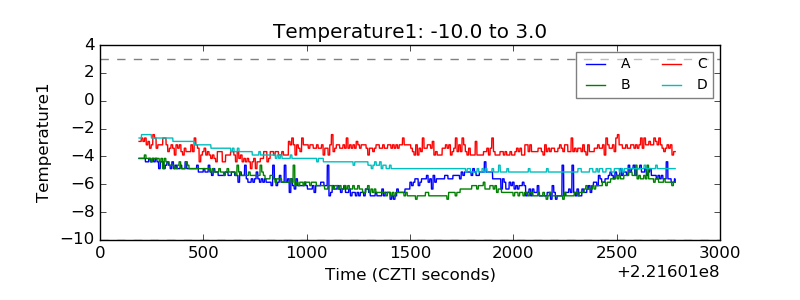 |
| Veto HV Monitor | 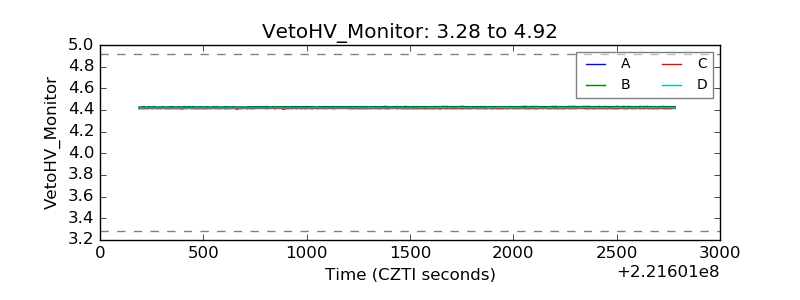 |
| Veto LLD | 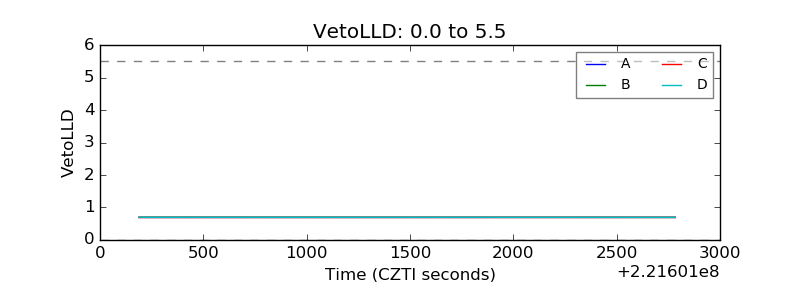 |
| Alpha Counter | 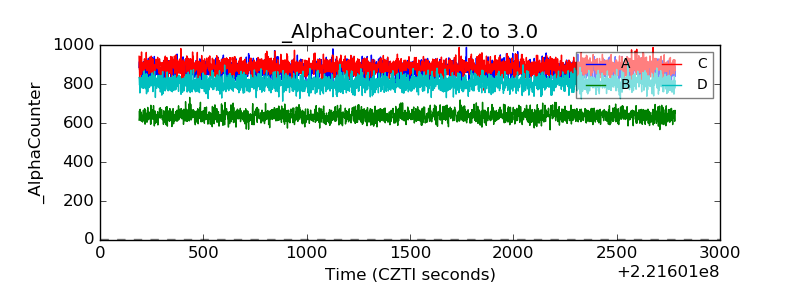 |
| _CPM_Rate | 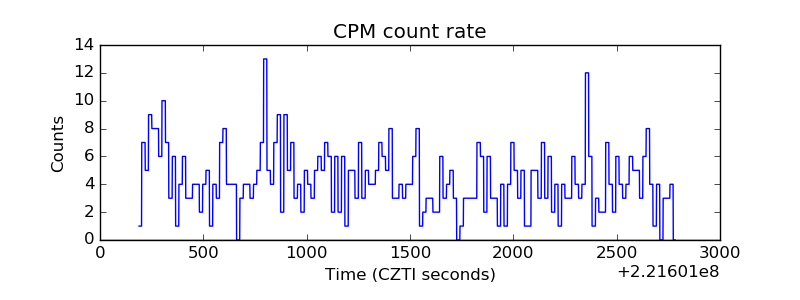 |
| CZT Counter | 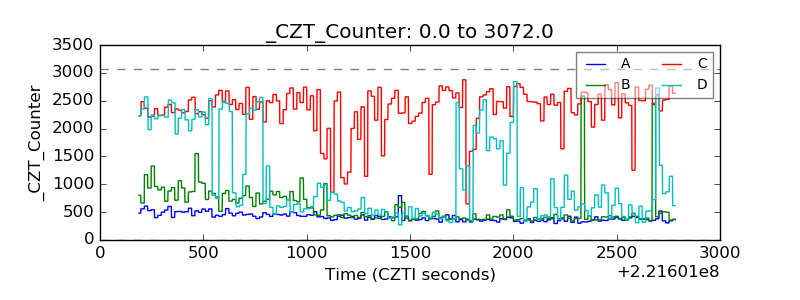 |
| +2.5 Volts monitor | 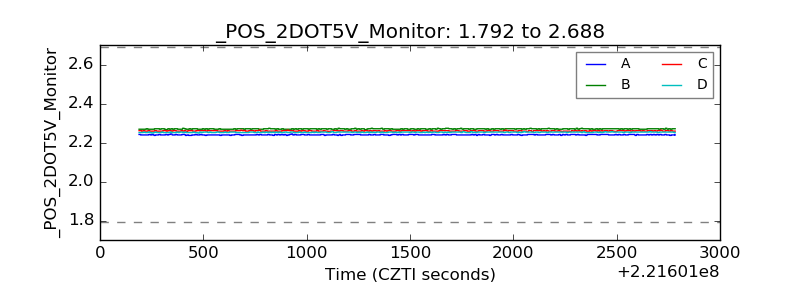 |
| +5 Volts monitor | 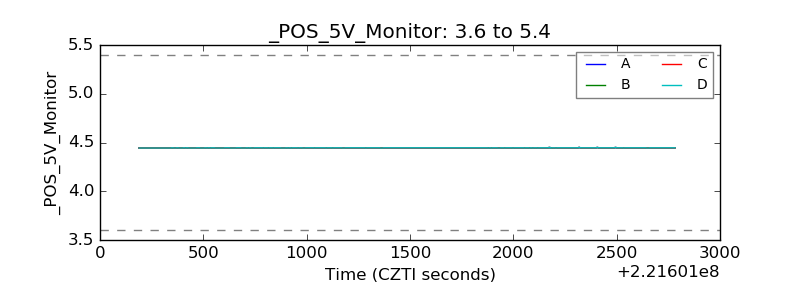 |
| _ROLL_ROT | 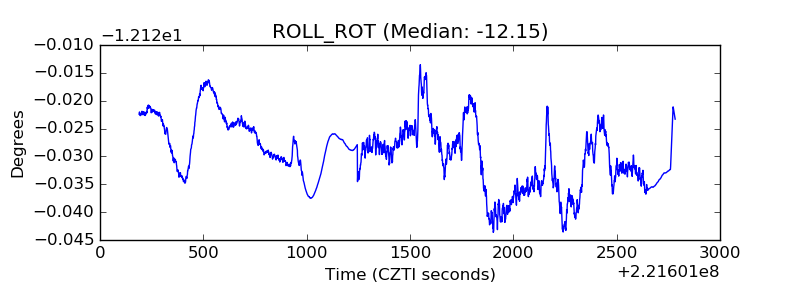 |
| _Roll_DEC | 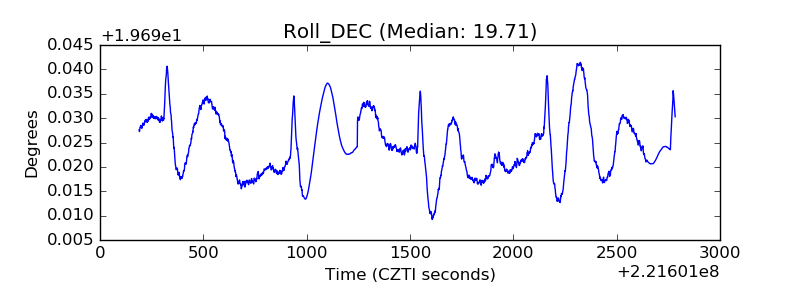 |
| _Roll_RA | 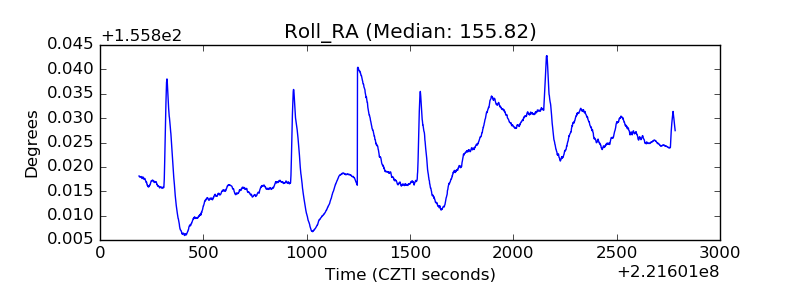 |
| Veto Counter | 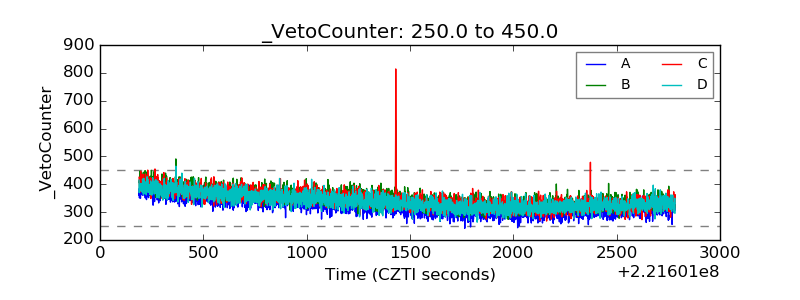 |