| Param | Original file | Final file |
|---|---|---|
| Filename | modeM0/AS1A02_103T01_9000000950_06941cztM0_level2.evt | modeM0/AS1A02_103T01_9000000950_06941cztM0_level2_quad_clean.evt |
| Size (bytes) | 493,416,000 | 59,512,320 |
| Size | 470.6 MB | 56.8 MB |
| Events in quadrant A | 2,452,786 | 371,814 |
| Events in quadrant B | 2,678,837 | 374,902 |
| Events in quadrant C | 6,042,141 | 338,156 |
| Events in quadrant D | 3,417,221 | 352,937 |
| Mode SS | |||
|---|---|---|---|
| Quadrant | BADHDUFLAG | Total packets | Discarded packets |
| A | 0 | 106 | 0 |
| B | 0 | 106 | 0 |
| C | 0 | 106 | 0 |
| D | 0 | 106 | 0 |
| Mode M9 | |||
|---|---|---|---|
| Quadrant | BADHDUFLAG | Total packets | Discarded packets |
| A | 0 | 2 | 0 |
| B | 0 | 2 | 0 |
| C | 0 | 2 | 0 |
| D | 0 | 2 | 0 |
| Mode M0 | |||
|---|---|---|---|
| Quadrant | BADHDUFLAG | Total packets | Discarded packets |
| A | 0 | 10831 | 2 |
| B | 0 | 11465 | 1 |
| C | 0 | 21485 | 1 |
| D | 0 | 13749 | 1 |
| Quadrant | Total seconds | Saturated seconds | Saturation percentage |
|---|---|---|---|
| A | 5191 | 46 | 0.886149% |
| B | 5191 | 97 | 1.868619% |
| C | 5191 | 1139 | 21.941822% |
| D | 5191 | 51 | 0.982470% |
Noise dominated data is calculated using 1-second bins in cleaned event files. If a bin has >2000 counts, and if more than 50% of those come from <1% of pixels, then it is considered to be noise-dominated and hence unusable.
| Quadrant | # 1 sec bins | Bins with >0 counts | Bins with >2000 counts | High rate bins dominated by noise | Noise dominated (total time) | Noise dominated (detector-on time) | Marked lightcurve |
|---|---|---|---|---|---|---|---|
| A | 5381 | 5192 | 4 | 4 | 0.07% | 0.08% | 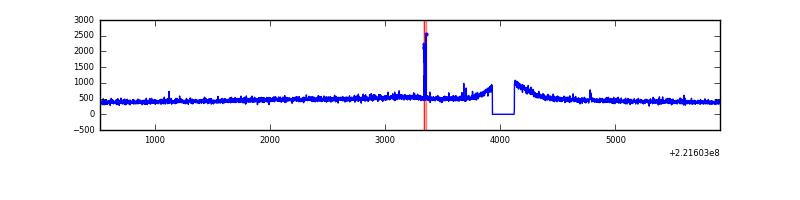 |
| B | 5381 | 5192 | 26 | 26 | 0.48% | 0.50% | 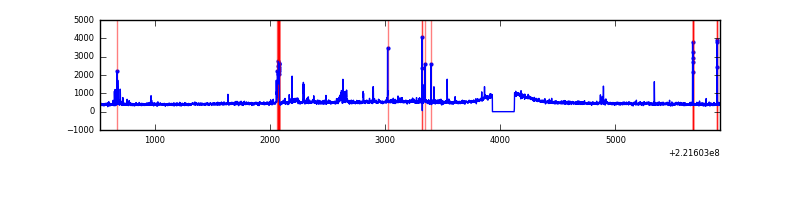 |
| C | 5381 | 5192 | 974 | 974 | 18.10% | 18.76% | 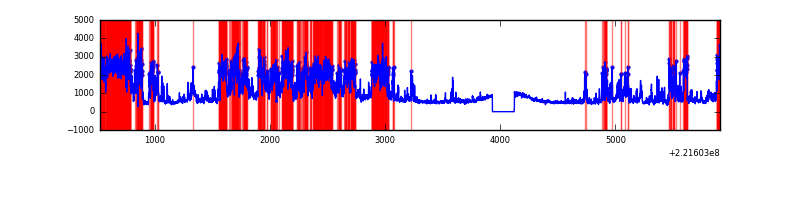 |
| D | 5381 | 5192 | 8 | 8 | 0.15% | 0.15% | 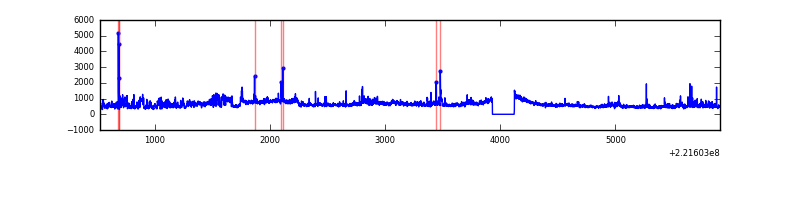 |
Top three noisy pixels from each quadrant. If the there are fewer than three noisy pixels in the level2.evt file, extra rows are filled as -1
| Pixel properties | Quadrant properties | ||||||
|---|---|---|---|---|---|---|---|
| Quadrant | DetID | PixID | Counts | Sigma | Mean | Median | Sigma |
| A | 4 | 2 | 18548 | 137.75 | 630 | 615 | 130.2 |
| A | 0 | 226 | 6064 | 41.86 | 630 | 615 | 130.2 |
| A | 12 | 194 | 5897 | 40.57 | 630 | 615 | 130.2 |
| B | 0 | 228 | 93831 | 745.95 | 633 | 617 | 125.0 |
| B | 0 | 219 | 54960 | 434.88 | 633 | 617 | 125.0 |
| B | 4 | 48 | 48403 | 382.41 | 633 | 617 | 125.0 |
| C | 9 | 247 | 3794301 | 28442.89 | 568 | 572 | 133.4 |
| C | 7 | 247 | 17938 | 130.2 | 568 | 572 | 133.4 |
| C | 8 | 128 | 4873 | 32.25 | 568 | 572 | 133.4 |
| D | 8 | 195 | 446486 | 2931.63 | 612 | 593 | 152.1 |
| D | 1 | 20 | 390830 | 2565.71 | 612 | 593 | 152.1 |
| D | 2 | 136 | 83721 | 546.55 | 612 | 593 | 152.1 |
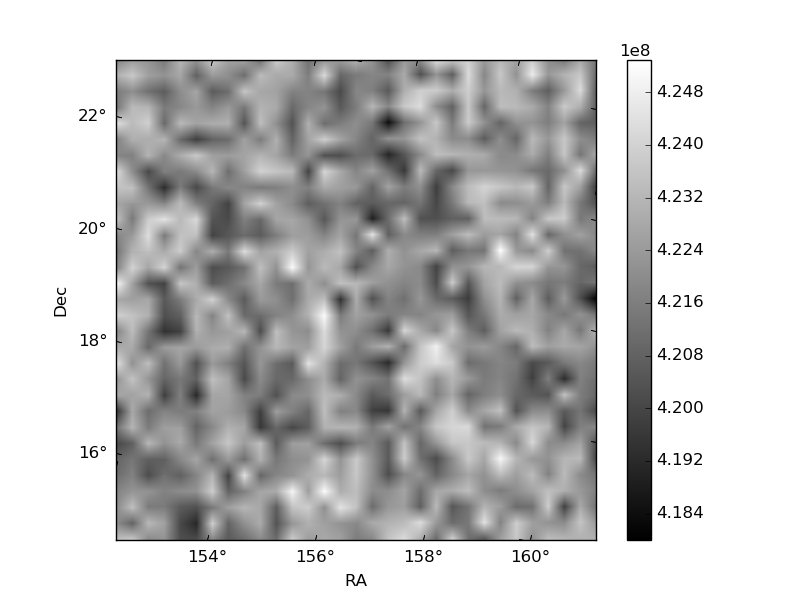
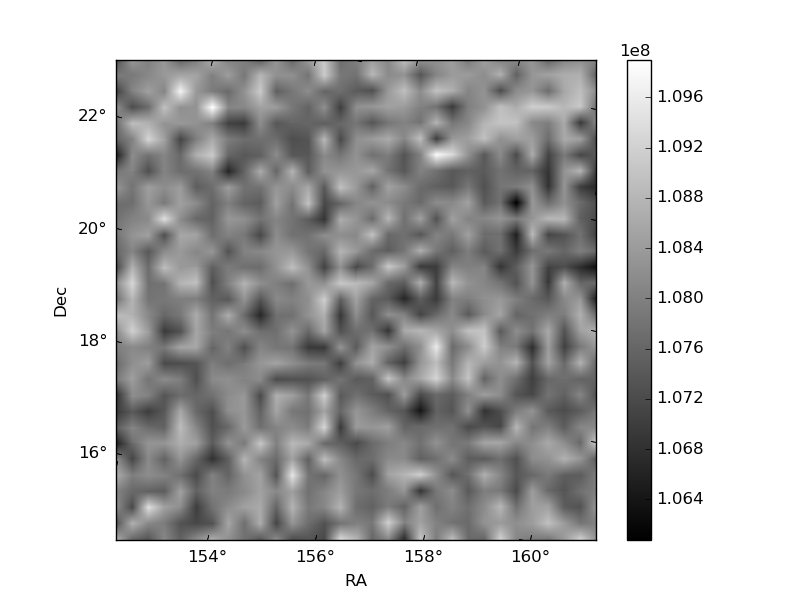
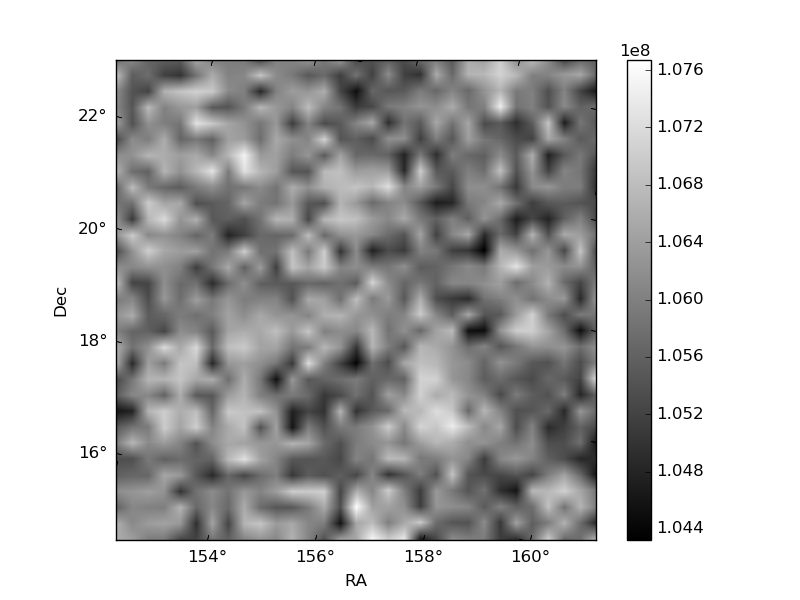
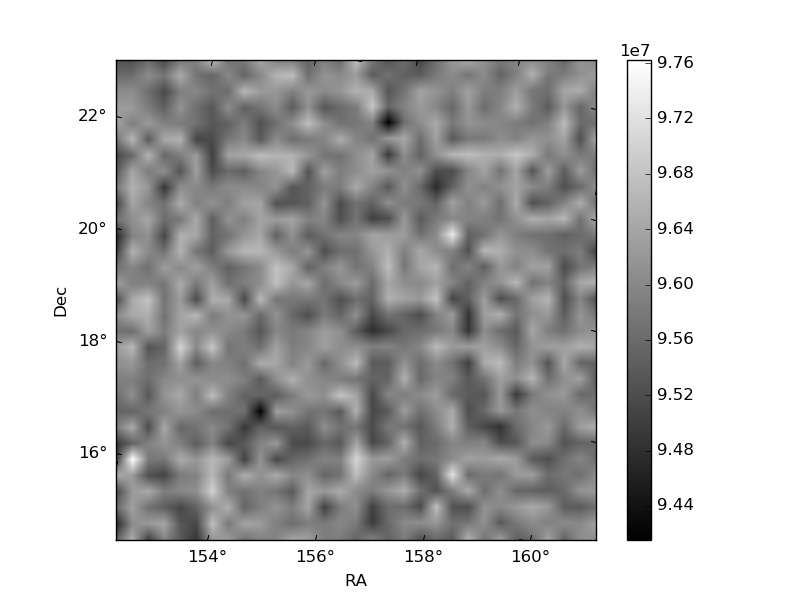
Histogram calculated using DETX and DETY for each event in the final _common_clean file
| Quadrant A | 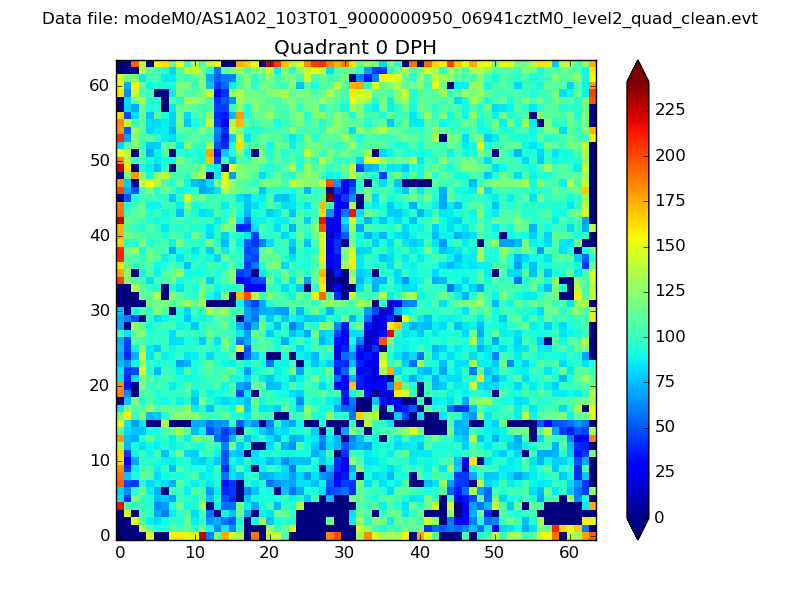 |
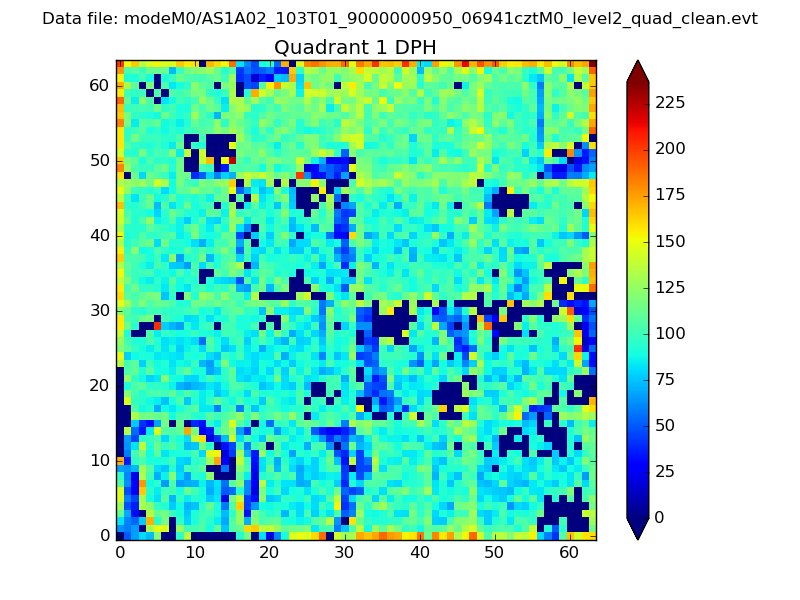 |
Quadrant B |
|---|---|---|---|
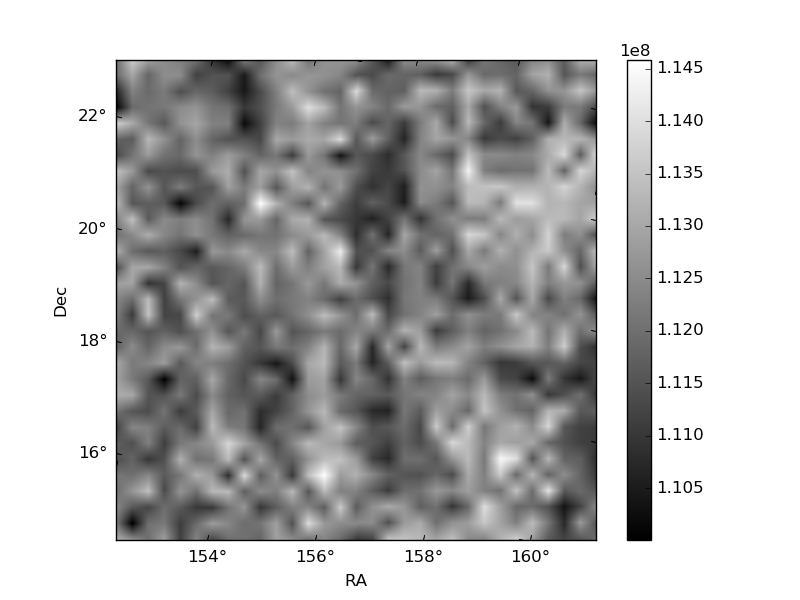
| Quadrant D | 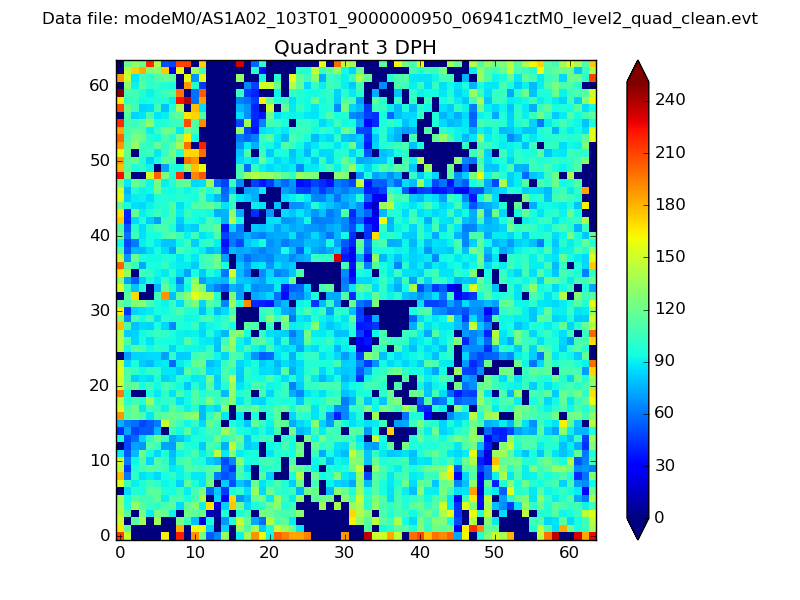 |
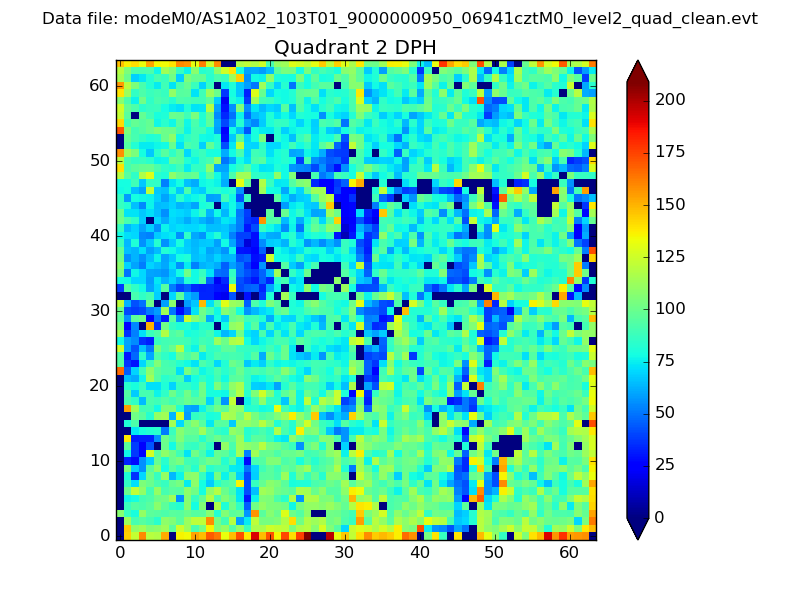 |
Quadrant C |
| Plot type | Count rate plots | Images |
|---|---|---|
| Comparison with Poisson distribution Blue bars denote a histogram of data divided into 1 sec bins. Red curve is a Poisson curve with rate = median count rate of data. |
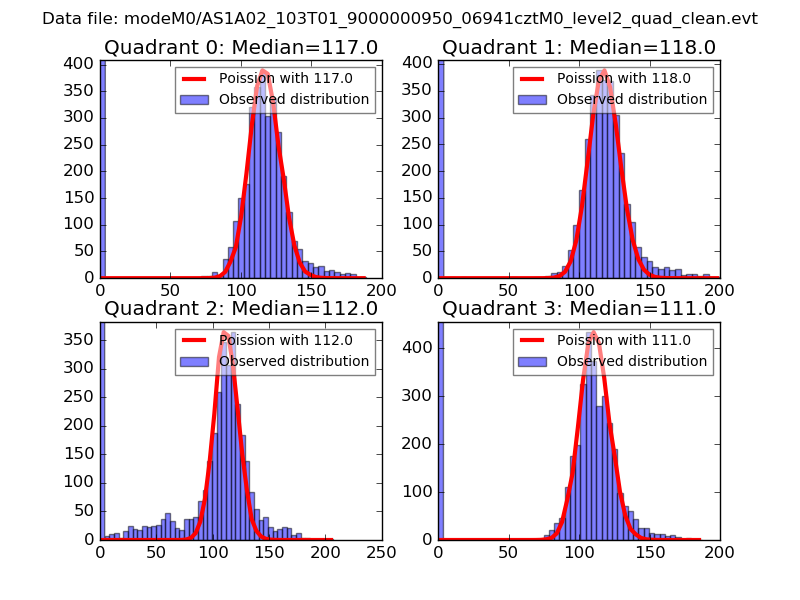 |
 |
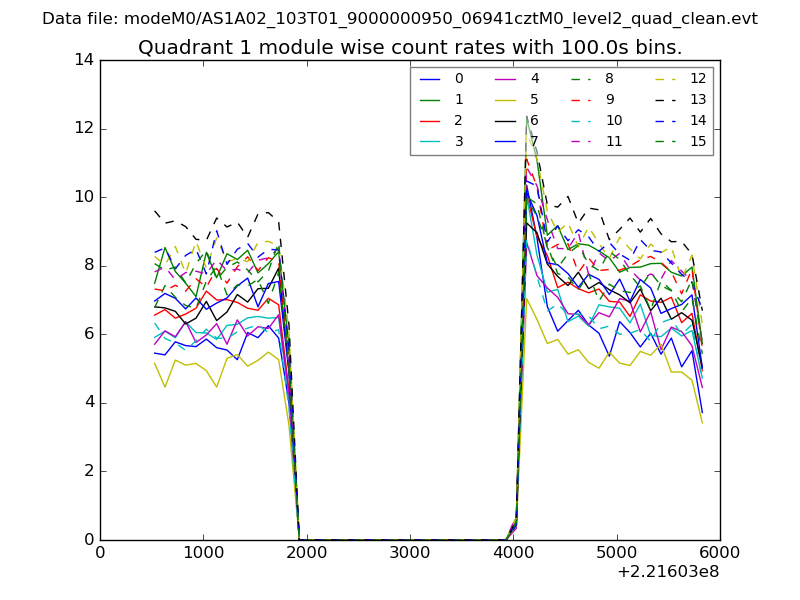
| Quadrant-wise count rates Data is divided into 100 sec bins |
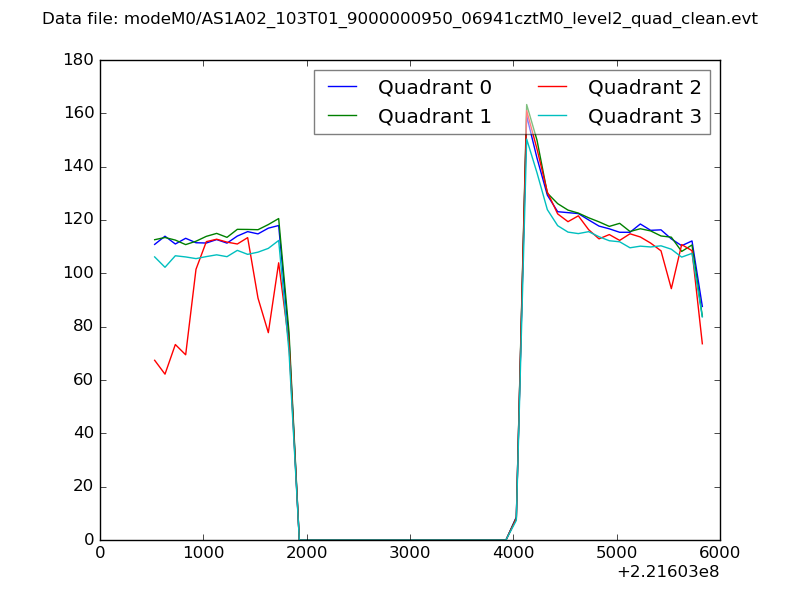 |
|
| Module-wise count rates for Quadrant A Data is divided into 100 sec bins |
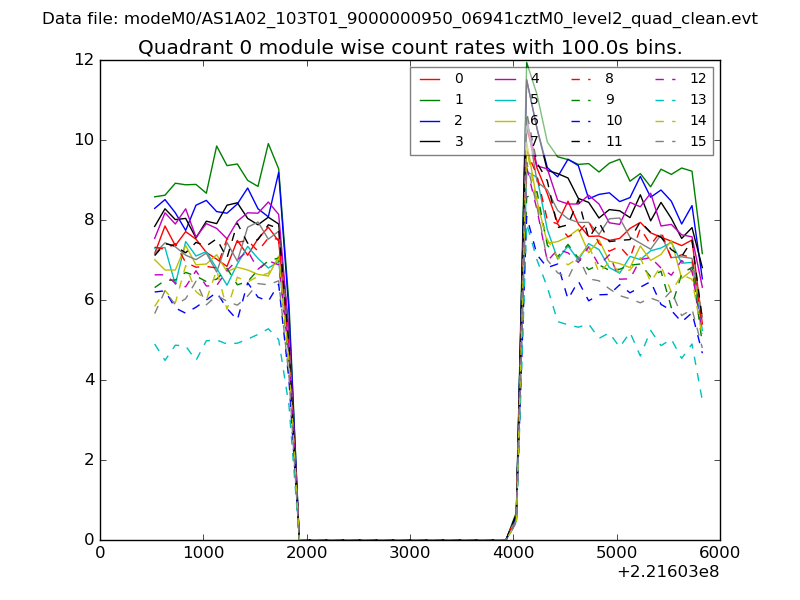 |
 |
| Module-wise count rates for Quadrant B Data is divided into 100 sec bins |
 |
 |
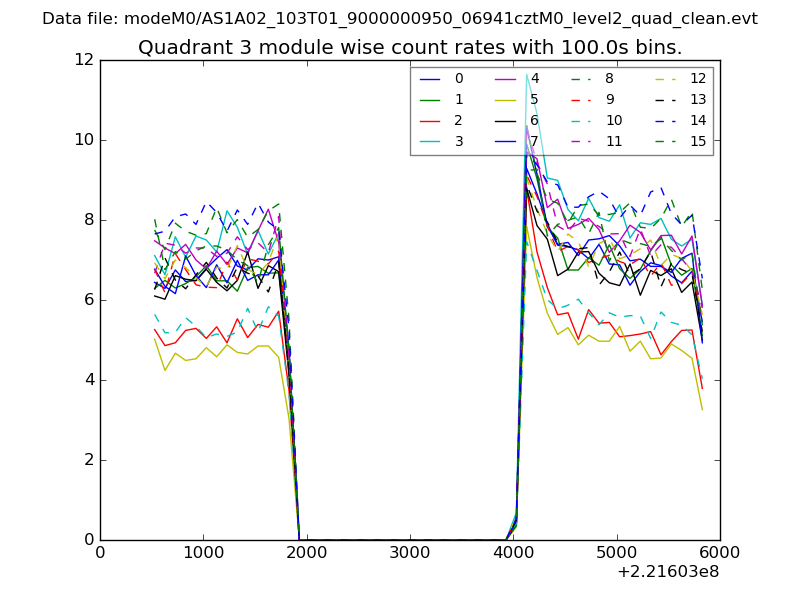
| Module-wise count rates for Quadrant C Data is divided into 100 sec bins |
 |
 |
| Module-wise count rates for Quadrant D Data is divided into 100 sec bins |
 |
 |
| Parameter | Plot |
|---|---|
| CZT HV Monitor | 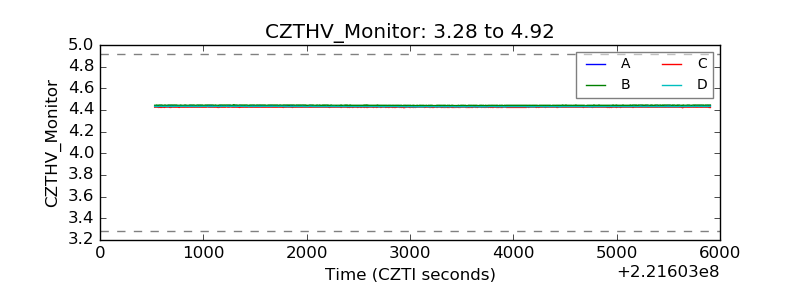 |
| D_VDD | 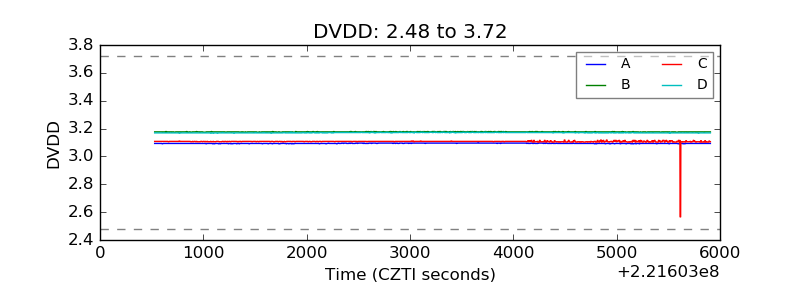 |
| Temperature 1 | 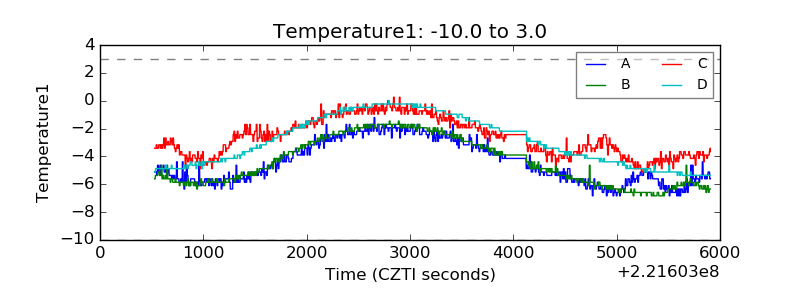 |
| Veto HV Monitor | 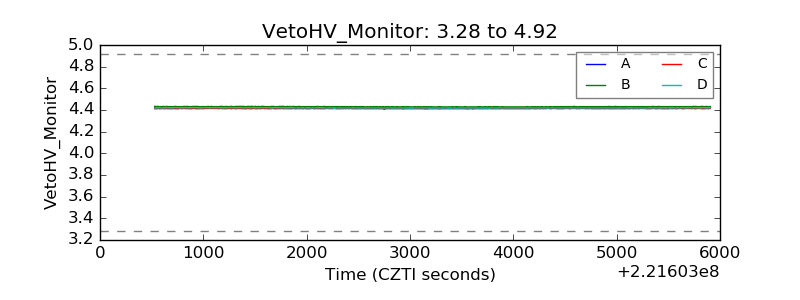 |
| Veto LLD | 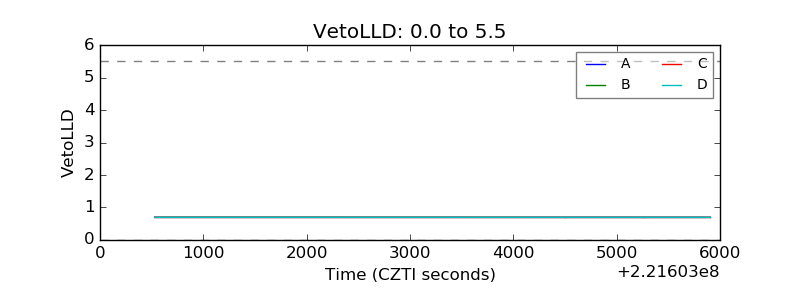 |
| Alpha Counter | 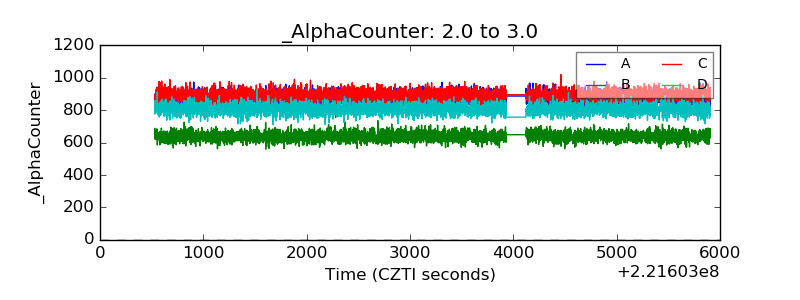 |
| _CPM_Rate | 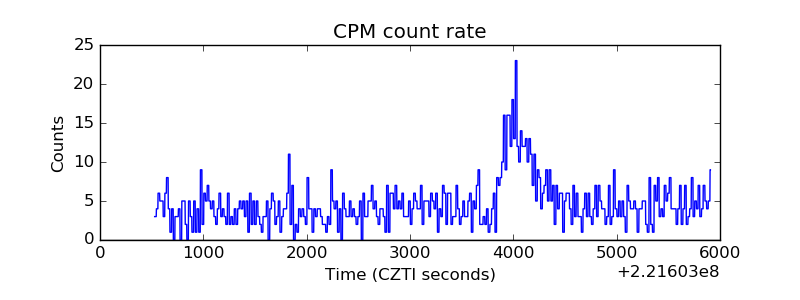 |
| CZT Counter | 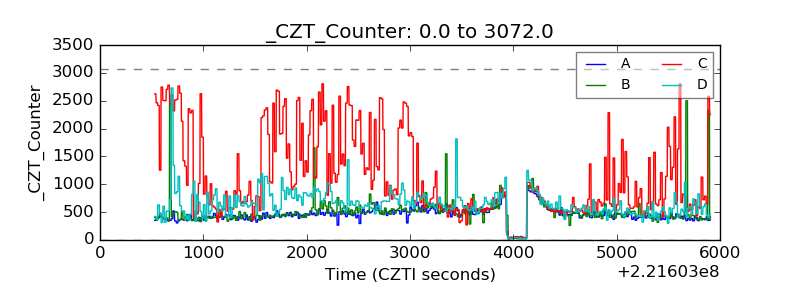 |
| +2.5 Volts monitor |  |
| +5 Volts monitor | 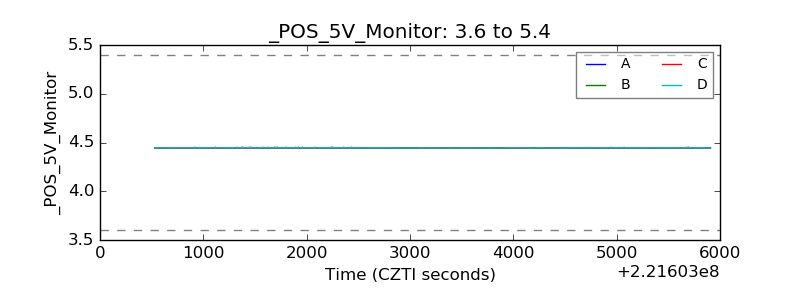 |
| _ROLL_ROT | 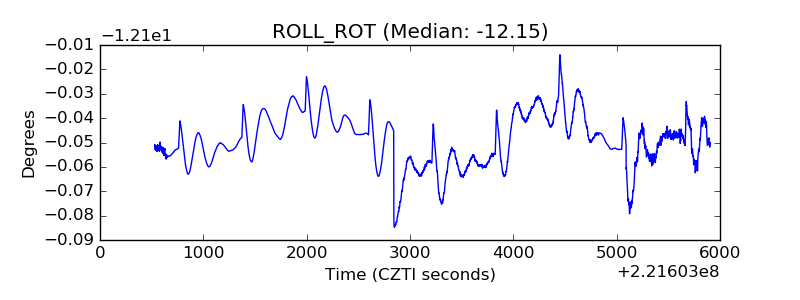 |
| _Roll_DEC | 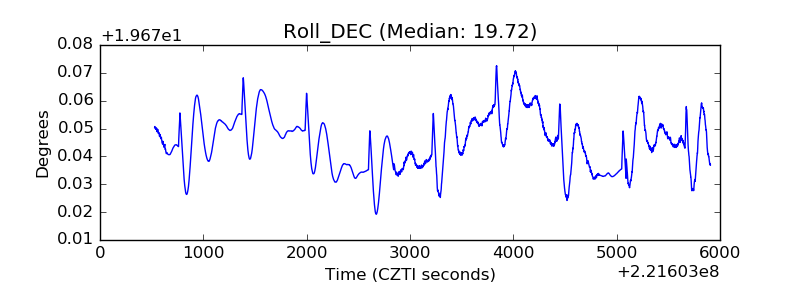 |
| _Roll_RA | 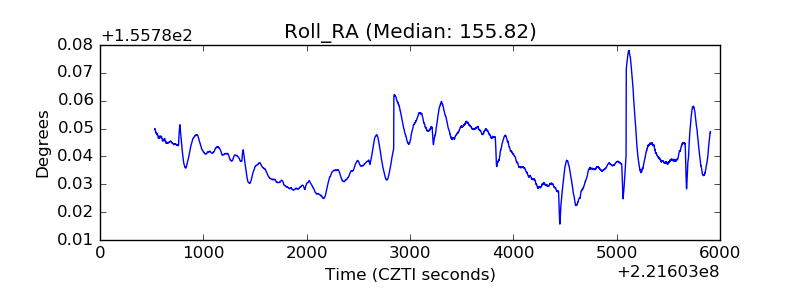 |
| Veto Counter | 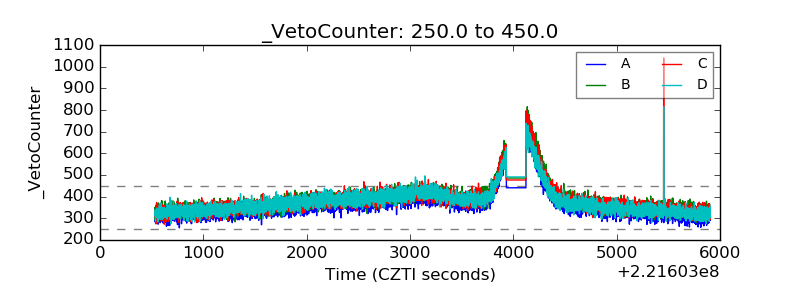 |