| Param | Original file | Final file |
|---|---|---|
| Filename | modeM0/AS1A02_103T01_9000000950_06942cztM0_level2.evt | modeM0/AS1A02_103T01_9000000950_06942cztM0_level2_quad_clean.evt |
| Size (bytes) | 2,189,586,240 | 265,481,280 |
| Size | 2.0 GB | 253.2 MB |
| Events in quadrant A | 10,738,255 | 1,716,265 |
| Events in quadrant B | 11,266,424 | 1,733,131 |
| Events in quadrant C | 29,738,966 | 1,328,245 |
| Events in quadrant D | 12,984,827 | 1,645,388 |
| Mode SS | |||
|---|---|---|---|
| Quadrant | BADHDUFLAG | Total packets | Discarded packets |
| A | 0 | 478 | 0 |
| B | 0 | 478 | 0 |
| C | 0 | 478 | 0 |
| D | 0 | 478 | 0 |
| Mode M9 | |||
|---|---|---|---|
| Quadrant | BADHDUFLAG | Total packets | Discarded packets |
| A | 0 | 25 | 0 |
| B | 0 | 25 | 0 |
| C | 0 | 25 | 0 |
| D | 0 | 25 | 0 |
| Mode M0 | |||
|---|---|---|---|
| Quadrant | BADHDUFLAG | Total packets | Discarded packets |
| A | 0 | 48399 | 5 |
| B | 0 | 49612 | 4 |
| C | 0 | 104117 | 4 |
| D | 0 | 54070 | 4 |
| Quadrant | Total seconds | Saturated seconds | Saturation percentage |
|---|---|---|---|
| A | 23476 | 177 | 0.753961% |
| B | 23476 | 252 | 1.073437% |
| C | 23476 | 8087 | 34.447947% |
| D | 23476 | 226 | 0.962685% |
Noise dominated data is calculated using 1-second bins in cleaned event files. If a bin has >2000 counts, and if more than 50% of those come from <1% of pixels, then it is considered to be noise-dominated and hence unusable.
| Quadrant | # 1 sec bins | Bins with >0 counts | Bins with >2000 counts | High rate bins dominated by noise | Noise dominated (total time) | Noise dominated (detector-on time) | Marked lightcurve |
|---|---|---|---|---|---|---|---|
| A | 25996 | 23481 | 5 | 5 | 0.02% | 0.02% | 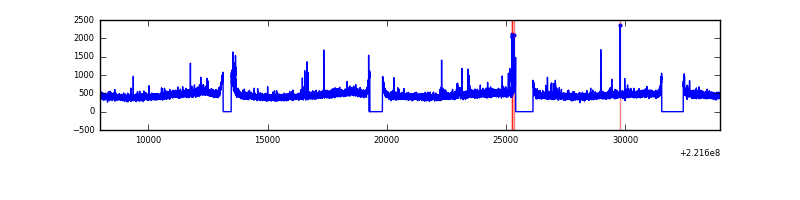 |
| B | 25996 | 23481 | 24 | 24 | 0.09% | 0.10% | 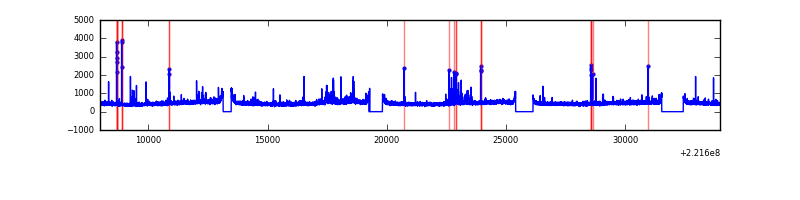 |
| C | 25996 | 23479 | 6920 | 6920 | 26.62% | 29.47% | 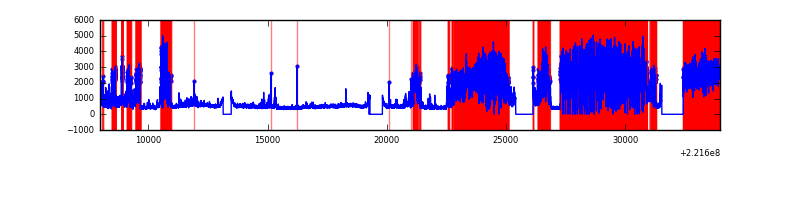 |
| D | 25996 | 23481 | 93 | 93 | 0.36% | 0.40% | 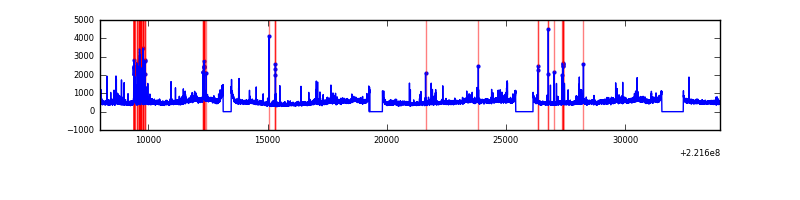 |
Top three noisy pixels from each quadrant. If the there are fewer than three noisy pixels in the level2.evt file, extra rows are filled as -1
| Pixel properties | Quadrant properties | ||||||
|---|---|---|---|---|---|---|---|
| Quadrant | DetID | PixID | Counts | Sigma | Mean | Median | Sigma |
| A | 4 | 2 | 134395 | 236.8 | 2727 | 2668 | 556.3 |
| A | 14 | 239 | 41408 | 69.64 | 2727 | 2668 | 556.3 |
| A | 8 | 15 | 27271 | 44.23 | 2727 | 2668 | 556.3 |
| B | 0 | 228 | 390725 | 739.2 | 2738 | 2674 | 525.0 |
| B | 4 | 81 | 90231 | 166.79 | 2738 | 2674 | 525.0 |
| B | 12 | 111 | 54076 | 97.92 | 2738 | 2674 | 525.0 |
| C | 9 | 247 | 21883406 | 47376.82 | 1994 | 2005 | 461.9 |
| C | 7 | 247 | 29091 | 58.65 | 1994 | 2005 | 461.9 |
| C | 12 | 4 | 20129 | 39.24 | 1994 | 2005 | 461.9 |
| D | 8 | 195 | 1920473 | 2973.13 | 2641 | 2556 | 645.1 |
| D | 2 | 14 | 311358 | 478.7 | 2641 | 2556 | 645.1 |
| D | 2 | 136 | 290616 | 446.55 | 2641 | 2556 | 645.1 |
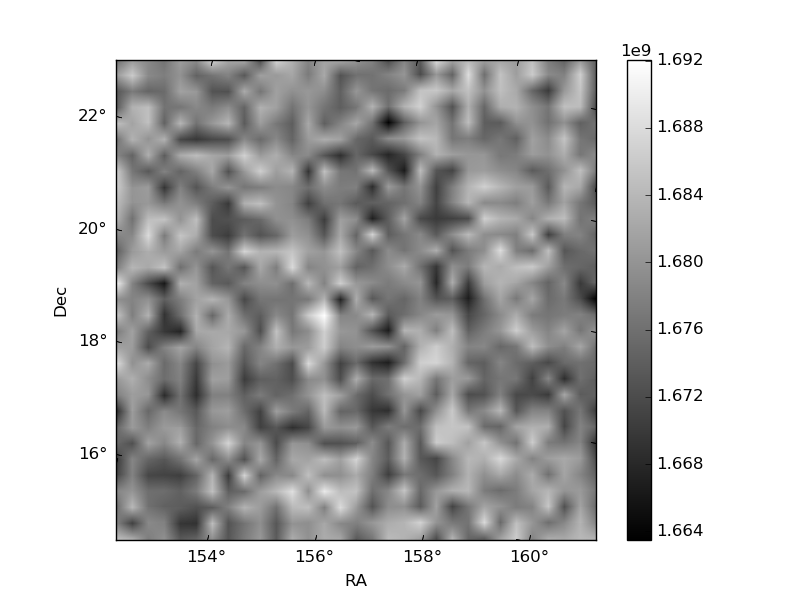
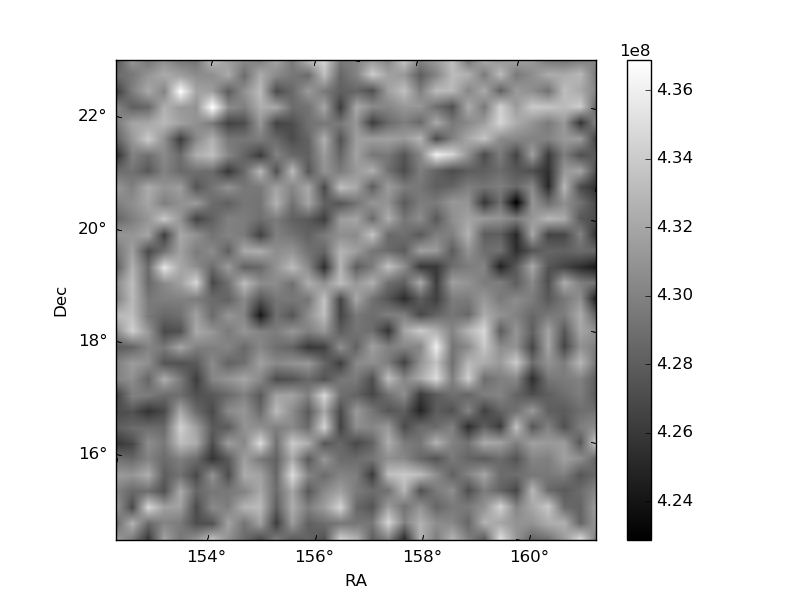
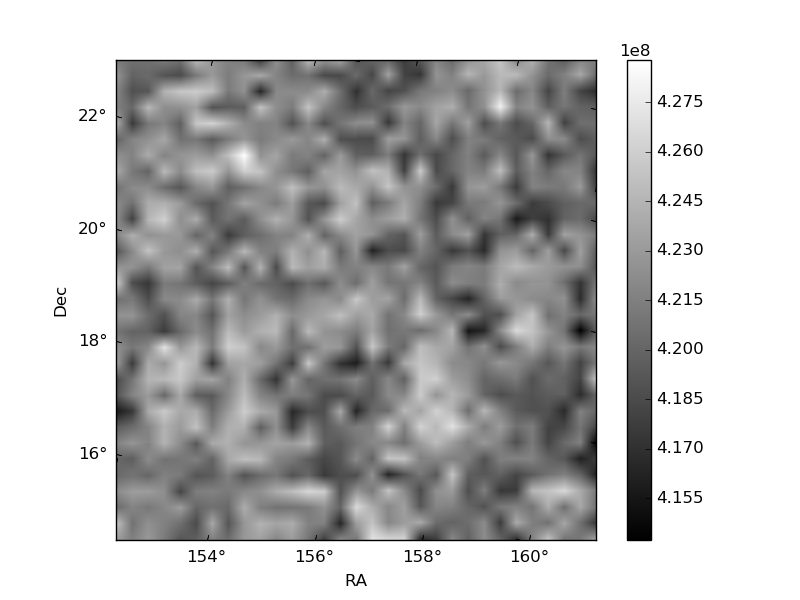
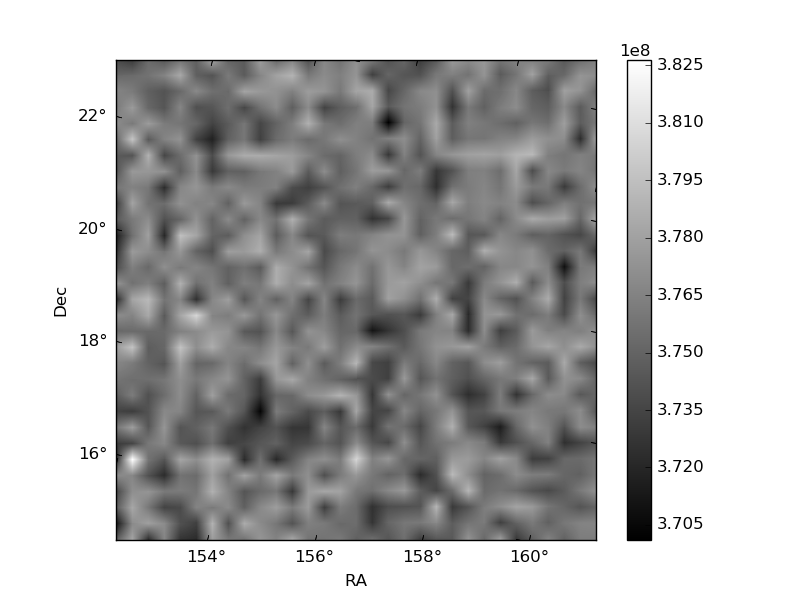
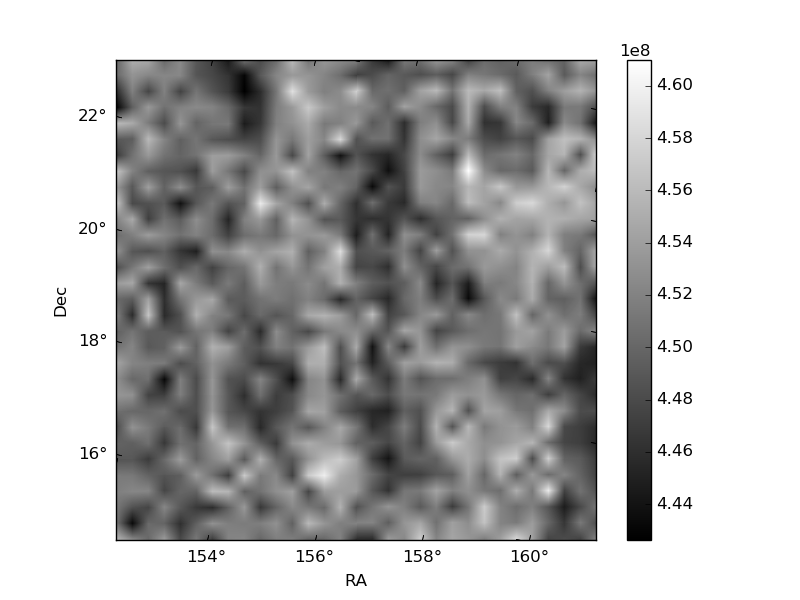
Histogram calculated using DETX and DETY for each event in the final _common_clean file
| Quadrant A | 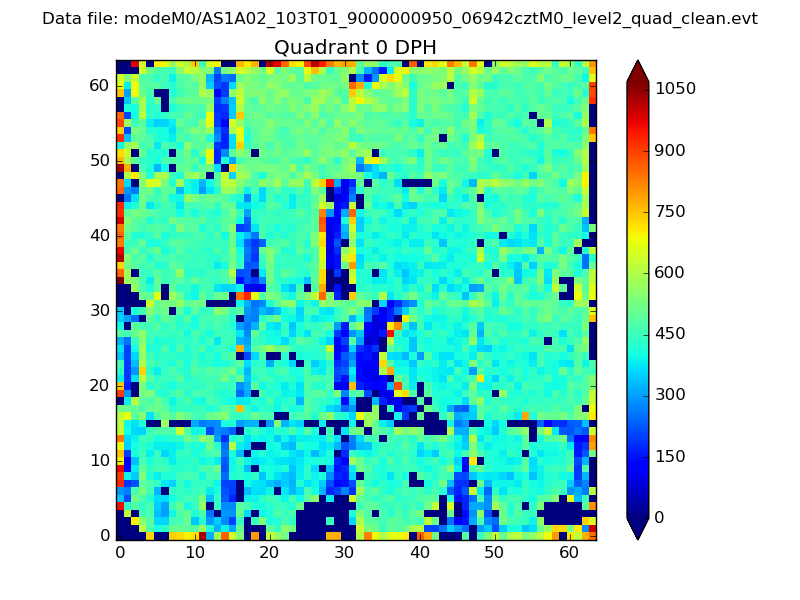 |
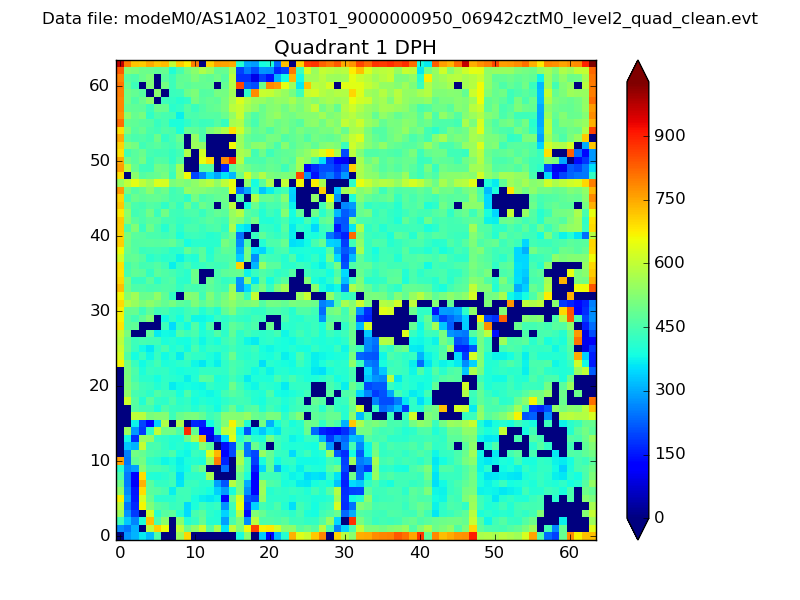 |
Quadrant B |
|---|---|---|---|
| Quadrant D | 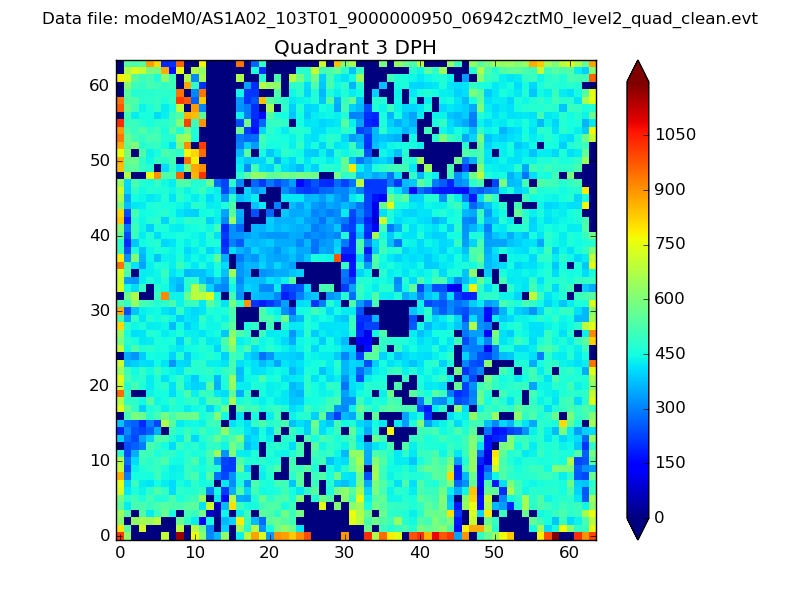 |
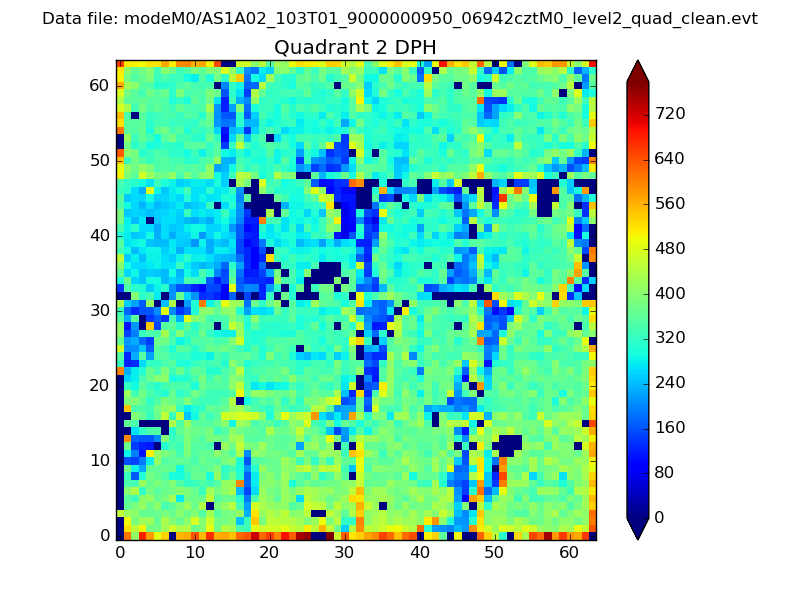 |
Quadrant C |
| Plot type | Count rate plots | Images |
|---|---|---|
| Comparison with Poisson distribution Blue bars denote a histogram of data divided into 1 sec bins. Red curve is a Poisson curve with rate = median count rate of data. |
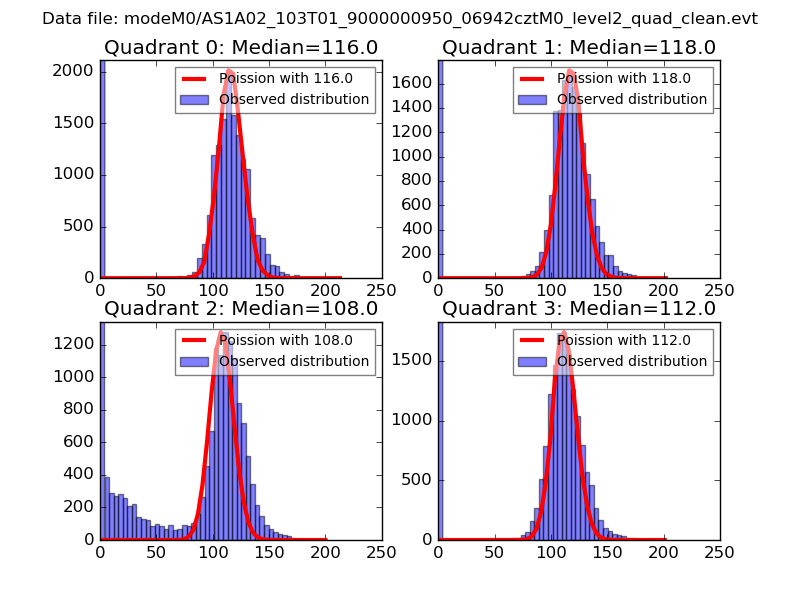 |
 |
| Quadrant-wise count rates Data is divided into 100 sec bins |
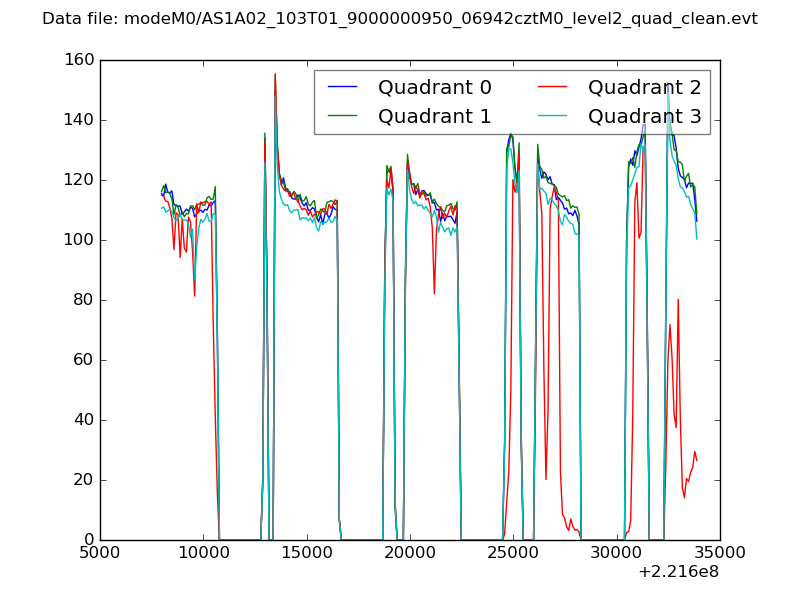 |
|
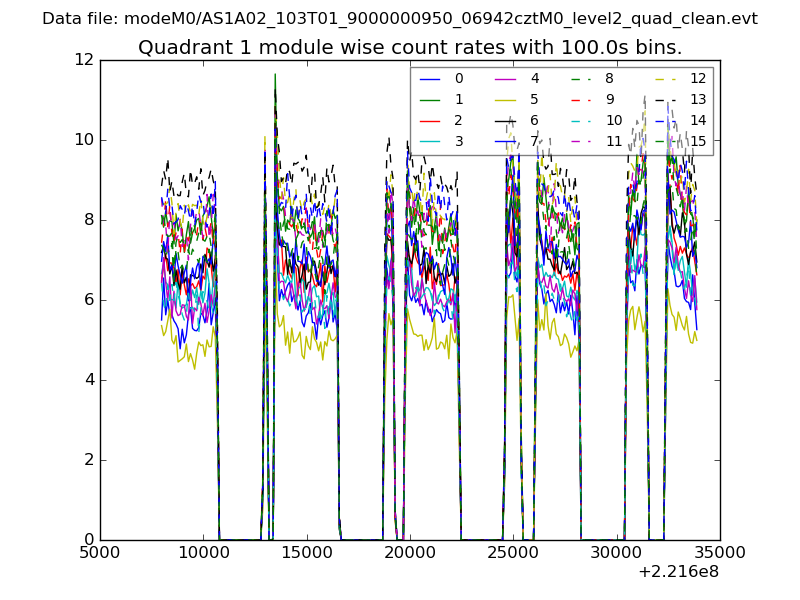
| Module-wise count rates for Quadrant A Data is divided into 100 sec bins |
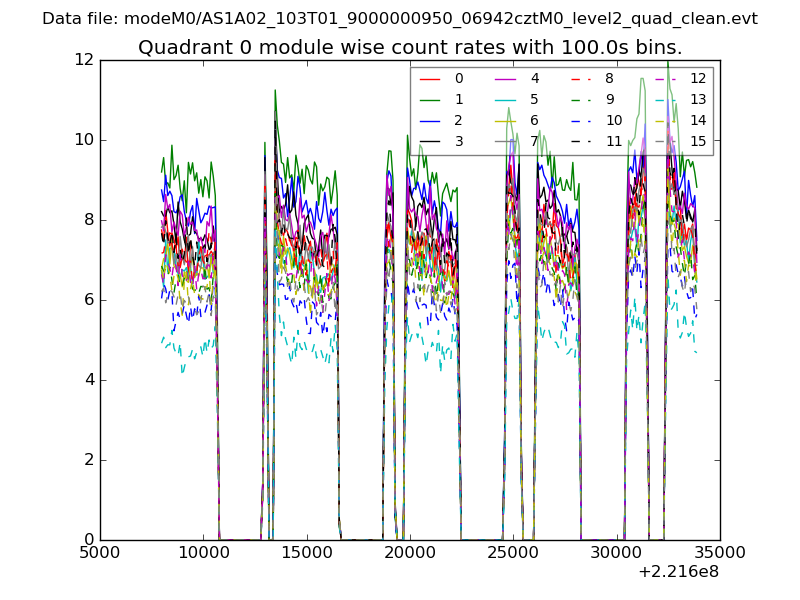 |
 |
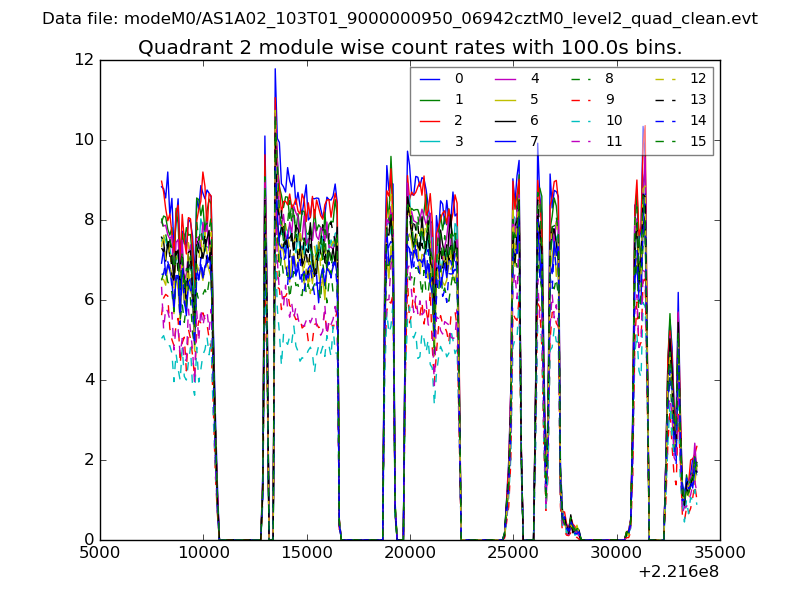
| Module-wise count rates for Quadrant B Data is divided into 100 sec bins |
 |
 |
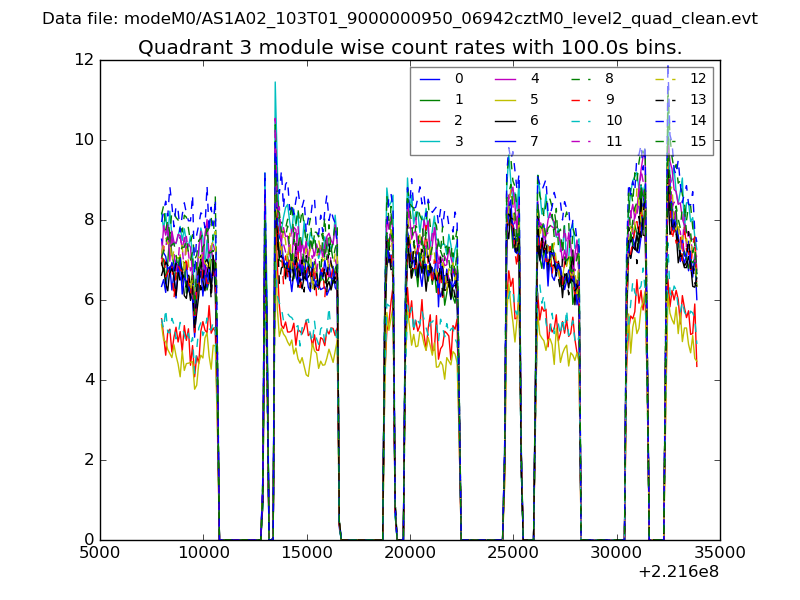
| Module-wise count rates for Quadrant C Data is divided into 100 sec bins |
 |
 |
| Module-wise count rates for Quadrant D Data is divided into 100 sec bins |
 |
 |
| Parameter | Plot |
|---|---|
| CZT HV Monitor | 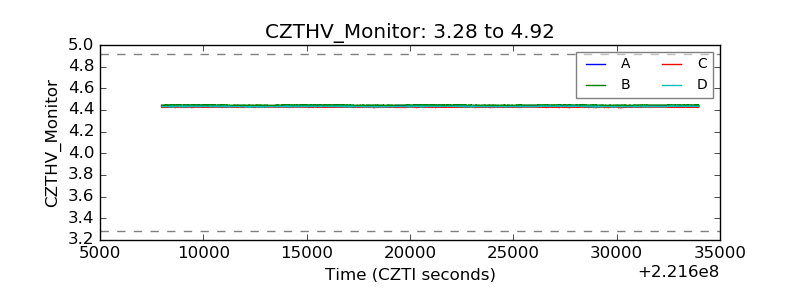 |
| D_VDD | 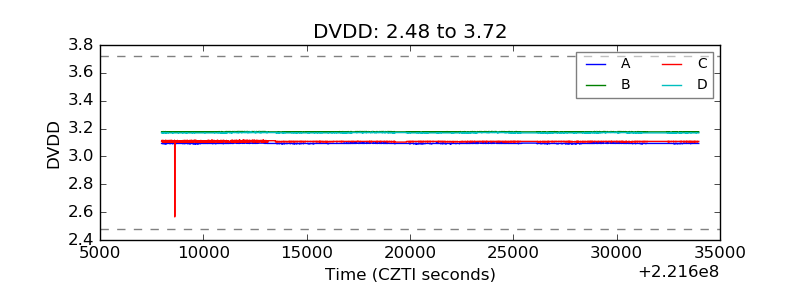 |
| Temperature 1 | 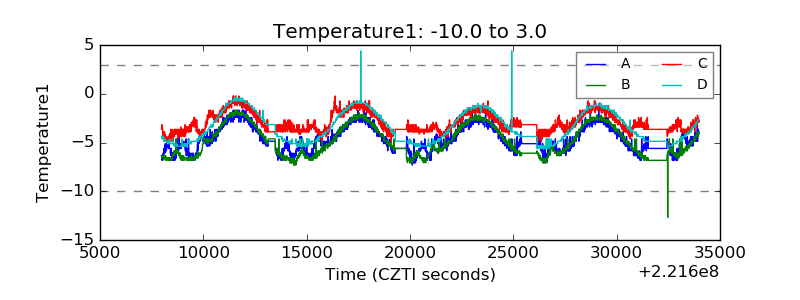 |
| Veto HV Monitor | 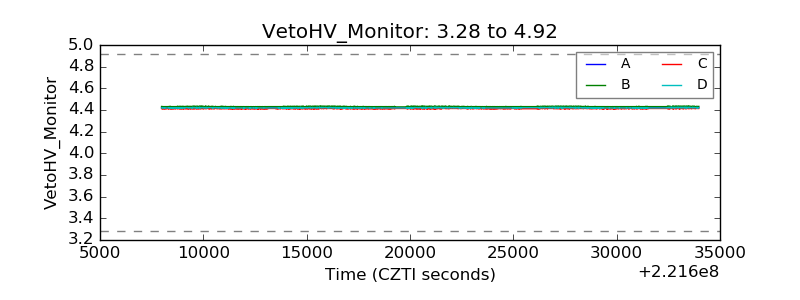 |
| Veto LLD | 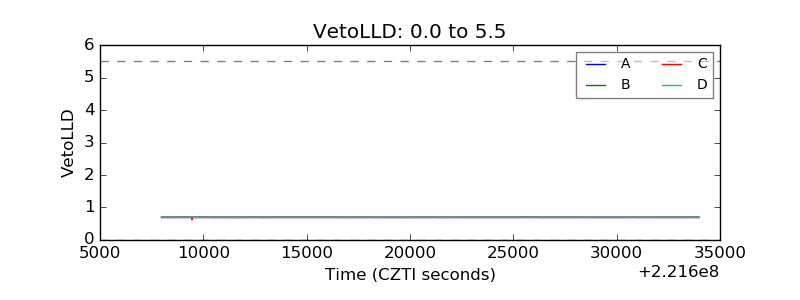 |
| Alpha Counter | 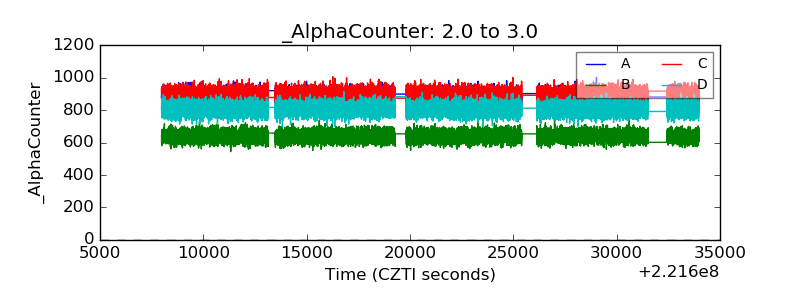 |
| _CPM_Rate | 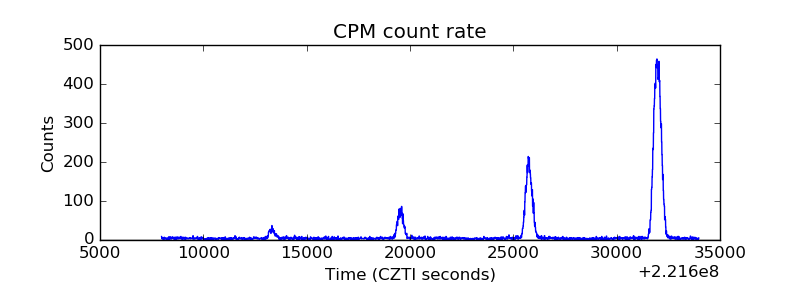 |
| CZT Counter | 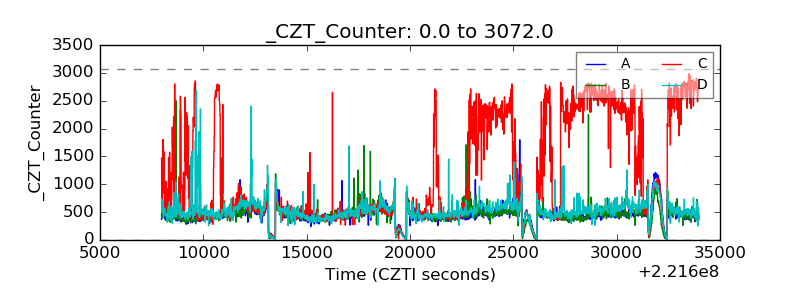 |
| +2.5 Volts monitor | 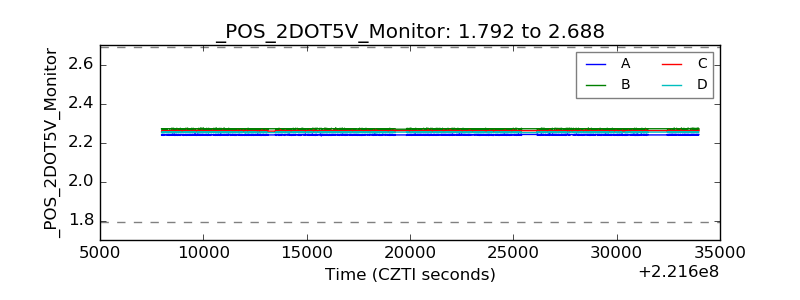 |
| +5 Volts monitor | 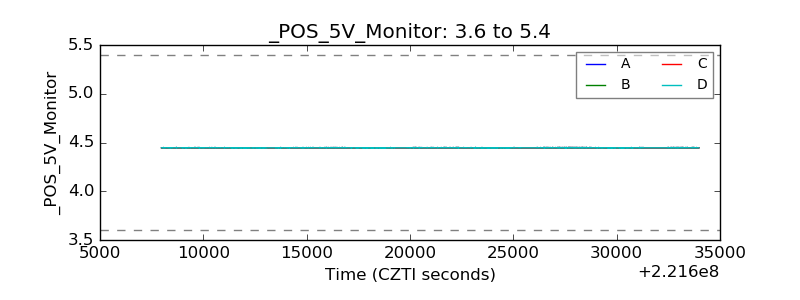 |
| _ROLL_ROT | 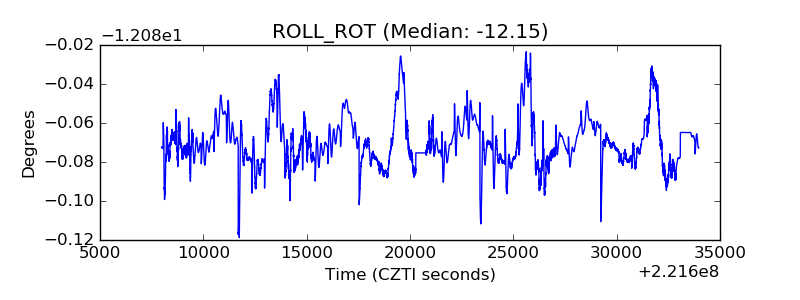 |
| _Roll_DEC | 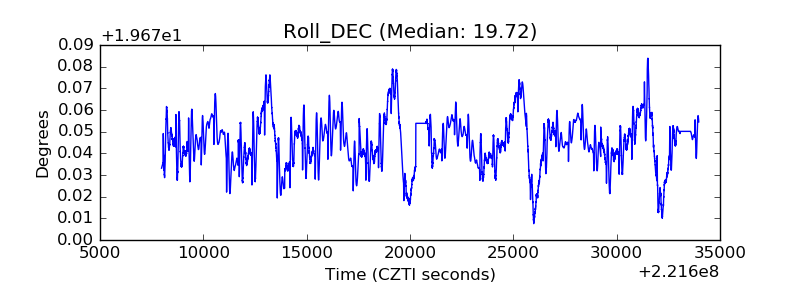 |
| _Roll_RA | 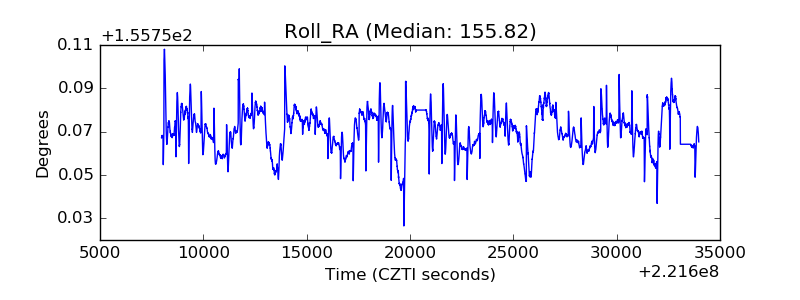 |
| Veto Counter | 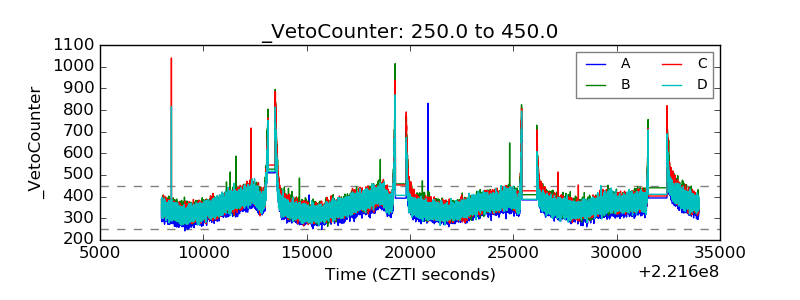 |