| Param | Original file | Final file |
|---|---|---|
| Filename | modeM0/AS1A02_103T01_9000000950_06944cztM0_level2.evt | modeM0/AS1A02_103T01_9000000950_06944cztM0_level2_quad_clean.evt |
| Size (bytes) | 832,029,120 | 73,033,920 |
| Size | 793.5 MB | 69.7 MB |
| Events in quadrant A | 2,939,030 | 518,690 |
| Events in quadrant B | 3,380,369 | 512,933 |
| Events in quadrant C | 14,863,630 | 237,809 |
| Events in quadrant D | 3,586,550 | 498,416 |
| Mode SS | |||
|---|---|---|---|
| Quadrant | BADHDUFLAG | Total packets | Discarded packets |
| A | 0 | 130 | 0 |
| B | 0 | 130 | 0 |
| C | 0 | 130 | 0 |
| D | 0 | 130 | 0 |
| Mode M9 | |||
|---|---|---|---|
| Quadrant | BADHDUFLAG | Total packets | Discarded packets |
| A | 0 | 10 | 0 |
| B | 0 | 10 | 0 |
| C | 0 | 10 | 0 |
| D | 0 | 10 | 0 |
| Mode M0 | |||
|---|---|---|---|
| Quadrant | BADHDUFLAG | Total packets | Discarded packets |
| A | 0 | 12900 | 2 |
| B | 0 | 14166 | 1 |
| C | 0 | 48481 | 1 |
| D | 0 | 14444 | 1 |
| Quadrant | Total seconds | Saturated seconds | Saturation percentage |
|---|---|---|---|
| A | 6328 | 73 | 1.153603% |
| B | 6328 | 236 | 3.729456% |
| C | 6328 | 5351 | 84.560683% |
| D | 6328 | 55 | 0.869153% |
Noise dominated data is calculated using 1-second bins in cleaned event files. If a bin has >2000 counts, and if more than 50% of those come from <1% of pixels, then it is considered to be noise-dominated and hence unusable.
| Quadrant | # 1 sec bins | Bins with >0 counts | Bins with >2000 counts | High rate bins dominated by noise | Noise dominated (total time) | Noise dominated (detector-on time) | Marked lightcurve |
|---|---|---|---|---|---|---|---|
| A | 7358 | 6329 | 0 | 0 | 0.00% | 0.00% | 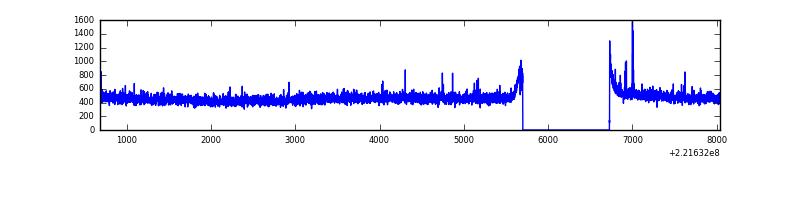 |
| B | 7358 | 6329 | 116 | 116 | 1.58% | 1.83% | 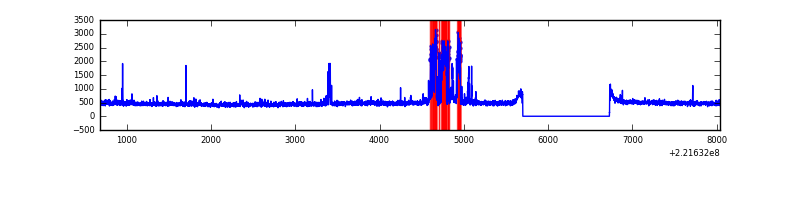 |
| C | 7358 | 6329 | 5107 | 5107 | 69.41% | 80.69% | 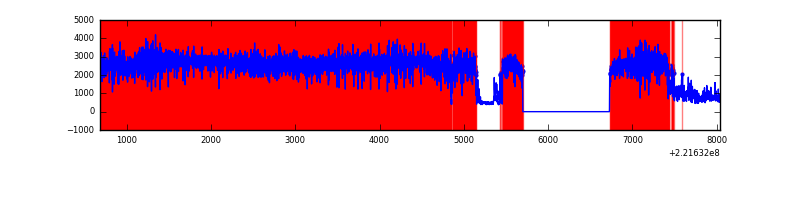 |
| D | 7358 | 6329 | 4 | 4 | 0.05% | 0.06% | 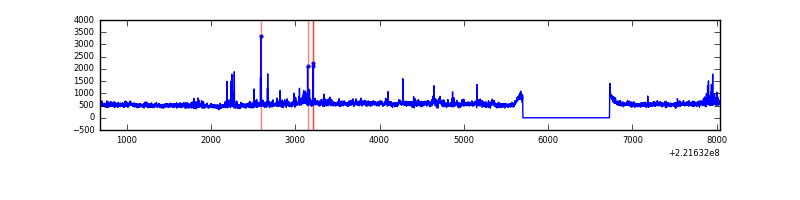 |
Top three noisy pixels from each quadrant. If the there are fewer than three noisy pixels in the level2.evt file, extra rows are filled as -1
| Pixel properties | Quadrant properties | ||||||
|---|---|---|---|---|---|---|---|
| Quadrant | DetID | PixID | Counts | Sigma | Mean | Median | Sigma |
| A | 3 | 1 | 10642 | 63.76 | 756 | 740 | 155.3 |
| A | 14 | 111 | 9265 | 54.89 | 756 | 740 | 155.3 |
| A | 0 | 226 | 7365 | 42.66 | 756 | 740 | 155.3 |
| B | 0 | 228 | 452810 | 3175.95 | 745 | 727 | 142.3 |
| B | 4 | 173 | 18354 | 123.83 | 745 | 727 | 142.3 |
| B | 12 | 111 | 14422 | 96.21 | 745 | 727 | 142.3 |
| C | 9 | 247 | 13511340 | 170998.51 | 340 | 342 | 79.0 |
| C | 7 | 247 | 14766 | 182.55 | 340 | 342 | 79.0 |
| C | 8 | 128 | 3485 | 39.78 | 340 | 342 | 79.0 |
| D | 8 | 195 | 663438 | 3694.93 | 732 | 707 | 179.4 |
| D | 2 | 152 | 79167 | 437.44 | 732 | 707 | 179.4 |
| D | 12 | 233 | 34701 | 189.53 | 732 | 707 | 179.4 |
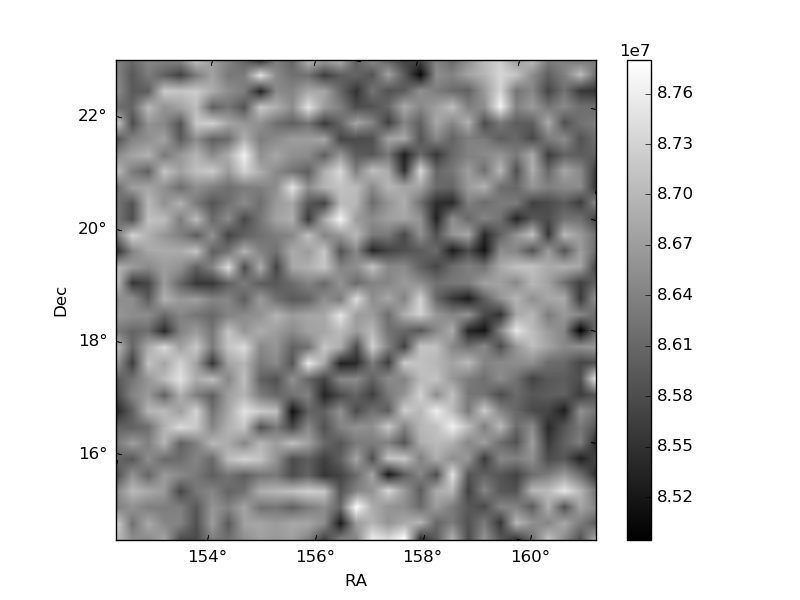
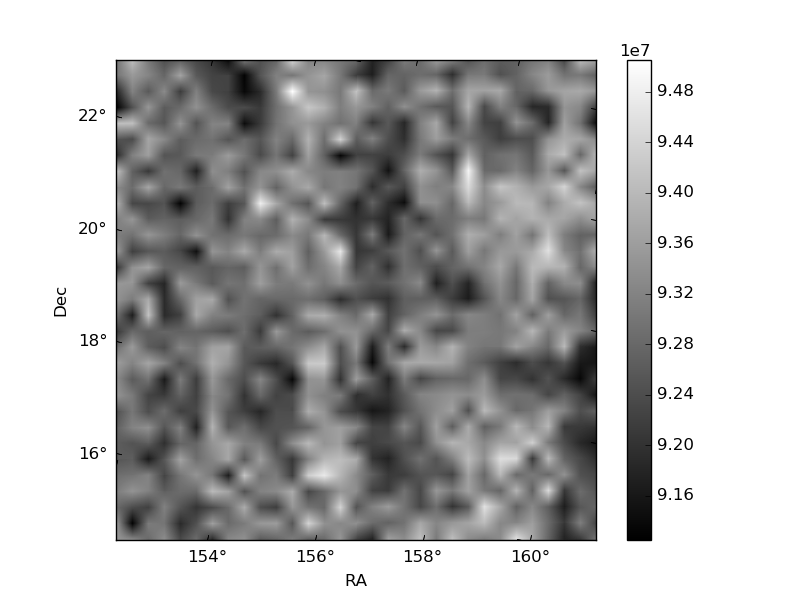
Histogram calculated using DETX and DETY for each event in the final _common_clean file
| Quadrant A | 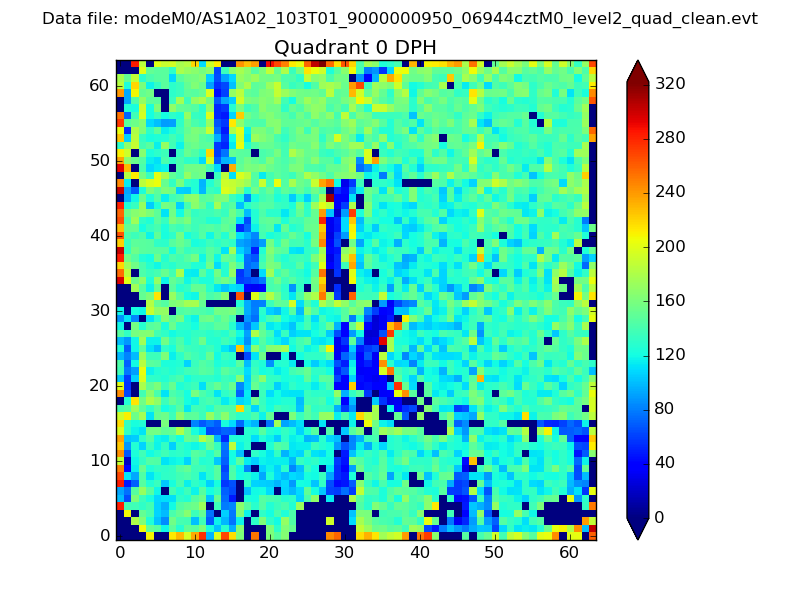 |
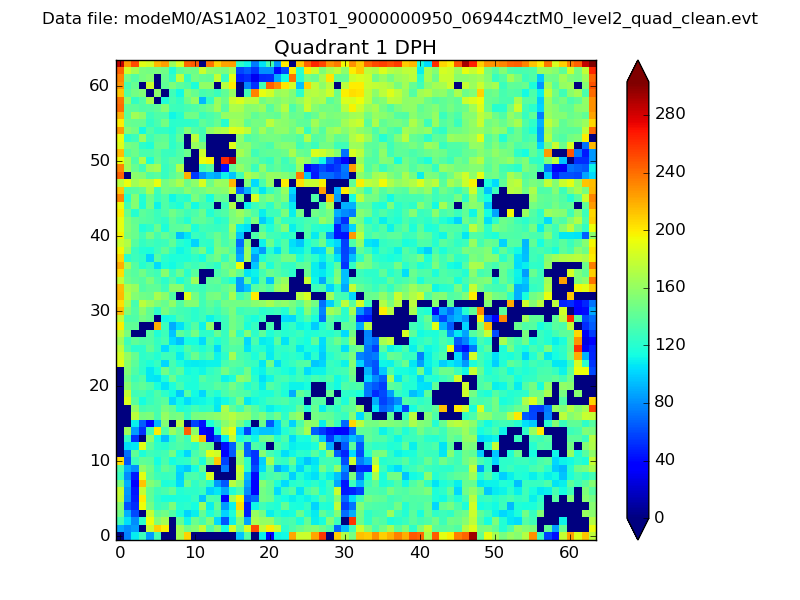 |
Quadrant B |
|---|---|---|---|
| Quadrant D | 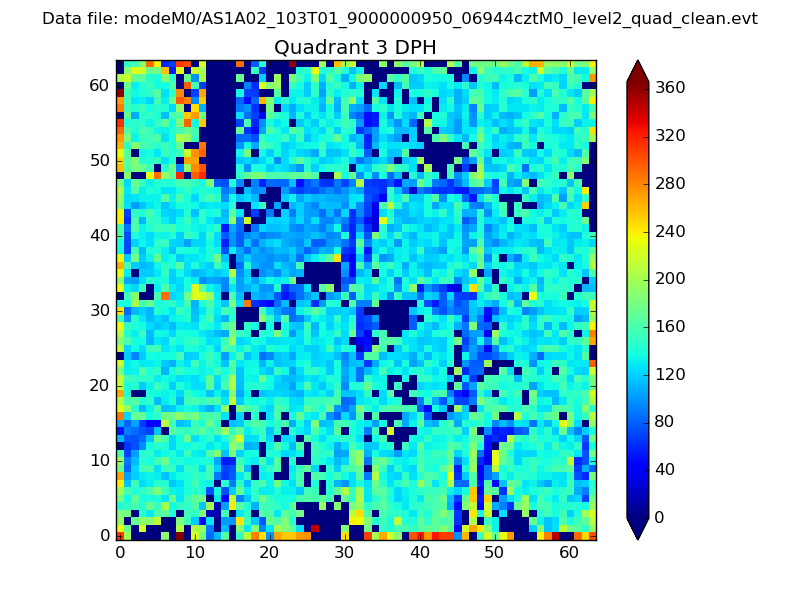 |
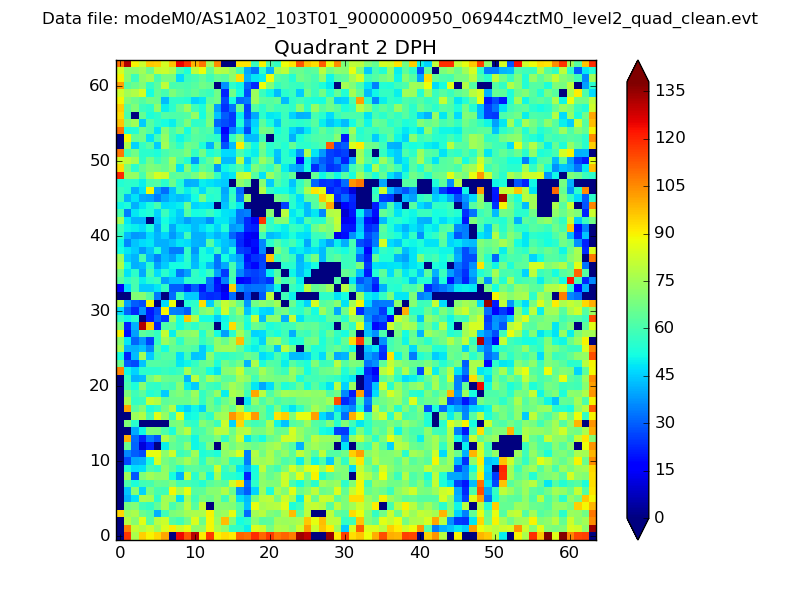 |
Quadrant C |
| Plot type | Count rate plots | Images |
|---|---|---|
| Comparison with Poisson distribution Blue bars denote a histogram of data divided into 1 sec bins. Red curve is a Poisson curve with rate = median count rate of data. |
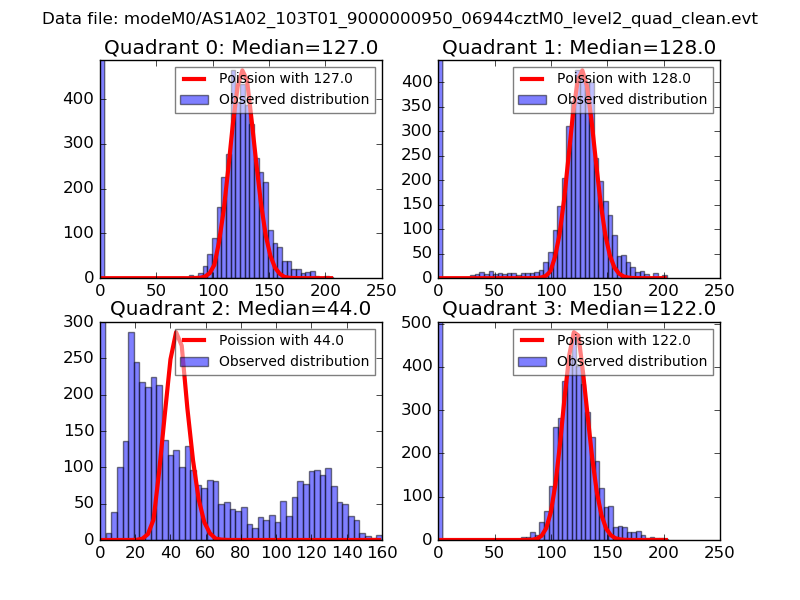 |
 |
| Quadrant-wise count rates Data is divided into 100 sec bins |
 |
|
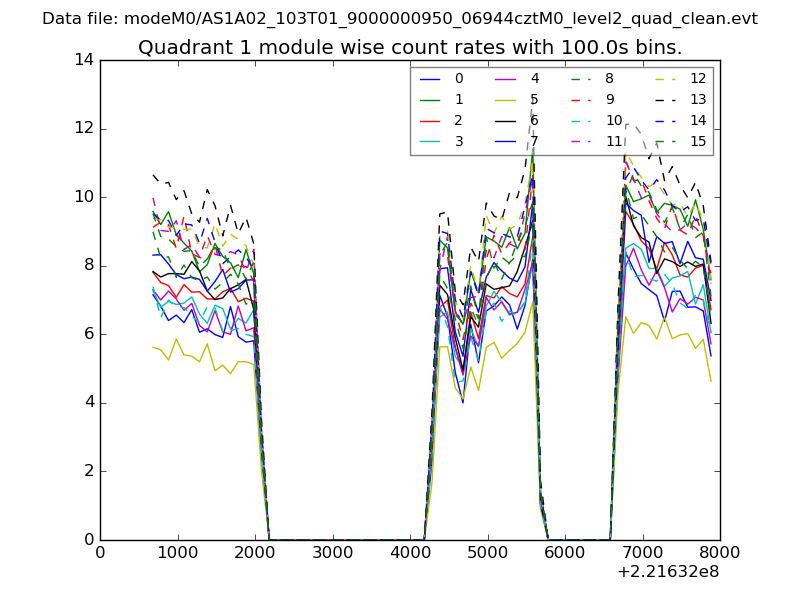
| Module-wise count rates for Quadrant A Data is divided into 100 sec bins |
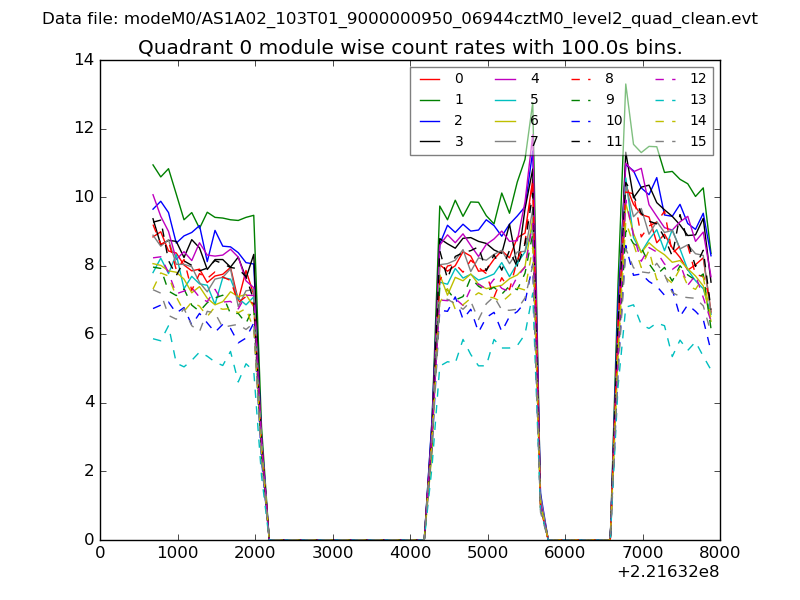 |
 |
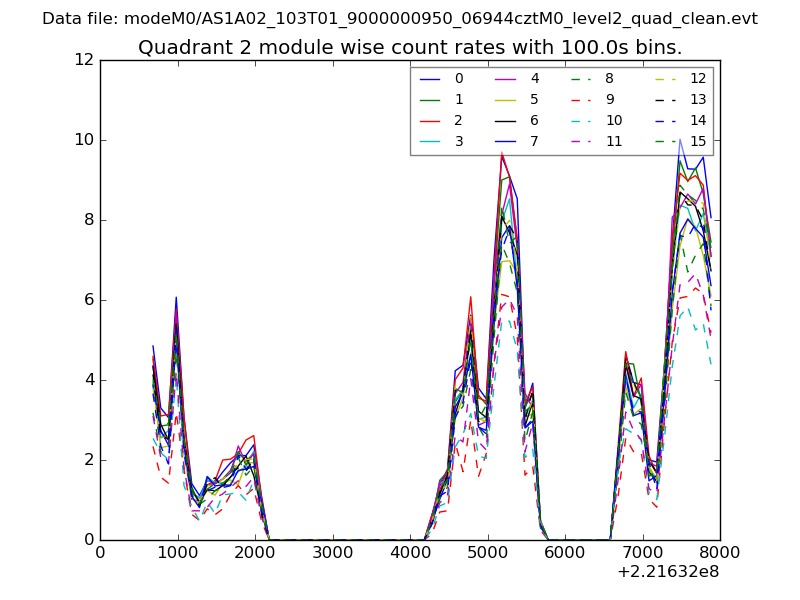
| Module-wise count rates for Quadrant B Data is divided into 100 sec bins |
 |
 |
| Module-wise count rates for Quadrant C Data is divided into 100 sec bins |
 |
 |
| Module-wise count rates for Quadrant D Data is divided into 100 sec bins |
 |
 |
| Parameter | Plot |
|---|---|
| CZT HV Monitor | 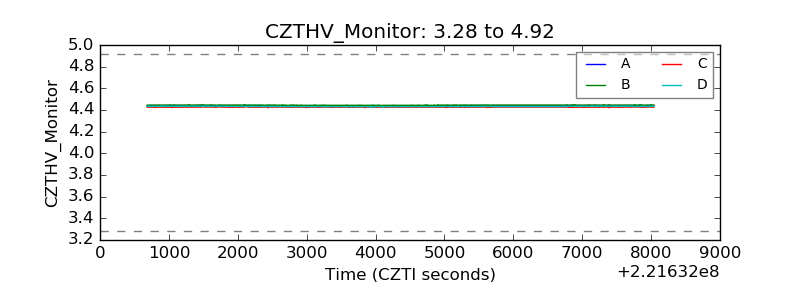 |
| D_VDD | 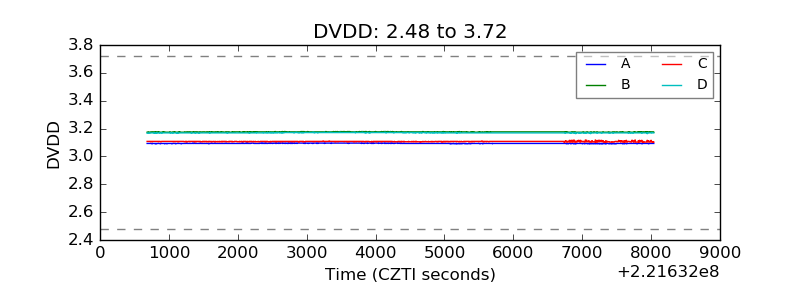 |
| Temperature 1 | 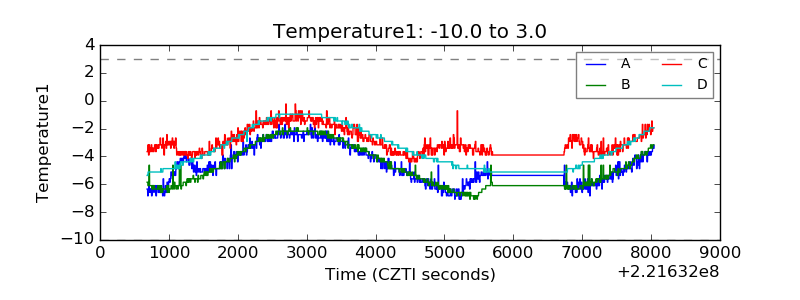 |
| Veto HV Monitor | 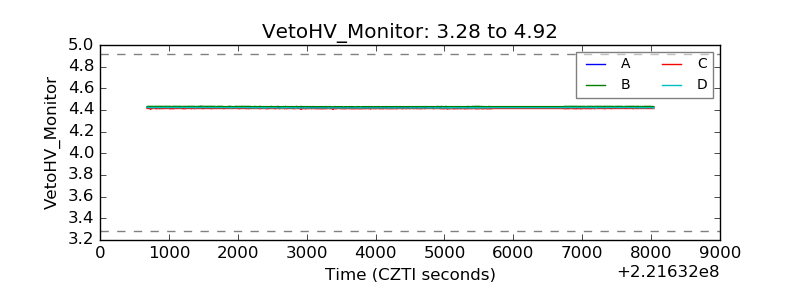 |
| Veto LLD | 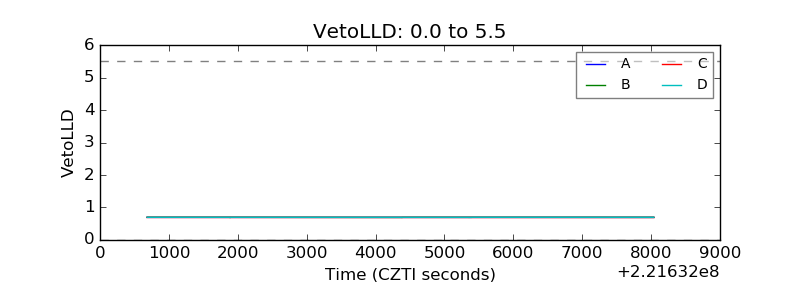 |
| Alpha Counter | 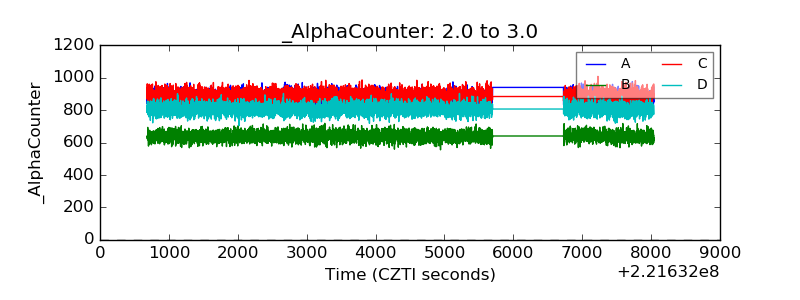 |
| _CPM_Rate | 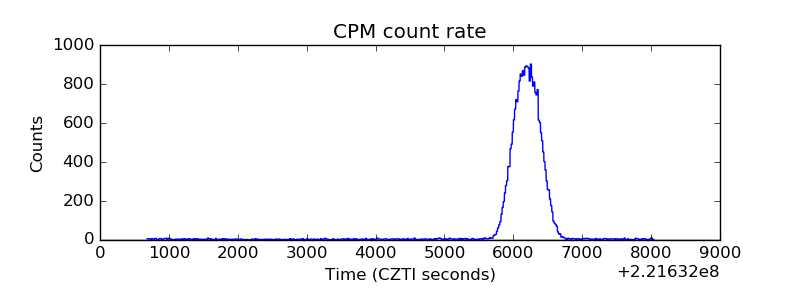 |
| CZT Counter | 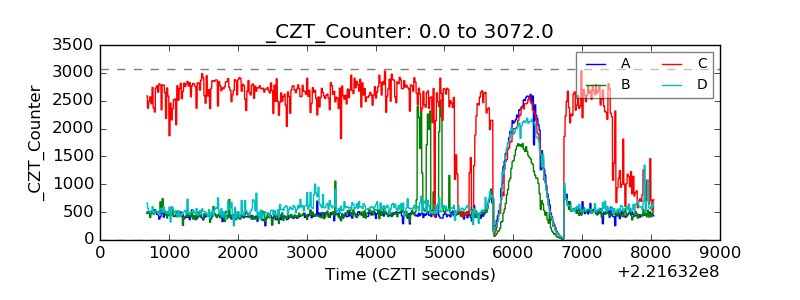 |
| +2.5 Volts monitor |  |
| +5 Volts monitor |  |
| _ROLL_ROT | 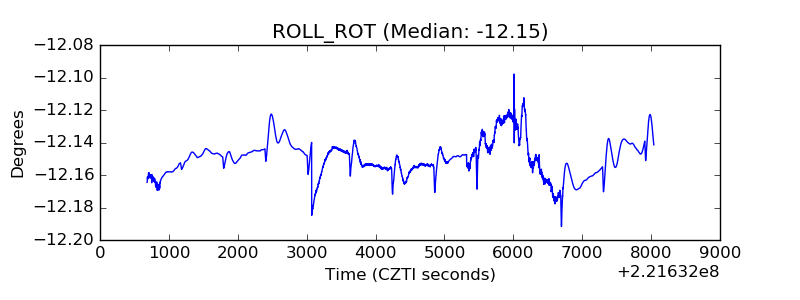 |
| _Roll_DEC | 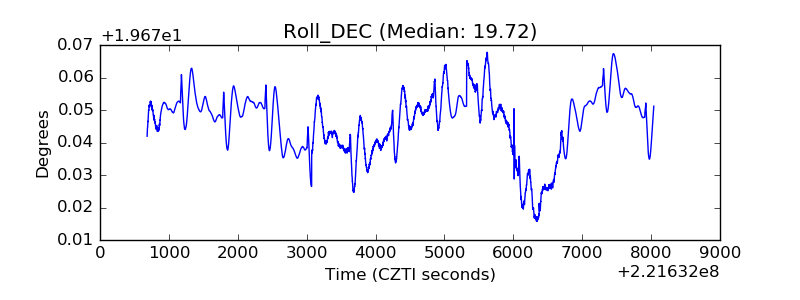 |
| _Roll_RA | 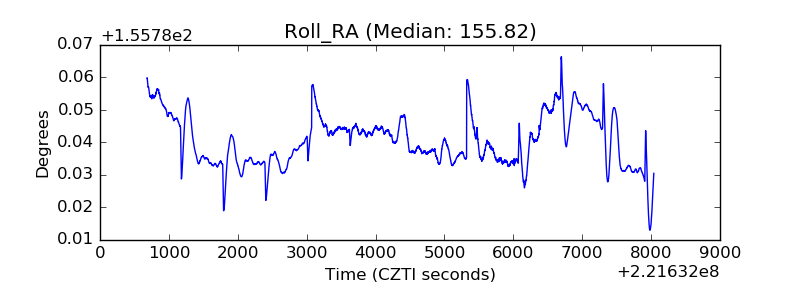 |
| Veto Counter | 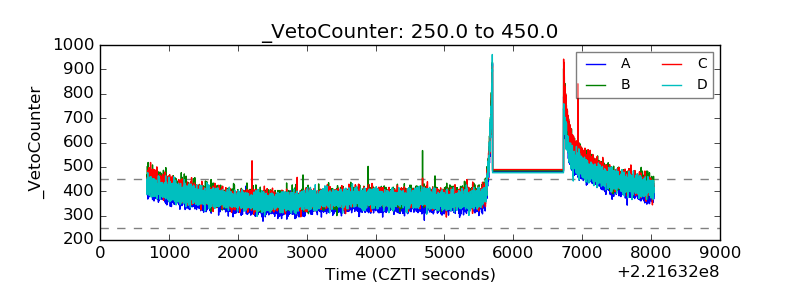 |