| Param | Original file | Final file |
|---|---|---|
| Filename | modeM0/AS1A02_103T01_9000000950_06946cztM0_level2.evt | modeM0/AS1A02_103T01_9000000950_06946cztM0_level2_quad_clean.evt |
| Size (bytes) | 683,619,840 | 73,200,960 |
| Size | 652.0 MB | 69.8 MB |
| Events in quadrant A | 3,334,968 | 455,077 |
| Events in quadrant B | 3,766,716 | 456,134 |
| Events in quadrant C | 9,079,133 | 410,506 |
| Events in quadrant D | 4,075,957 | 433,862 |
| Mode SS | |||
|---|---|---|---|
| Quadrant | BADHDUFLAG | Total packets | Discarded packets |
| A | 0 | 134 | 0 |
| B | 0 | 134 | 0 |
| C | 0 | 134 | 0 |
| D | 0 | 134 | 0 |
| Mode M9 | |||
|---|---|---|---|
| Quadrant | BADHDUFLAG | Total packets | Discarded packets |
| A | 0 | 15 | 0 |
| B | 0 | 15 | 0 |
| C | 0 | 15 | 0 |
| D | 0 | 16 | 0 |
| Mode M0 | |||
|---|---|---|---|
| Quadrant | BADHDUFLAG | Total packets | Discarded packets |
| A | 0 | 13938 | 3 |
| B | 0 | 15190 | 2 |
| C | 0 | 31609 | 2 |
| D | 0 | 16619 | 2 |
| Quadrant | Total seconds | Saturated seconds | Saturation percentage |
|---|---|---|---|
| A | 6604 | 86 | 1.302241% |
| B | 6604 | 179 | 2.710478% |
| C | 6604 | 2096 | 31.738340% |
| D | 6604 | 103 | 1.559661% |
Noise dominated data is calculated using 1-second bins in cleaned event files. If a bin has >2000 counts, and if more than 50% of those come from <1% of pixels, then it is considered to be noise-dominated and hence unusable.
| Quadrant | # 1 sec bins | Bins with >0 counts | Bins with >2000 counts | High rate bins dominated by noise | Noise dominated (total time) | Noise dominated (detector-on time) | Marked lightcurve |
|---|---|---|---|---|---|---|---|
| A | 7849 | 6605 | 0 | 0 | 0.00% | 0.00% | 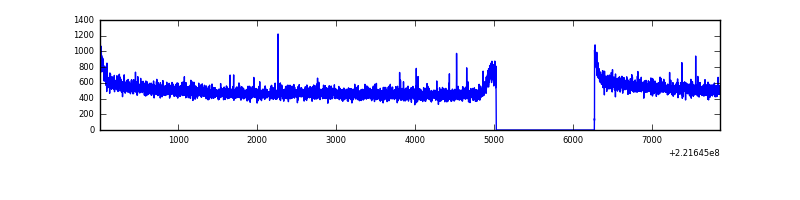 |
| B | 7849 | 6605 | 52 | 52 | 0.66% | 0.79% | 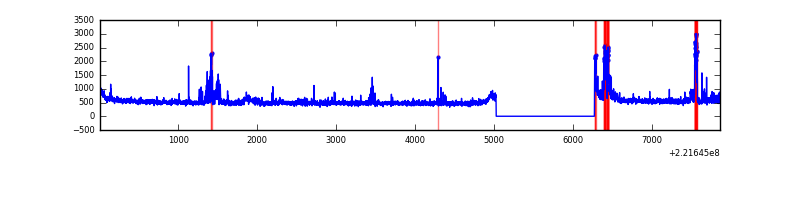 |
| C | 7849 | 6605 | 1478 | 1478 | 18.83% | 22.38% | 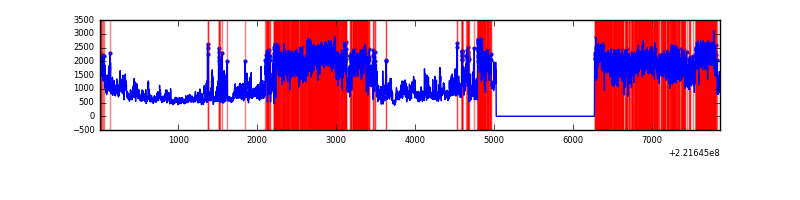 |
| D | 7849 | 6605 | 23 | 23 | 0.29% | 0.35% | 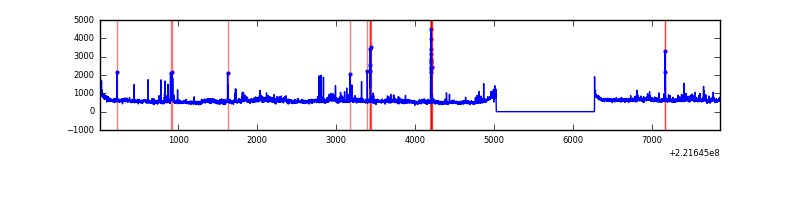 |
Top three noisy pixels from each quadrant. If the there are fewer than three noisy pixels in the level2.evt file, extra rows are filled as -1
| Pixel properties | Quadrant properties | ||||||
|---|---|---|---|---|---|---|---|
| Quadrant | DetID | PixID | Counts | Sigma | Mean | Median | Sigma |
| A | 14 | 111 | 8687 | 45.01 | 862 | 846 | 174.2 |
| A | 0 | 226 | 8391 | 43.31 | 862 | 846 | 174.2 |
| A | 12 | 194 | 8005 | 41.09 | 862 | 846 | 174.2 |
| B | 0 | 228 | 226103 | 1405.59 | 852 | 835 | 160.3 |
| B | 3 | 220 | 144790 | 898.22 | 852 | 835 | 160.3 |
| B | 0 | 219 | 57568 | 353.99 | 852 | 835 | 160.3 |
| C | 9 | 247 | 5985752 | 34723.83 | 756 | 763 | 172.4 |
| C | 7 | 247 | 134155 | 773.92 | 756 | 763 | 172.4 |
| C | 12 | 4 | 7182 | 37.24 | 756 | 763 | 172.4 |
| D | 8 | 195 | 575115 | 2827.2 | 837 | 812 | 203.1 |
| D | 2 | 152 | 120053 | 587.0 | 837 | 812 | 203.1 |
| D | 7 | 55 | 61249 | 297.52 | 837 | 812 | 203.1 |
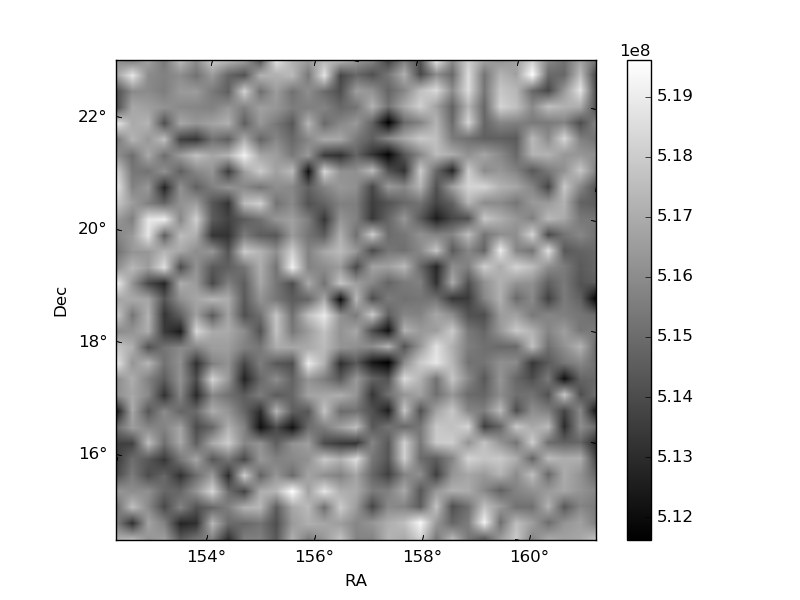
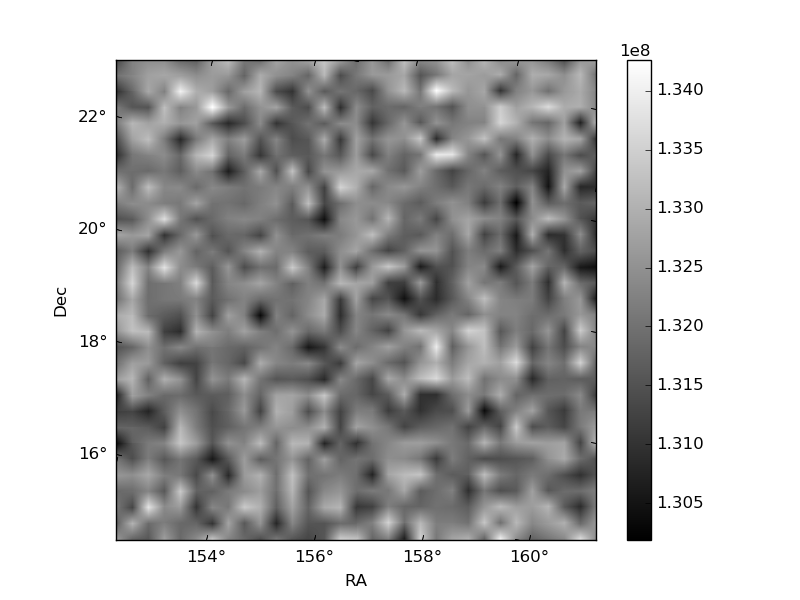
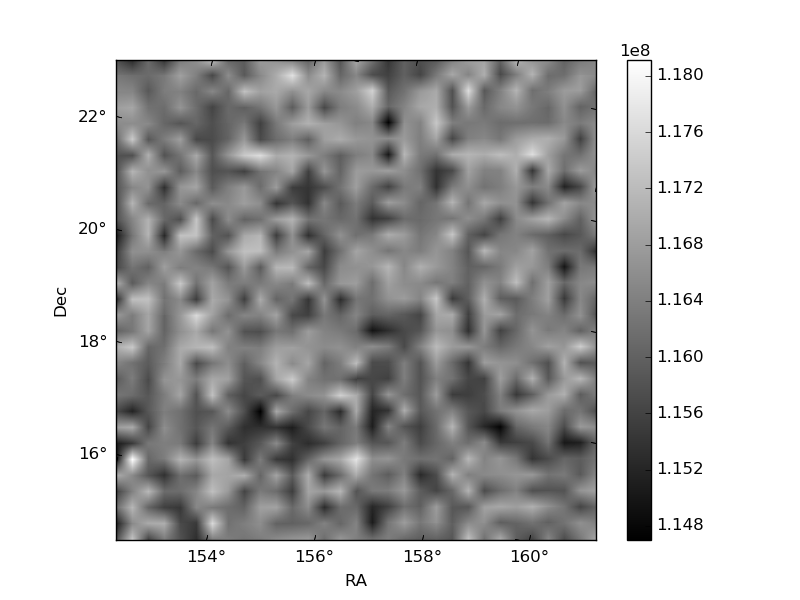
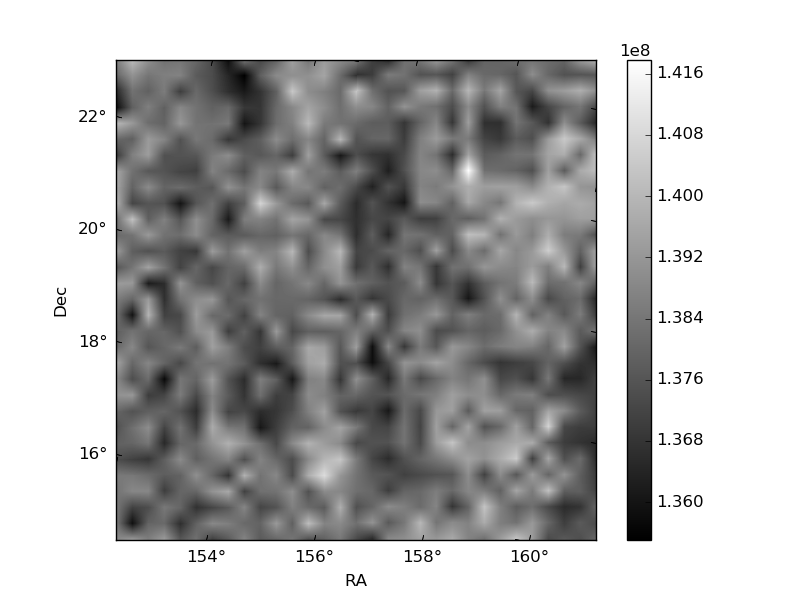
Histogram calculated using DETX and DETY for each event in the final _common_clean file
| Quadrant A | 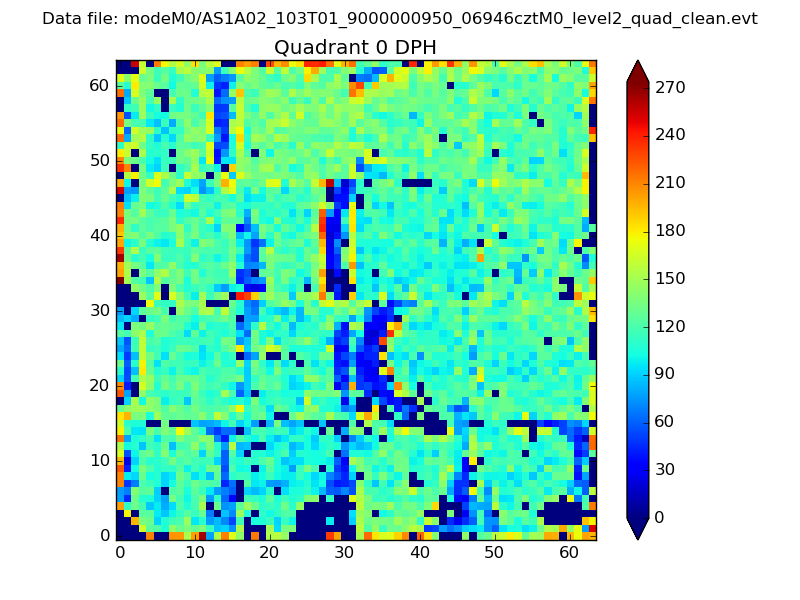 |
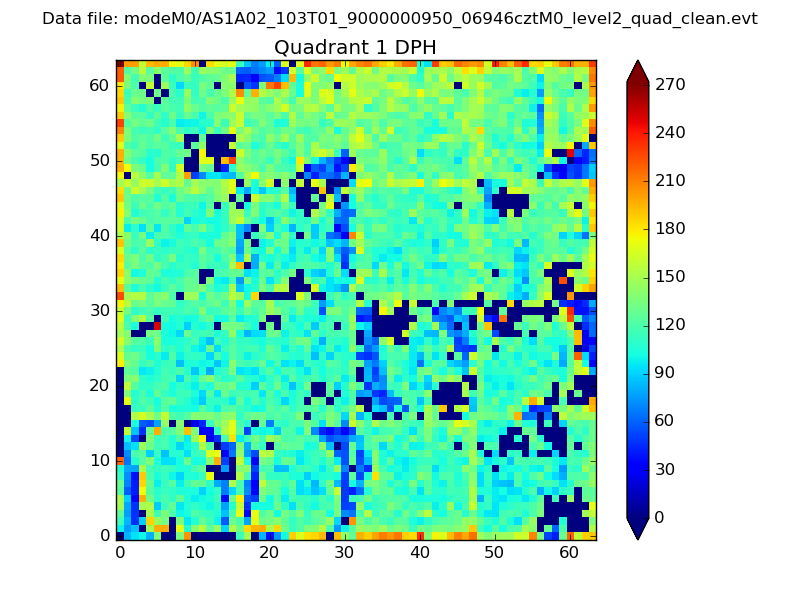 |
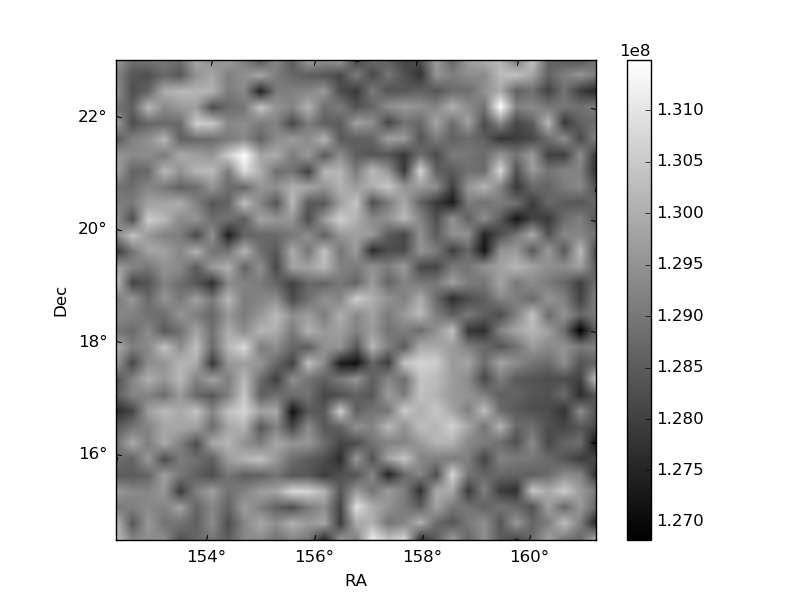
Quadrant B |
|---|---|---|---|
| Quadrant D | 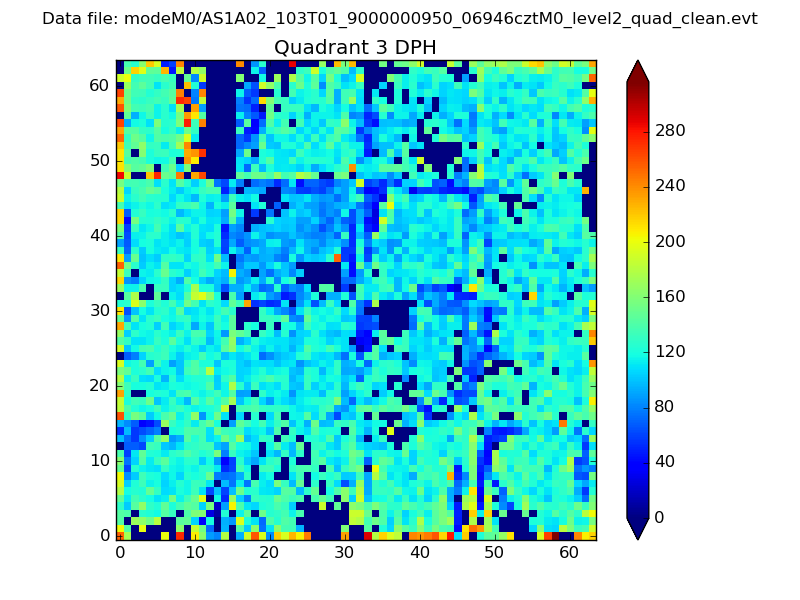 |
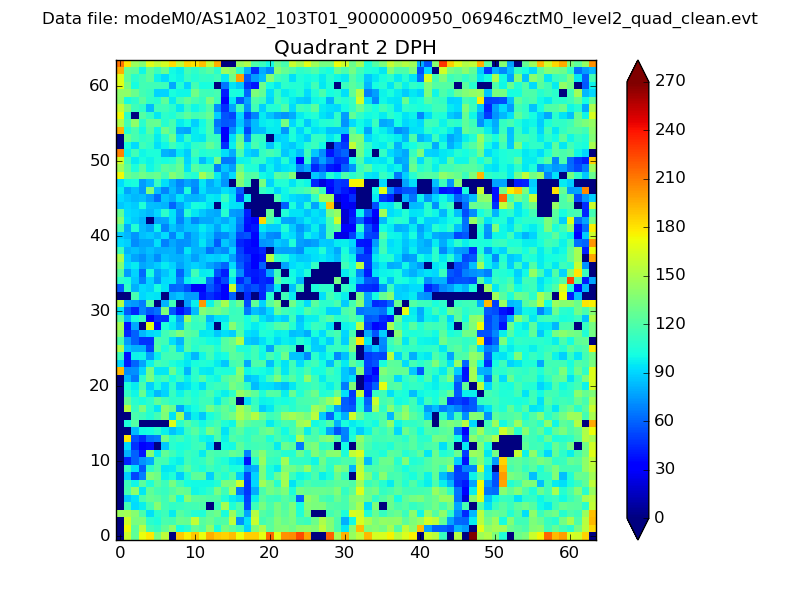 |
Quadrant C |
| Plot type | Count rate plots | Images |
|---|---|---|
| Comparison with Poisson distribution Blue bars denote a histogram of data divided into 1 sec bins. Red curve is a Poisson curve with rate = median count rate of data. |
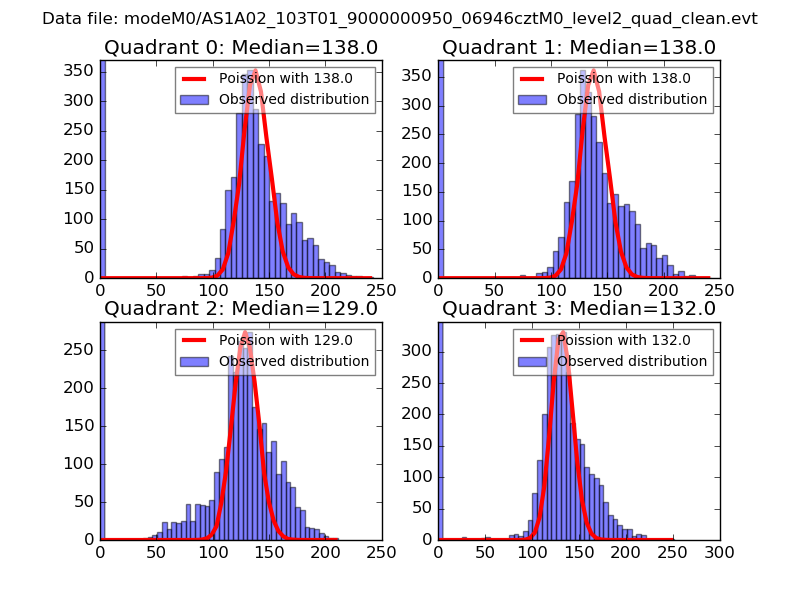 |
 |
| Quadrant-wise count rates Data is divided into 100 sec bins |
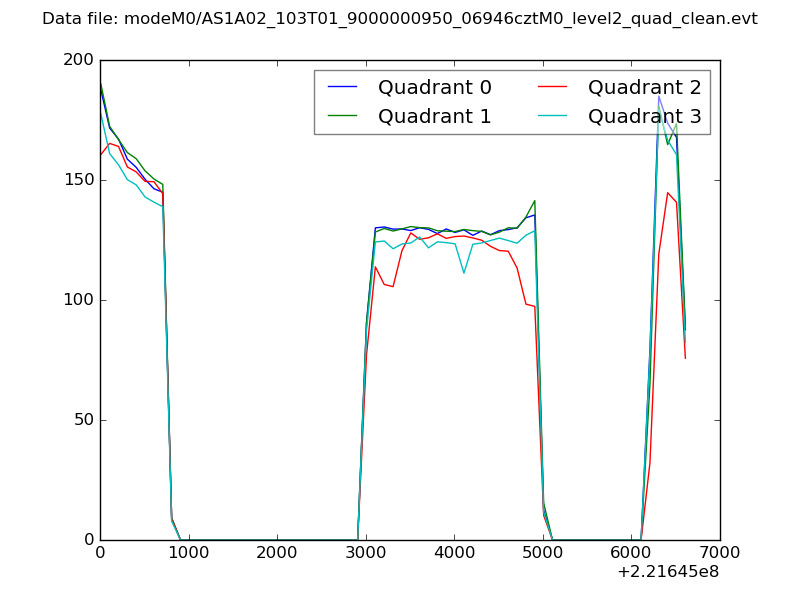 |
|
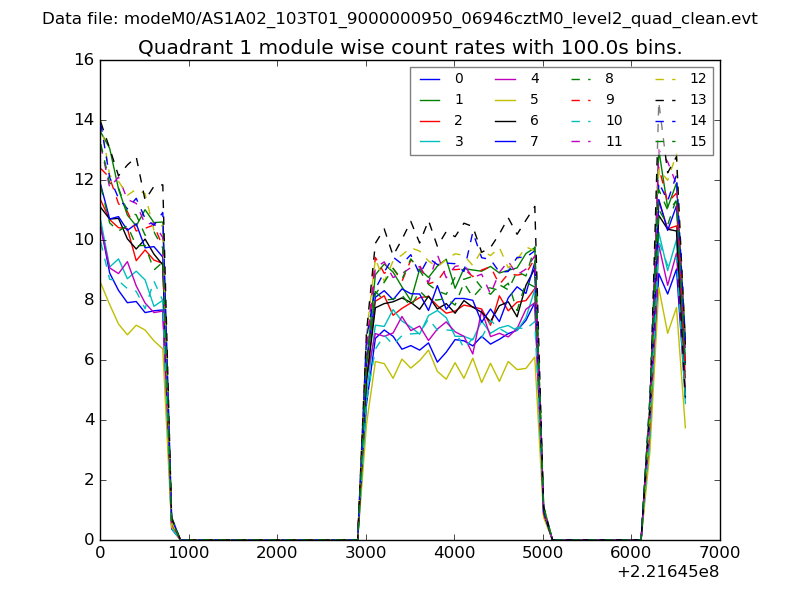
| Module-wise count rates for Quadrant A Data is divided into 100 sec bins |
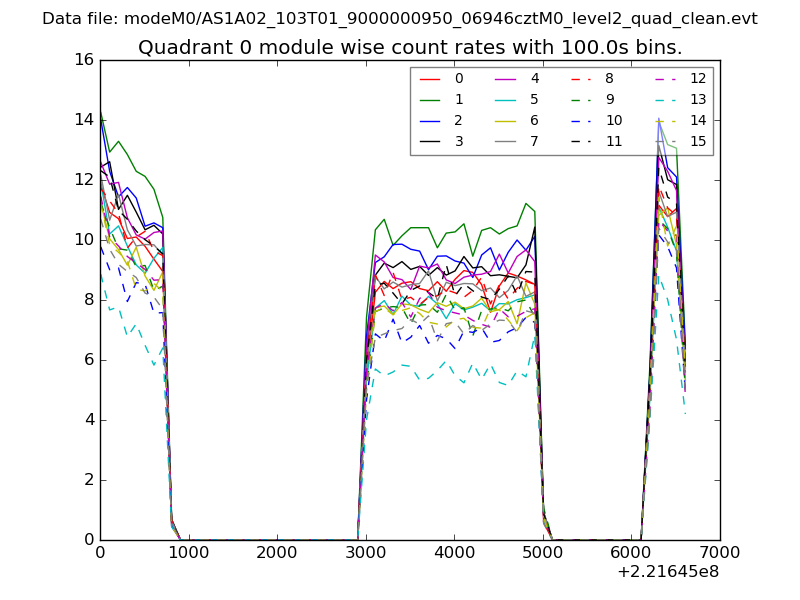 |
 |
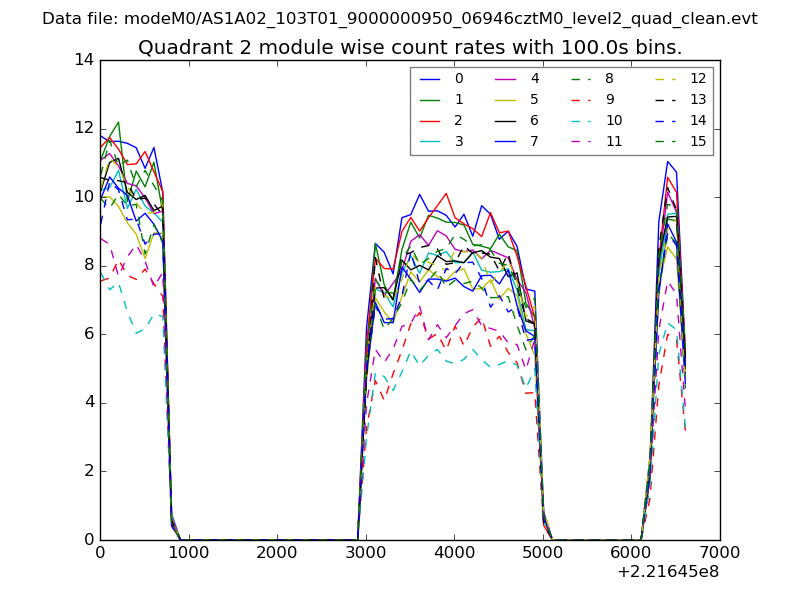
| Module-wise count rates for Quadrant B Data is divided into 100 sec bins |
 |
 |
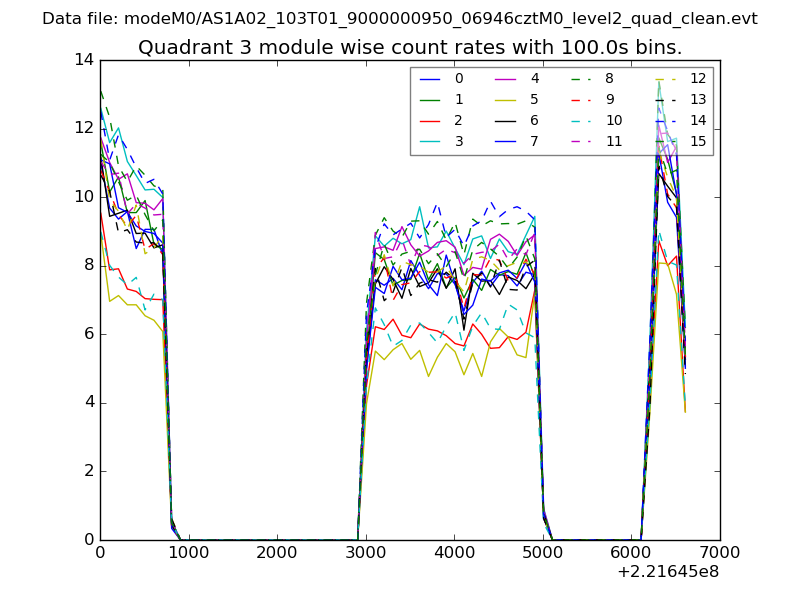
| Module-wise count rates for Quadrant C Data is divided into 100 sec bins |
 |
 |
| Module-wise count rates for Quadrant D Data is divided into 100 sec bins |
 |
 |
| Parameter | Plot |
|---|---|
| CZT HV Monitor | 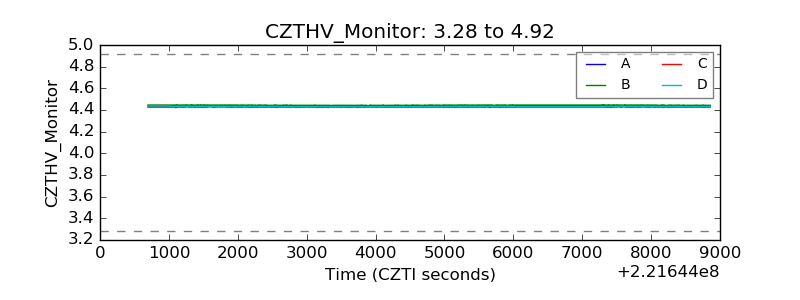 |
| D_VDD | 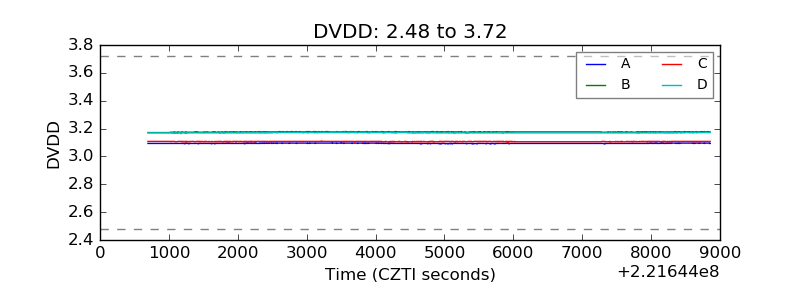 |
| Temperature 1 | 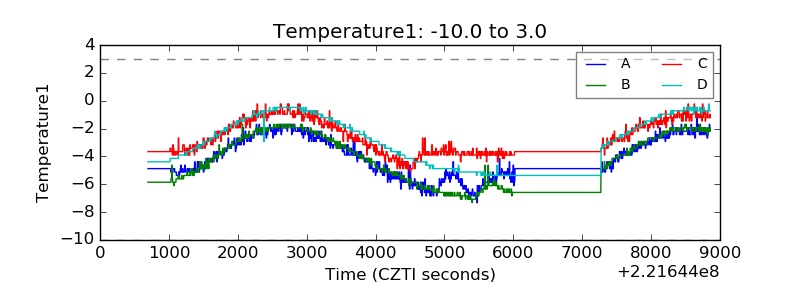 |
| Veto HV Monitor | 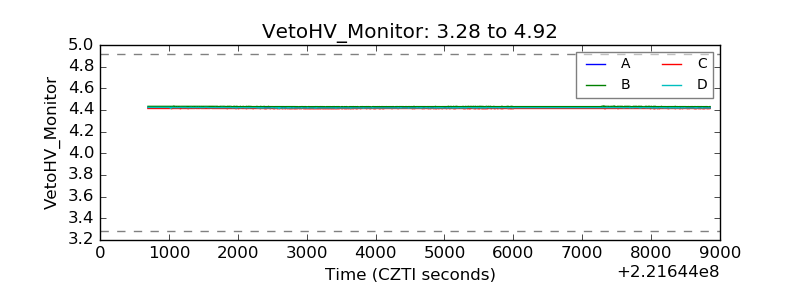 |
| Veto LLD | 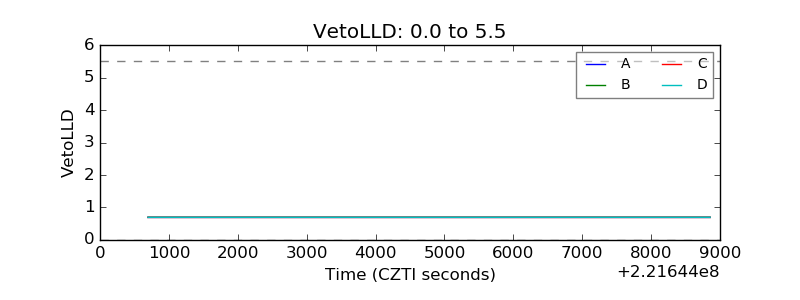 |
| Alpha Counter | 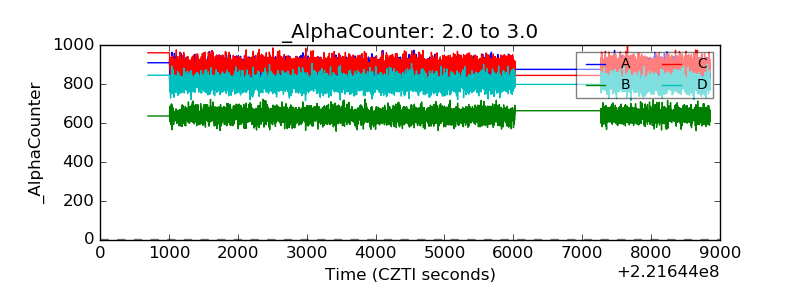 |
| _CPM_Rate | 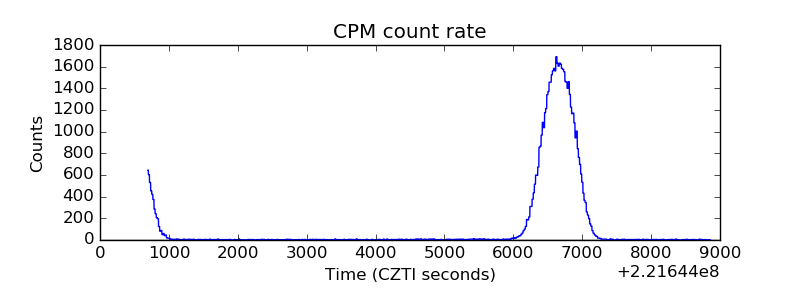 |
| CZT Counter | 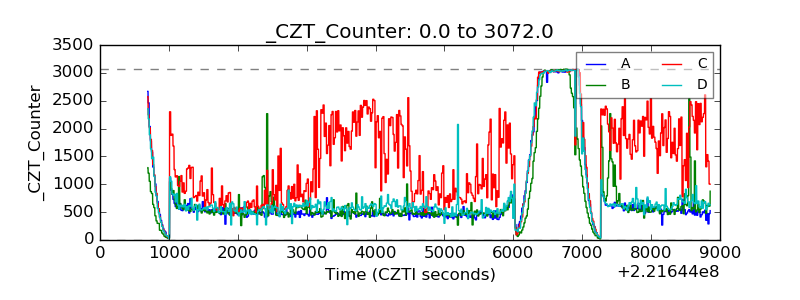 |
| +2.5 Volts monitor | 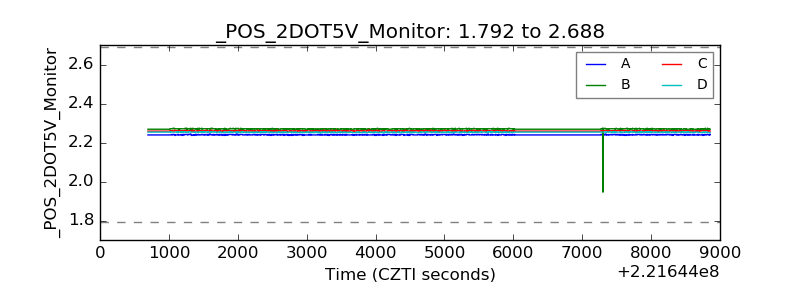 |
| +5 Volts monitor |  |
| _ROLL_ROT | 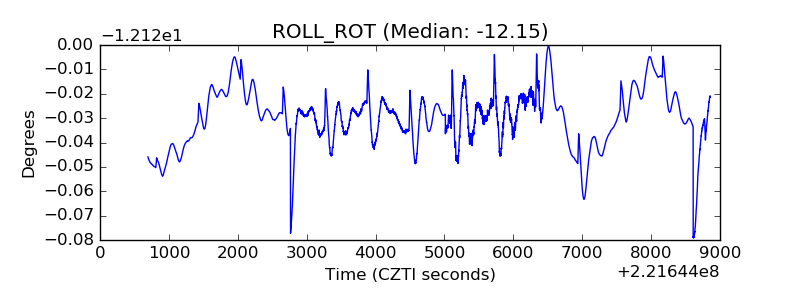 |
| _Roll_DEC | 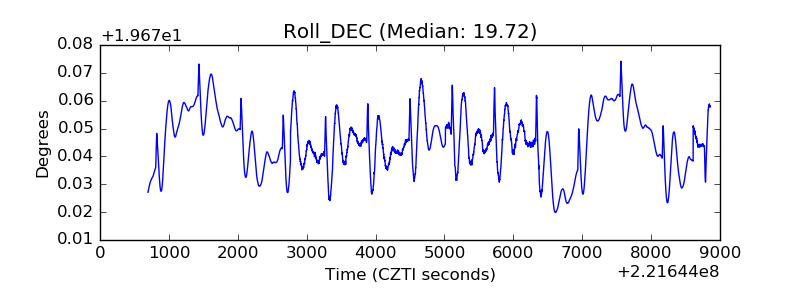 |
| _Roll_RA | 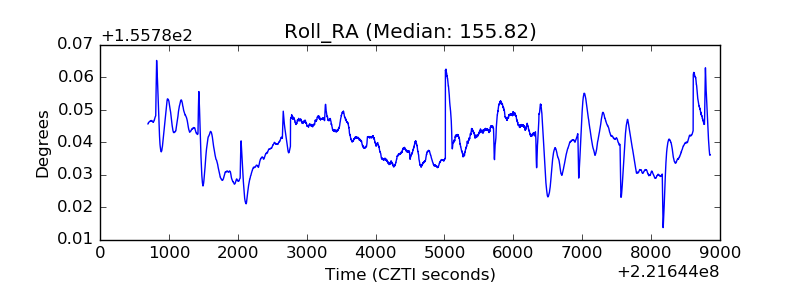 |
| Veto Counter | 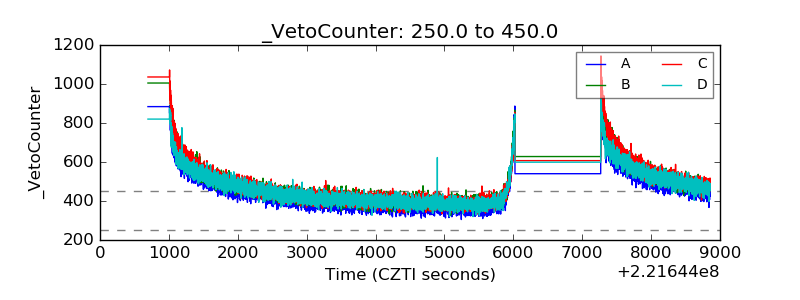 |