| Param | Original file | Final file |
|---|---|---|
| Filename | modeM0/AS1A02_103T01_9000000950_06947cztM0_level2.evt | modeM0/AS1A02_103T01_9000000950_06947cztM0_level2_quad_clean.evt |
| Size (bytes) | 633,127,680 | 57,303,360 |
| Size | 603.8 MB | 54.6 MB |
| Events in quadrant A | 3,165,103 | 333,155 |
| Events in quadrant B | 3,574,686 | 334,825 |
| Events in quadrant C | 7,966,094 | 320,116 |
| Events in quadrant D | 4,045,993 | 310,819 |
| Mode SS | |||
|---|---|---|---|
| Quadrant | BADHDUFLAG | Total packets | Discarded packets |
| A | 0 | 126 | 0 |
| B | 0 | 126 | 0 |
| C | 0 | 126 | 0 |
| D | 0 | 126 | 0 |
| Mode M9 | |||
|---|---|---|---|
| Quadrant | BADHDUFLAG | Total packets | Discarded packets |
| A | 0 | 13 | 0 |
| B | 0 | 13 | 0 |
| C | 0 | 13 | 0 |
| D | 0 | 13 | 0 |
| Mode M0 | |||
|---|---|---|---|
| Quadrant | BADHDUFLAG | Total packets | Discarded packets |
| A | 0 | 13128 | 2 |
| B | 0 | 14516 | 1 |
| C | 0 | 28102 | 1 |
| D | 0 | 16439 | 1 |
| Quadrant | Total seconds | Saturated seconds | Saturation percentage |
|---|---|---|---|
| A | 6245 | 87 | 1.393114% |
| B | 6245 | 124 | 1.985588% |
| C | 6245 | 1681 | 26.917534% |
| D | 6245 | 208 | 3.330665% |
Noise dominated data is calculated using 1-second bins in cleaned event files. If a bin has >2000 counts, and if more than 50% of those come from <1% of pixels, then it is considered to be noise-dominated and hence unusable.
| Quadrant | # 1 sec bins | Bins with >0 counts | Bins with >2000 counts | High rate bins dominated by noise | Noise dominated (total time) | Noise dominated (detector-on time) | Marked lightcurve |
|---|---|---|---|---|---|---|---|
| A | 7550 | 6246 | 0 | 0 | 0.00% | 0.00% | 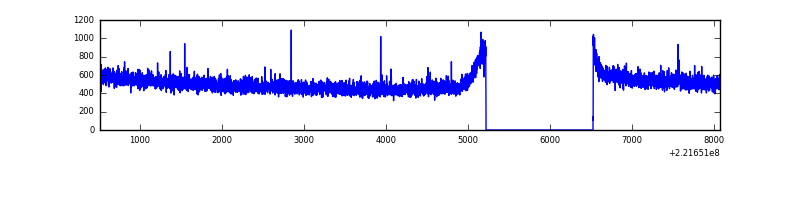 |
| B | 7550 | 6246 | 27 | 27 | 0.36% | 0.43% | 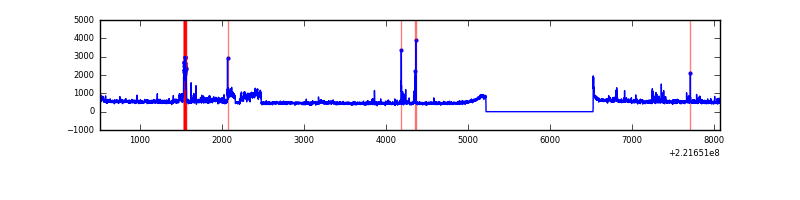 |
| C | 7550 | 6246 | 1138 | 1138 | 15.07% | 18.22% | 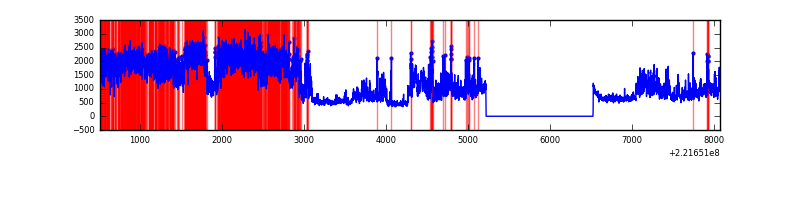 |
| D | 7550 | 6246 | 103 | 103 | 1.36% | 1.65% | 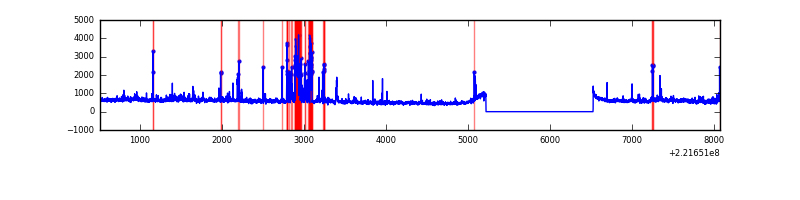 |
Top three noisy pixels from each quadrant. If the there are fewer than three noisy pixels in the level2.evt file, extra rows are filled as -1
| Pixel properties | Quadrant properties | ||||||
|---|---|---|---|---|---|---|---|
| Quadrant | DetID | PixID | Counts | Sigma | Mean | Median | Sigma |
| A | 13 | 251 | 7831 | 42.51 | 817 | 802 | 165.3 |
| A | 0 | 226 | 7782 | 42.21 | 817 | 802 | 165.3 |
| A | 12 | 194 | 7766 | 42.11 | 817 | 802 | 165.3 |
| B | 0 | 228 | 301511 | 1978.55 | 810 | 794 | 152.0 |
| B | 0 | 219 | 70563 | 459.04 | 810 | 794 | 152.0 |
| B | 4 | 81 | 35961 | 231.38 | 810 | 794 | 152.0 |
| C | 9 | 247 | 5075242 | 29857.18 | 738 | 743 | 170.0 |
| C | 7 | 220 | 7426 | 39.32 | 738 | 743 | 170.0 |
| C | 13 | 61 | 5695 | 29.14 | 738 | 743 | 170.0 |
| D | 8 | 195 | 478213 | 2481.82 | 790 | 766 | 192.4 |
| D | 2 | 33 | 306246 | 1587.92 | 790 | 766 | 192.4 |
| D | 2 | 152 | 129719 | 670.31 | 790 | 766 | 192.4 |
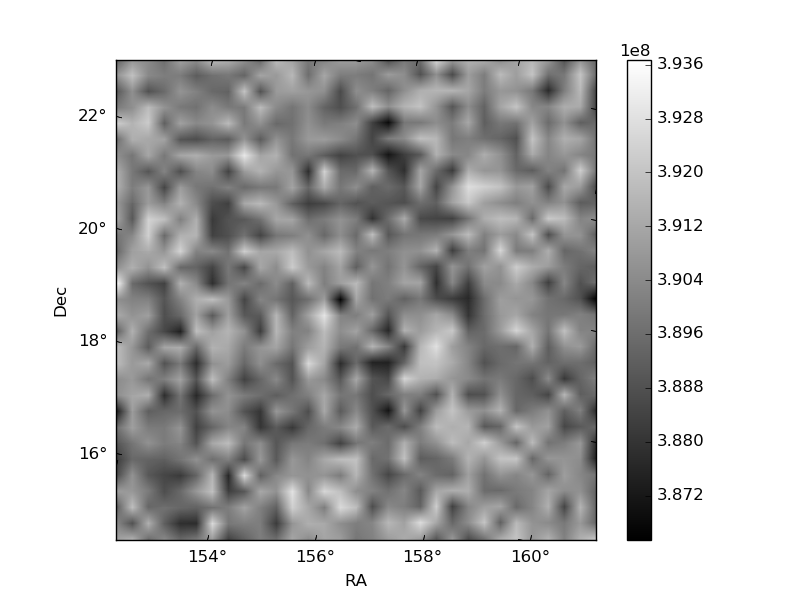
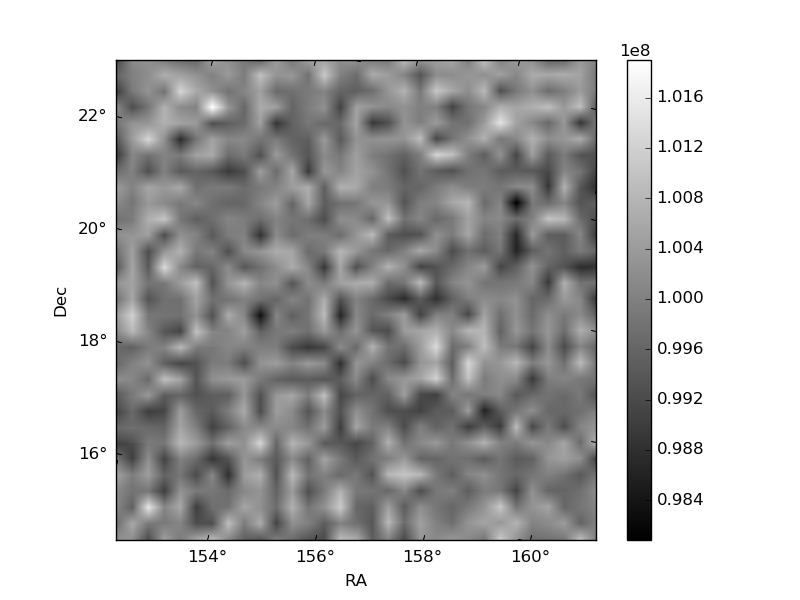
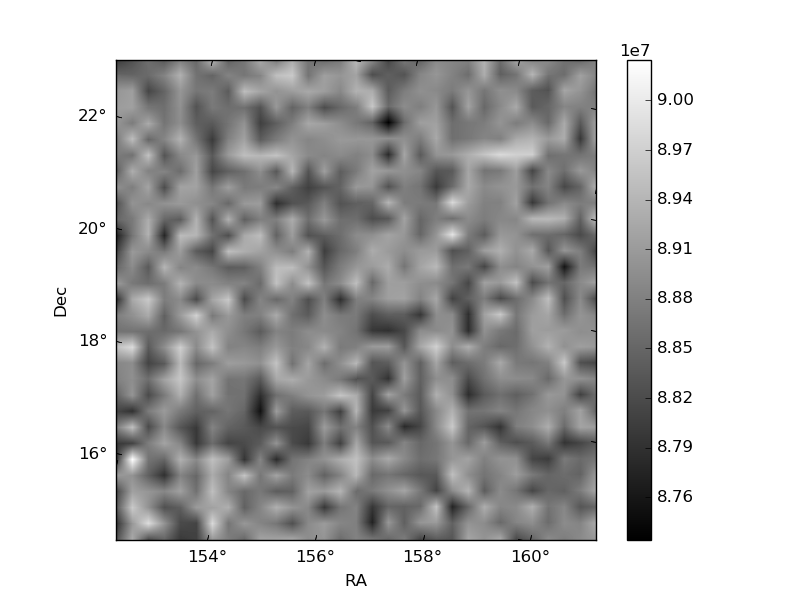
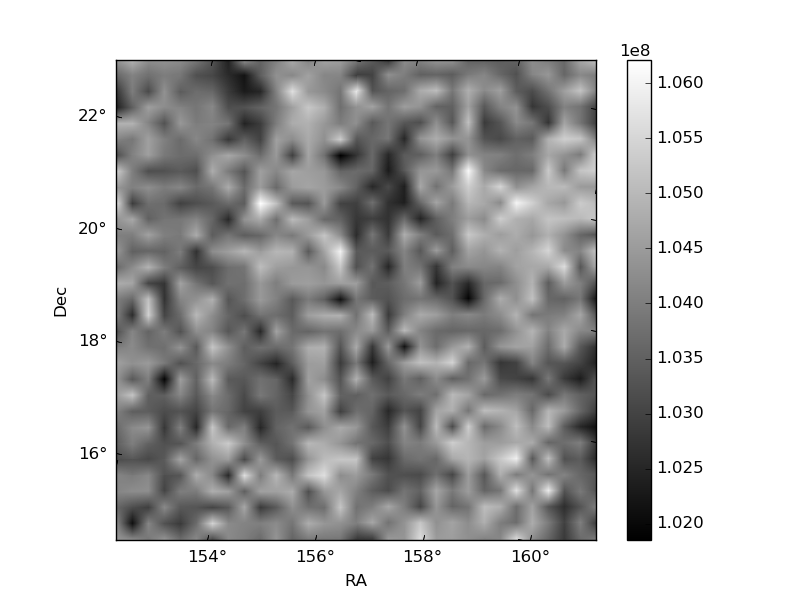
Histogram calculated using DETX and DETY for each event in the final _common_clean file
| Quadrant A | 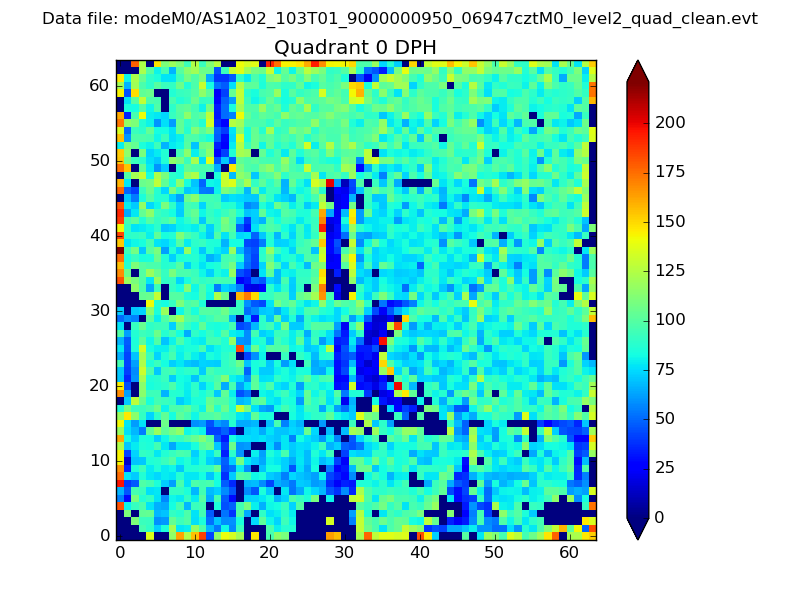 |
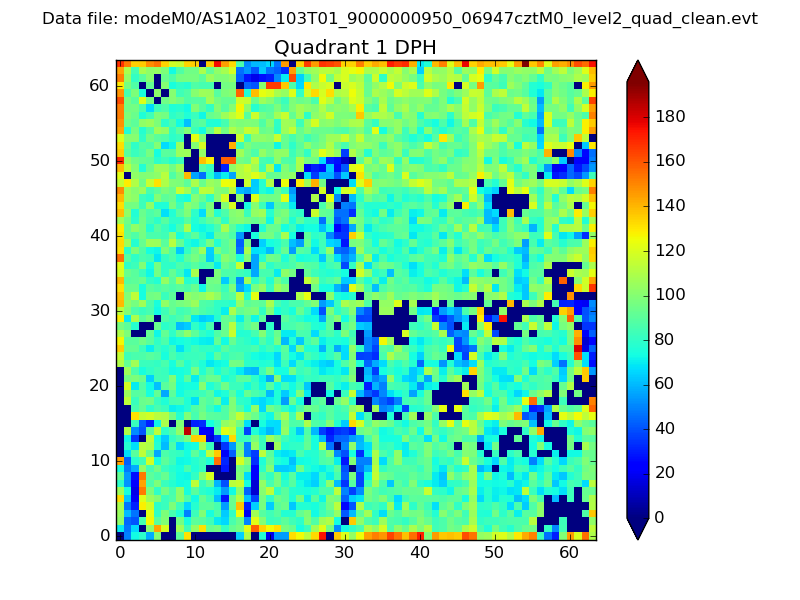 |
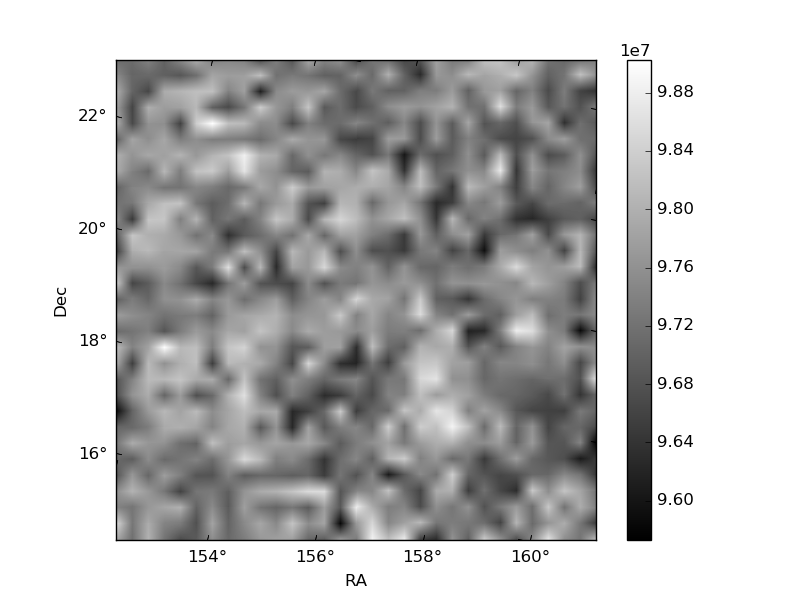
Quadrant B |
|---|---|---|---|
| Quadrant D | 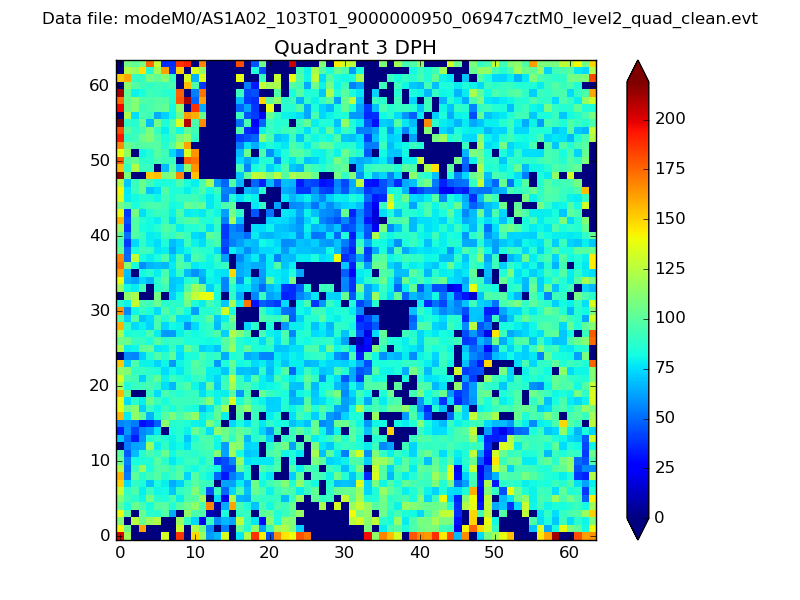 |
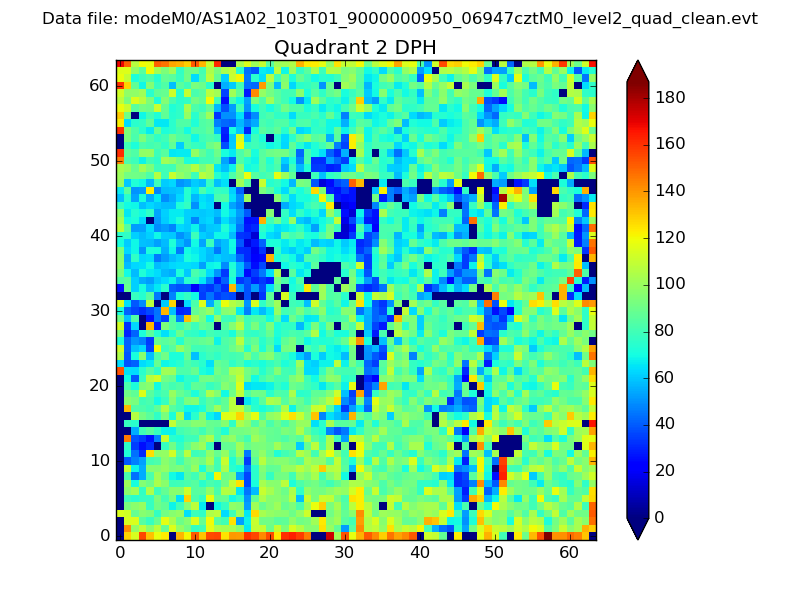 |
Quadrant C |
| Plot type | Count rate plots | Images |
|---|---|---|
| Comparison with Poisson distribution Blue bars denote a histogram of data divided into 1 sec bins. Red curve is a Poisson curve with rate = median count rate of data. |
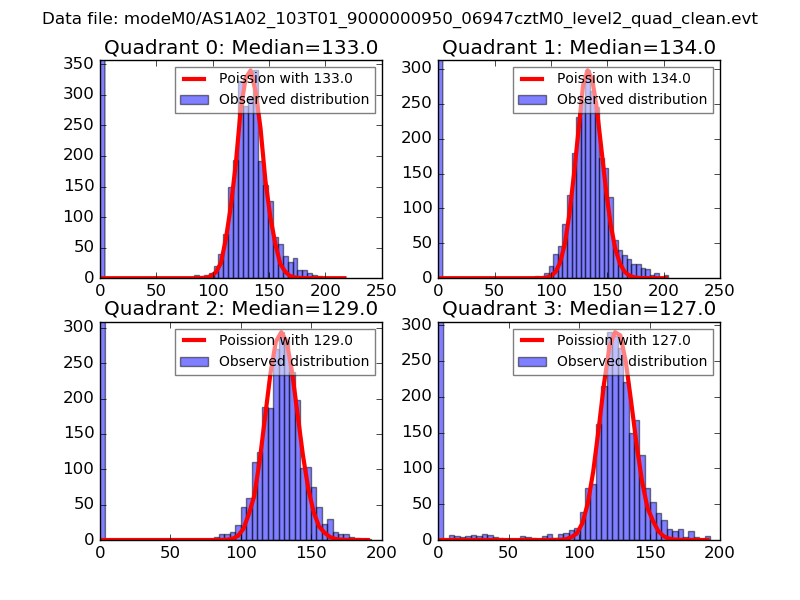 |
 |
| Quadrant-wise count rates Data is divided into 100 sec bins |
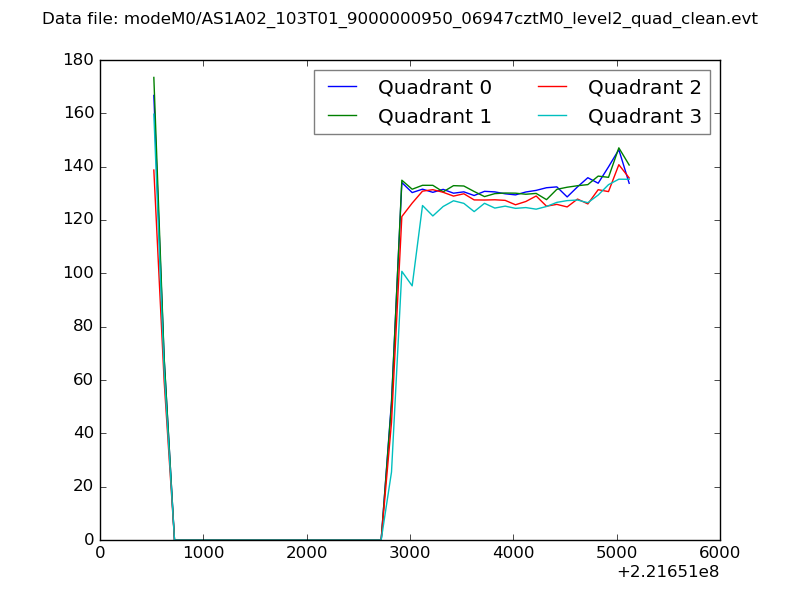 |
|
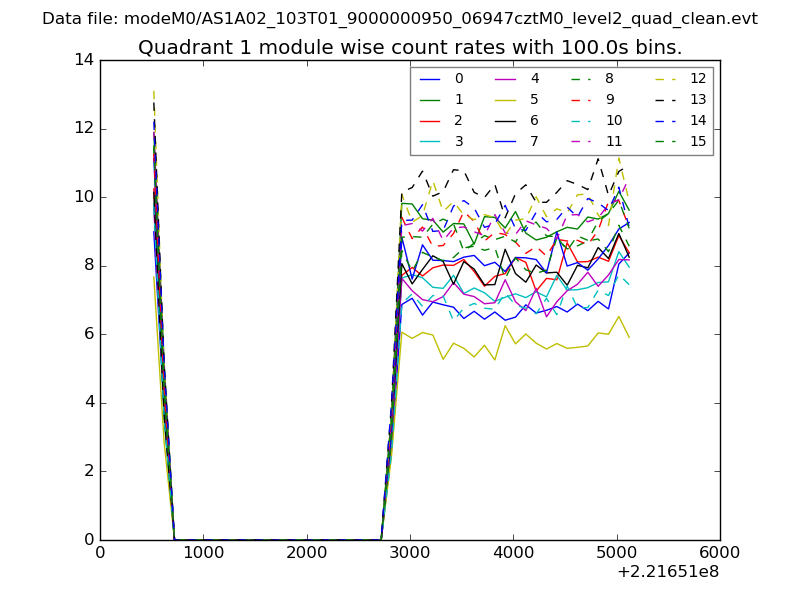
| Module-wise count rates for Quadrant A Data is divided into 100 sec bins |
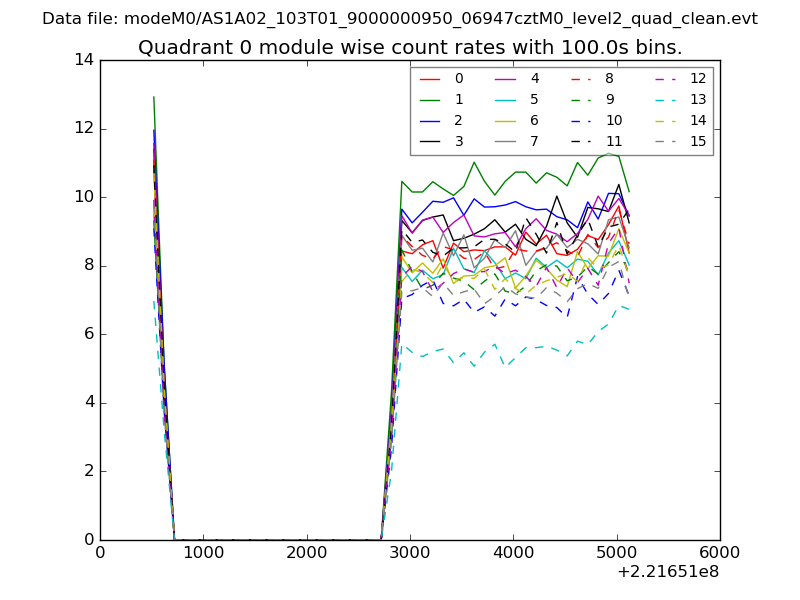 |
 |
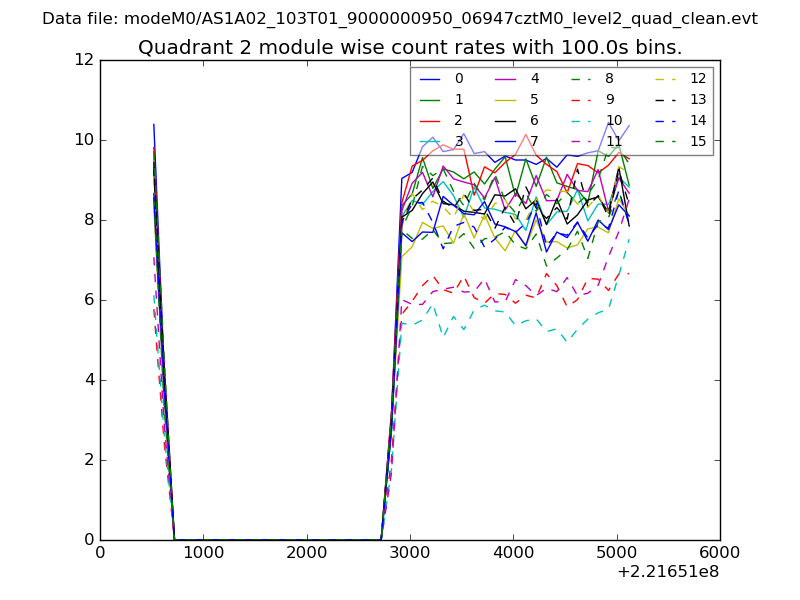
| Module-wise count rates for Quadrant B Data is divided into 100 sec bins |
 |
 |
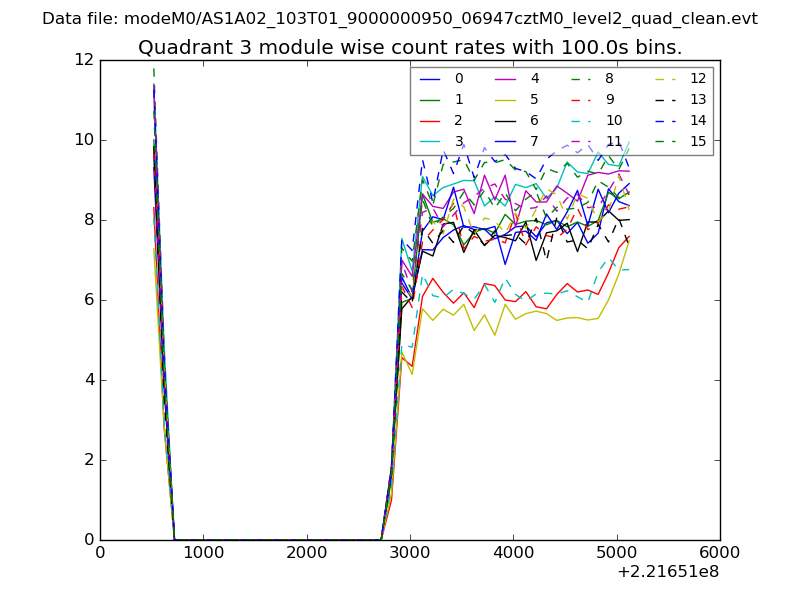
| Module-wise count rates for Quadrant C Data is divided into 100 sec bins |
 |
 |
| Module-wise count rates for Quadrant D Data is divided into 100 sec bins |
 |
 |
| Parameter | Plot |
|---|---|
| CZT HV Monitor | 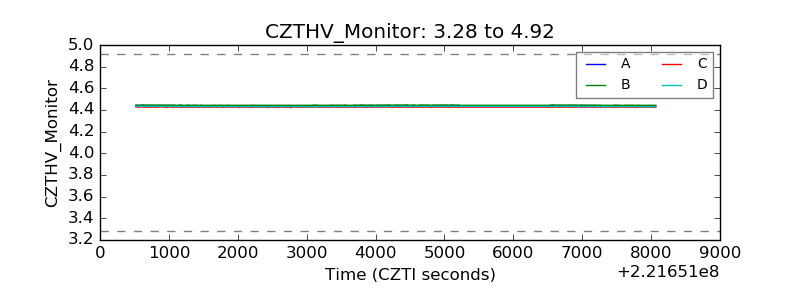 |
| D_VDD | 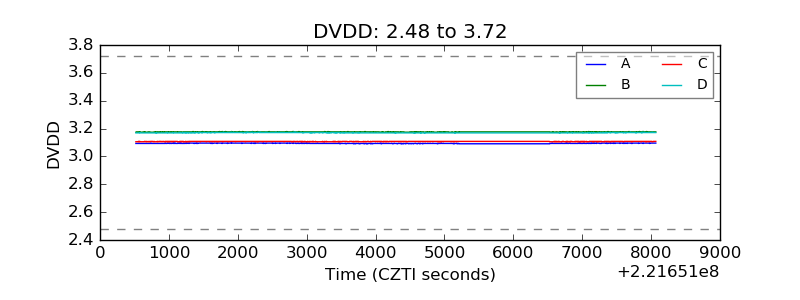 |
| Temperature 1 | 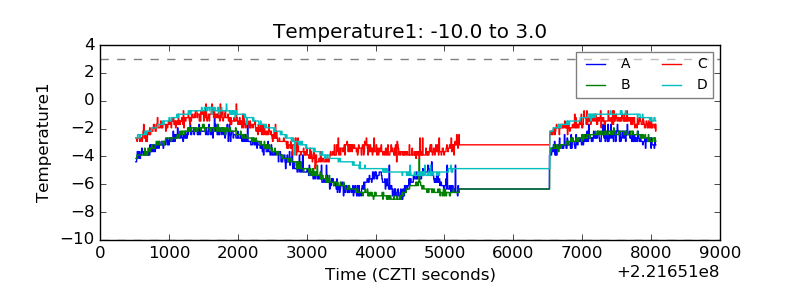 |
| Veto HV Monitor | 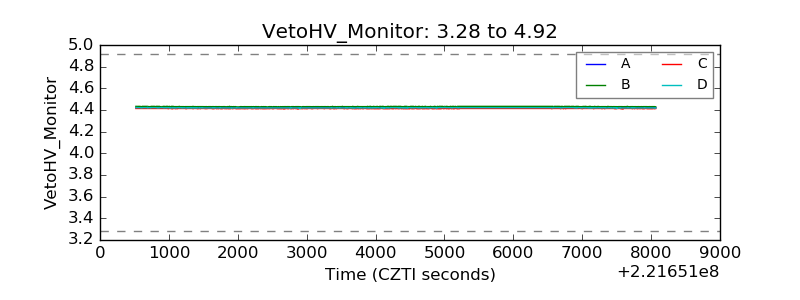 |
| Veto LLD | 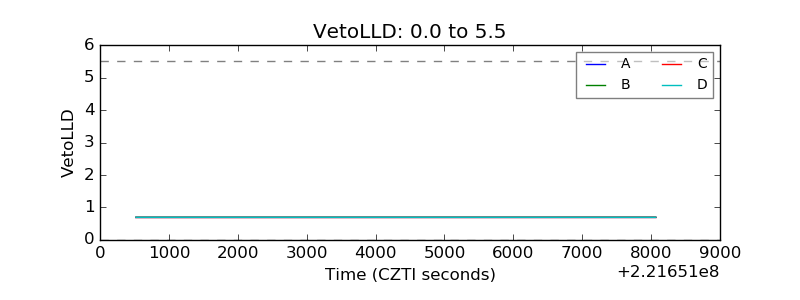 |
| Alpha Counter | 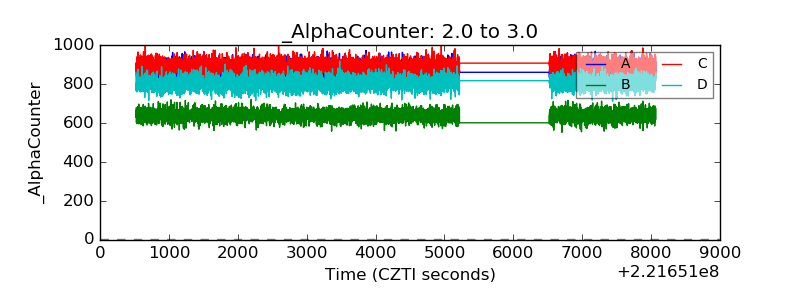 |
| _CPM_Rate | 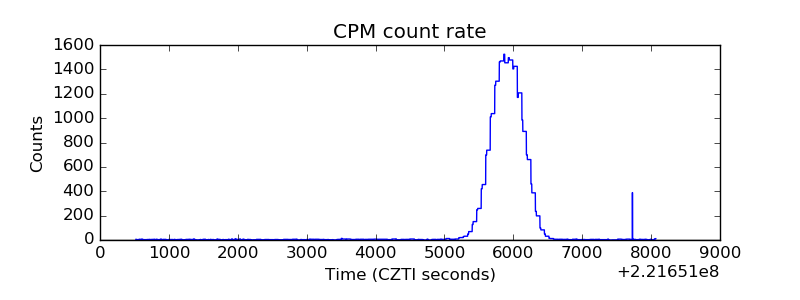 |
| CZT Counter | 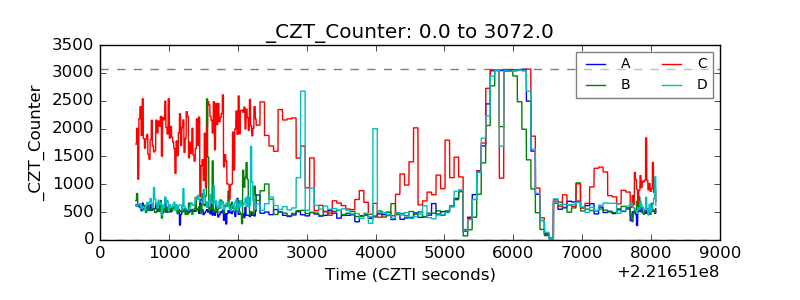 |
| +2.5 Volts monitor |  |
| +5 Volts monitor | 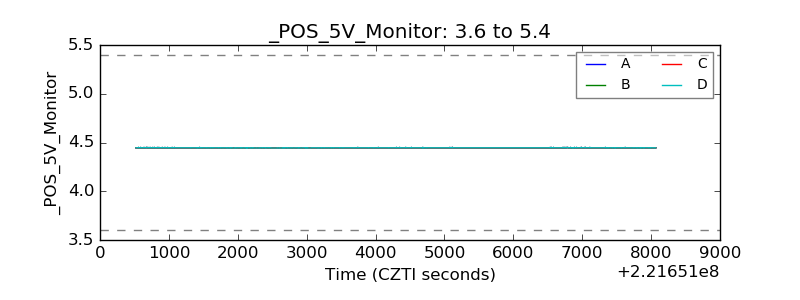 |
| _ROLL_ROT | 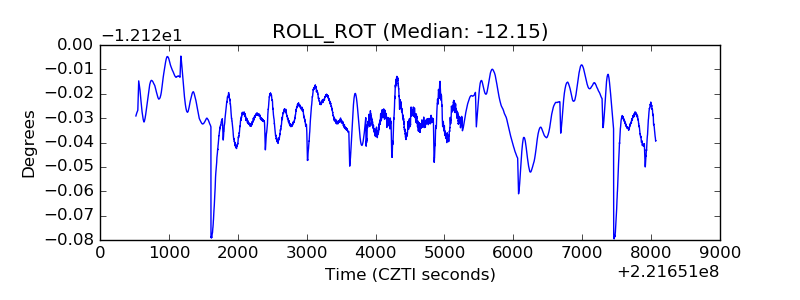 |
| _Roll_DEC | 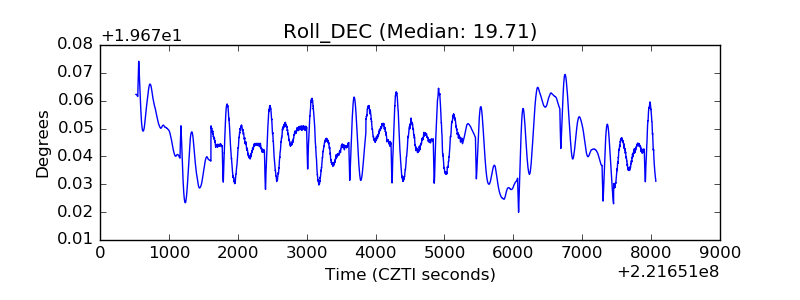 |
| _Roll_RA | 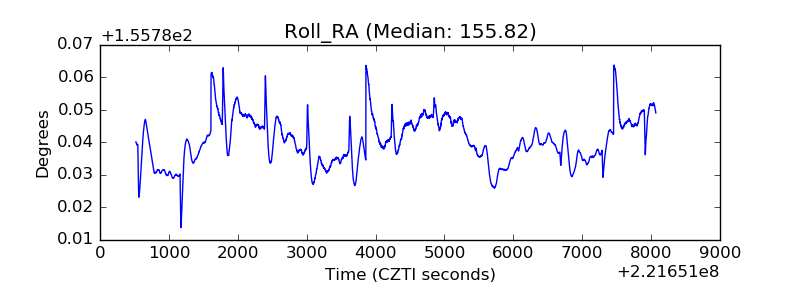 |
| Veto Counter | 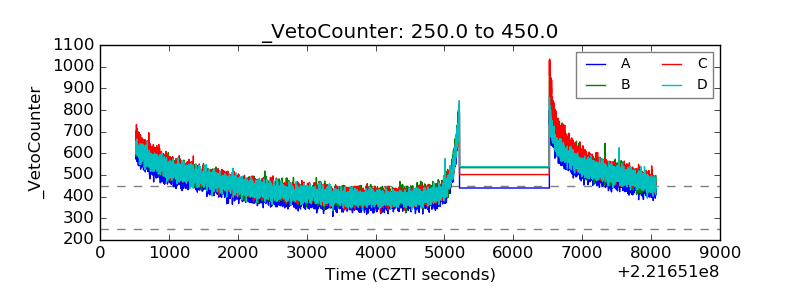 |