| Param | Original file | Final file |
|---|---|---|
| Filename | modeM0/AS1A02_103T01_9000000950_06949cztM0_level2.evt | modeM0/AS1A02_103T01_9000000950_06949cztM0_level2_quad_clean.evt |
| Size (bytes) | 174,144,960 | 16,591,680 |
| Size | 166.1 MB | 15.8 MB |
| Events in quadrant A | 1,211,692 | 82,367 |
| Events in quadrant B | 1,330,736 | 81,820 |
| Events in quadrant C | 1,197,877 | 81,759 |
| Events in quadrant D | 1,365,292 | 79,902 |
| Mode SS | |||
|---|---|---|---|
| Quadrant | BADHDUFLAG | Total packets | Discarded packets |
| A | 0 | 50 | 0 |
| B | 0 | 50 | 0 |
| C | 0 | 50 | 0 |
| D | 0 | 50 | 0 |
| Mode M9 | |||
|---|---|---|---|
| Quadrant | BADHDUFLAG | Total packets | Discarded packets |
| A | 0 | 6 | 0 |
| B | 0 | 6 | 0 |
| C | 0 | 6 | 0 |
| D | 0 | 7 | 0 |
| Mode M0 | |||
|---|---|---|---|
| Quadrant | BADHDUFLAG | Total packets | Discarded packets |
| A | 0 | 5052 | 1 |
| B | 0 | 5416 | 1 |
| C | 0 | 5014 | 1 |
| D | 0 | 5551 | 1 |
| Quadrant | Total seconds | Saturated seconds | Saturation percentage |
|---|---|---|---|
| A | 2441 | 8 | 0.327735% |
| B | 2441 | 12 | 0.491602% |
| C | 2441 | 1 | 0.040967% |
| D | 2441 | 22 | 0.901270% |
Noise dominated data is calculated using 1-second bins in cleaned event files. If a bin has >2000 counts, and if more than 50% of those come from <1% of pixels, then it is considered to be noise-dominated and hence unusable.
| Quadrant | # 1 sec bins | Bins with >0 counts | Bins with >2000 counts | High rate bins dominated by noise | Noise dominated (total time) | Noise dominated (detector-on time) | Marked lightcurve |
|---|---|---|---|---|---|---|---|
| A | 2441 | 2441 | 0 | 0 | 0.00% | 0.00% | 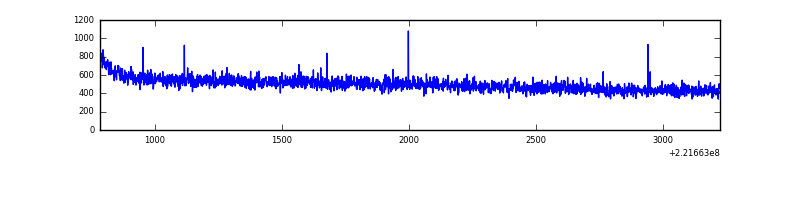 |
| B | 2441 | 2441 | 0 | 0 | 0.00% | 0.00% | 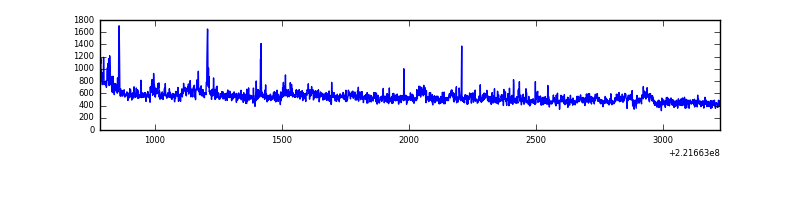 |
| C | 2441 | 2441 | 0 | 0 | 0.00% | 0.00% | 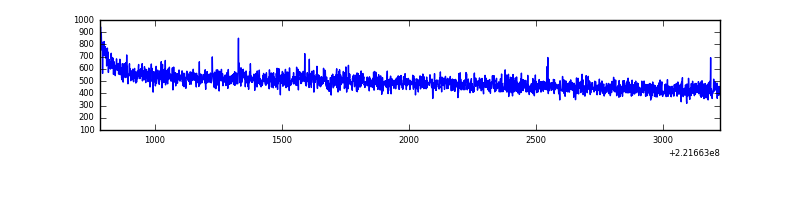 |
| D | 2441 | 2441 | 20 | 20 | 0.82% | 0.82% | 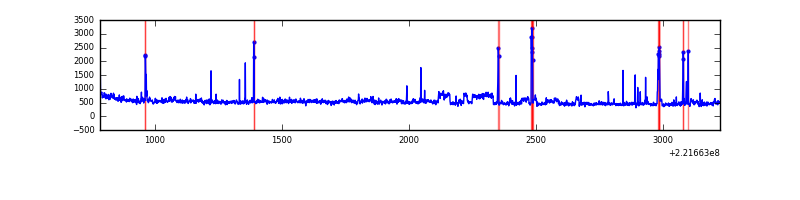 |
Top three noisy pixels from each quadrant. If the there are fewer than three noisy pixels in the level2.evt file, extra rows are filled as -1
| Pixel properties | Quadrant properties | ||||||
|---|---|---|---|---|---|---|---|
| Quadrant | DetID | PixID | Counts | Sigma | Mean | Median | Sigma |
| A | 0 | 226 | 3079 | 41.97 | 314 | 308 | 66.0 |
| A | 12 | 194 | 2984 | 40.53 | 314 | 308 | 66.0 |
| A | 13 | 14 | 1770 | 22.15 | 314 | 308 | 66.0 |
| B | 0 | 228 | 81624 | 1325.6 | 313 | 306 | 61.3 |
| B | 4 | 81 | 12408 | 197.28 | 313 | 306 | 61.3 |
| B | 12 | 111 | 5343 | 82.11 | 313 | 306 | 61.3 |
| C | 7 | 220 | 2725 | 33.51 | 305 | 306 | 72.2 |
| C | 10 | 22 | 2712 | 33.33 | 305 | 306 | 72.2 |
| C | 13 | 61 | 2407 | 29.11 | 305 | 306 | 72.2 |
| D | 1 | 20 | 66986 | 882.66 | 306 | 298 | 75.6 |
| D | 8 | 195 | 49768 | 654.77 | 306 | 298 | 75.6 |
| D | 2 | 136 | 27912 | 365.49 | 306 | 298 | 75.6 |
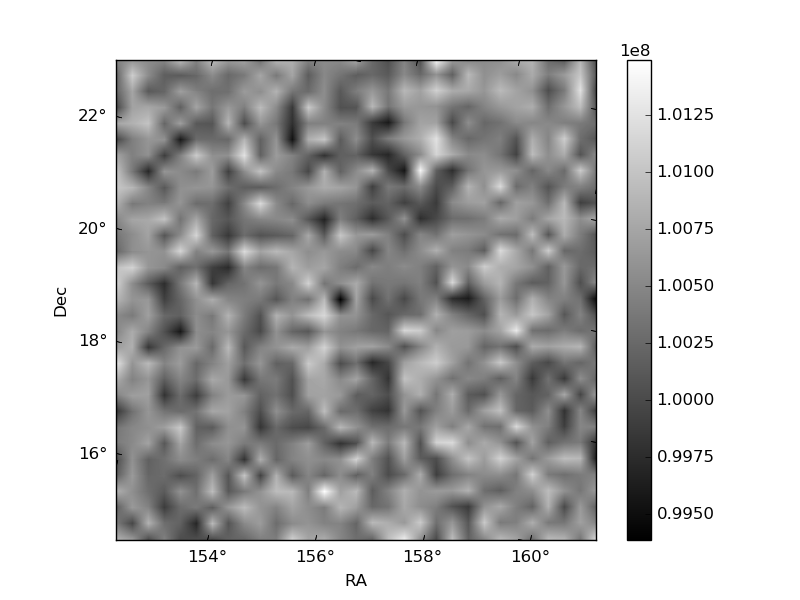
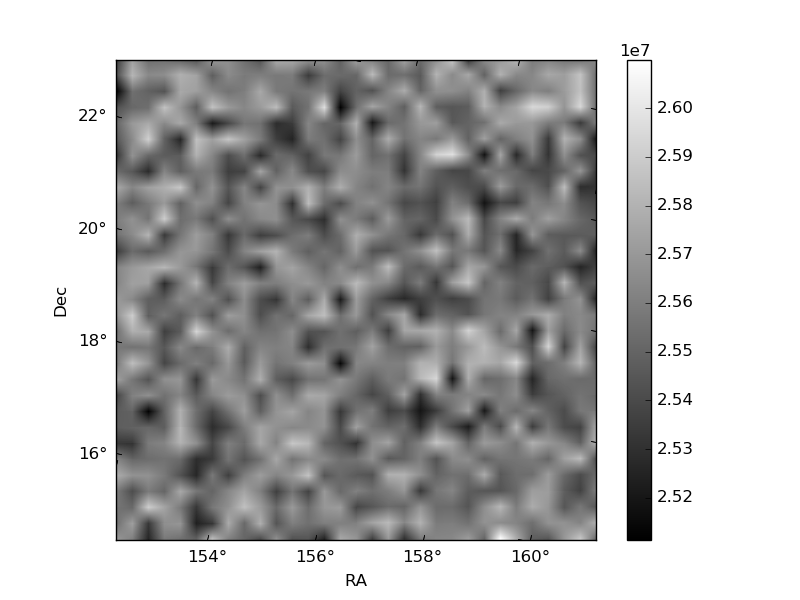
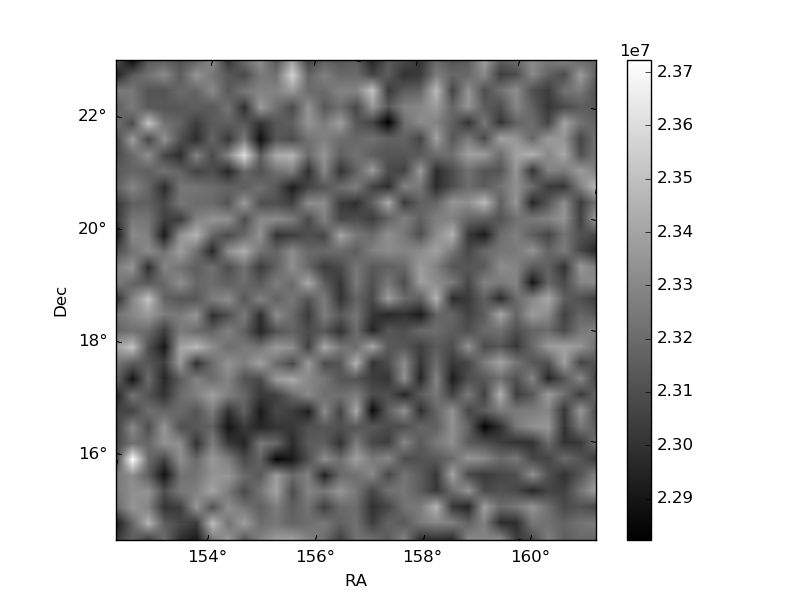
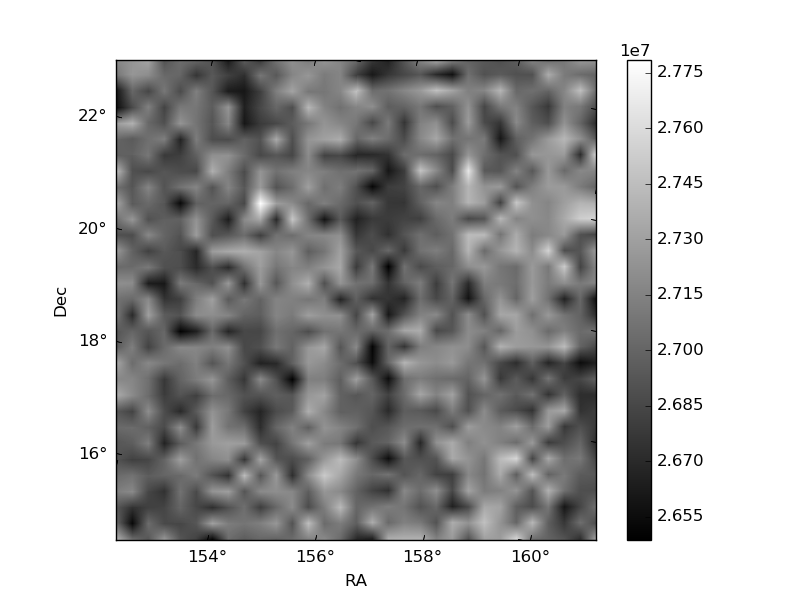
Histogram calculated using DETX and DETY for each event in the final _common_clean file
| Quadrant A | 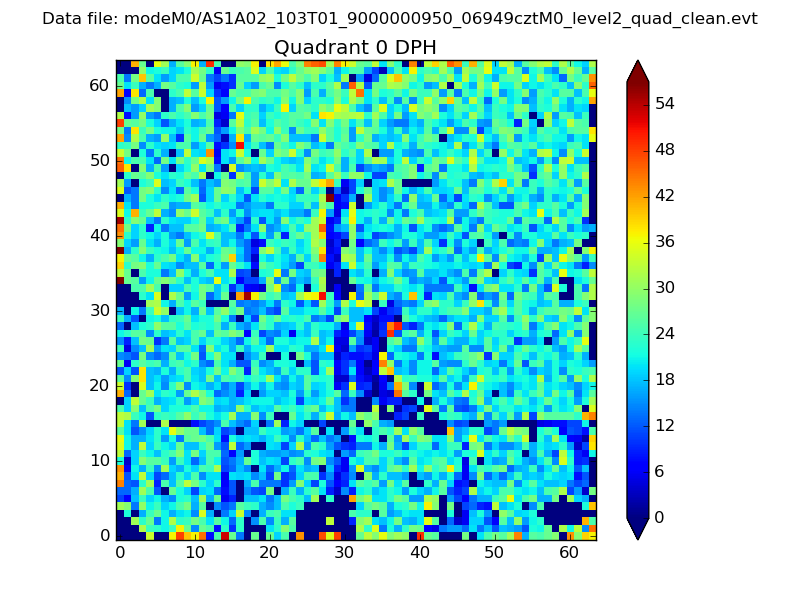 |
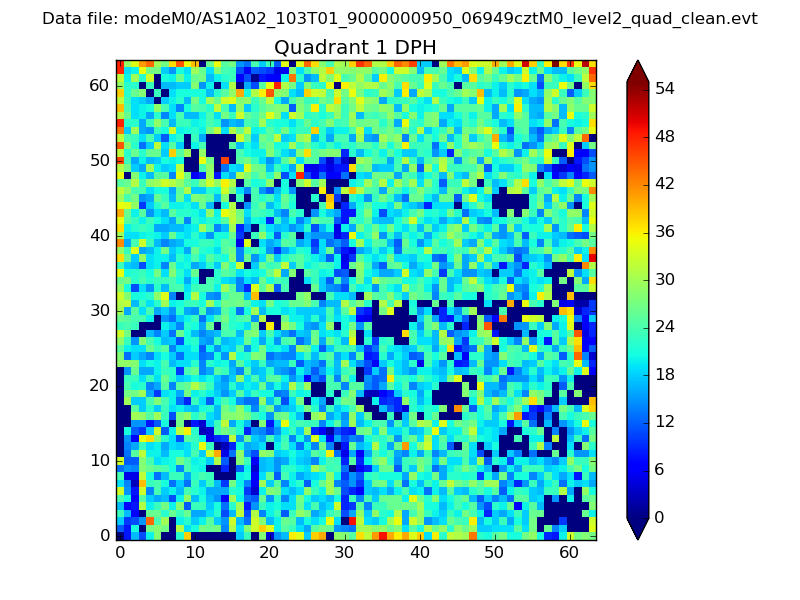 |
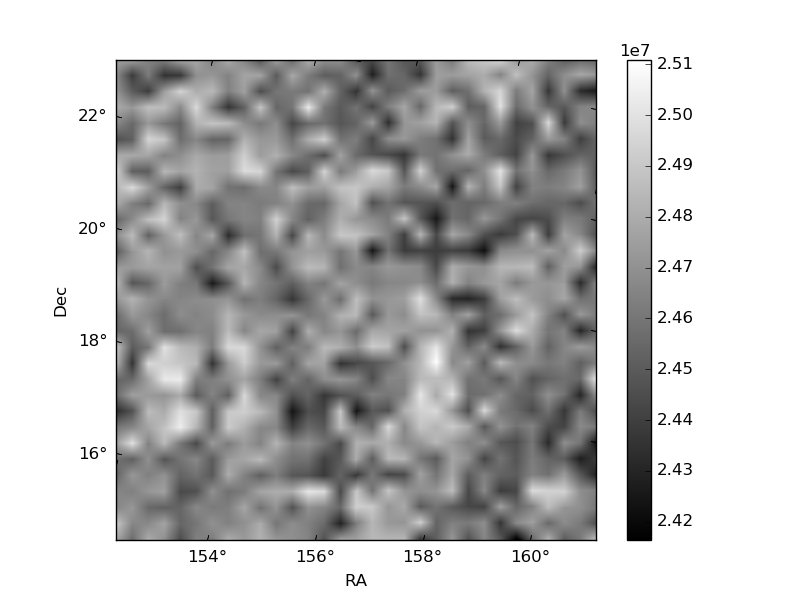
Quadrant B |
|---|---|---|---|
| Quadrant D | 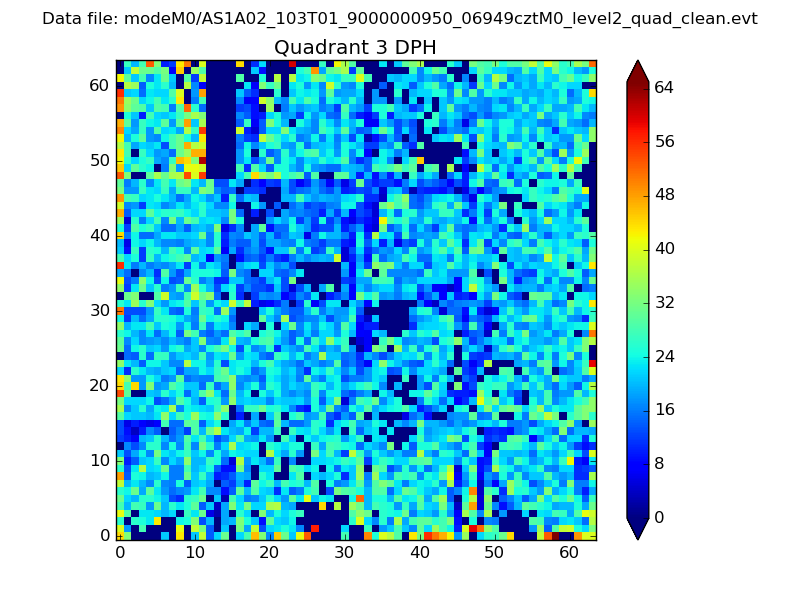 |
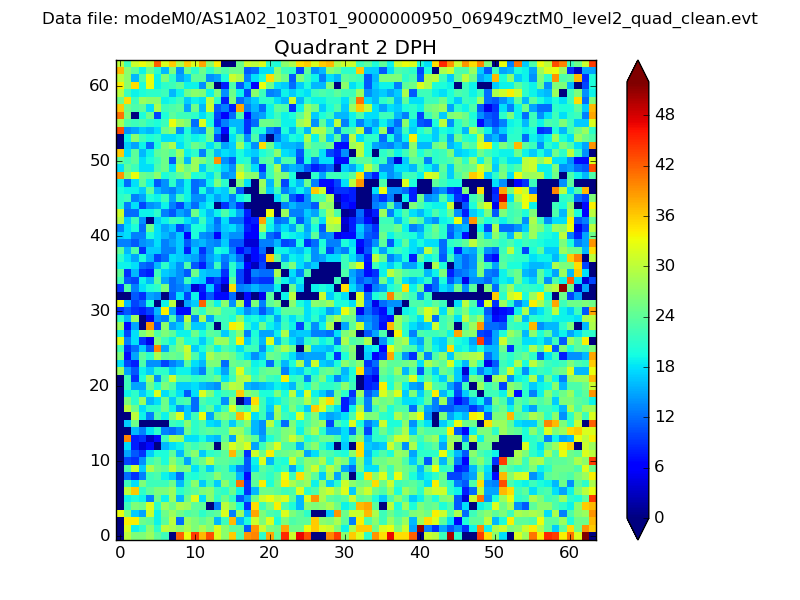 |
Quadrant C |
| Plot type | Count rate plots | Images |
|---|---|---|
| Comparison with Poisson distribution Blue bars denote a histogram of data divided into 1 sec bins. Red curve is a Poisson curve with rate = median count rate of data. |
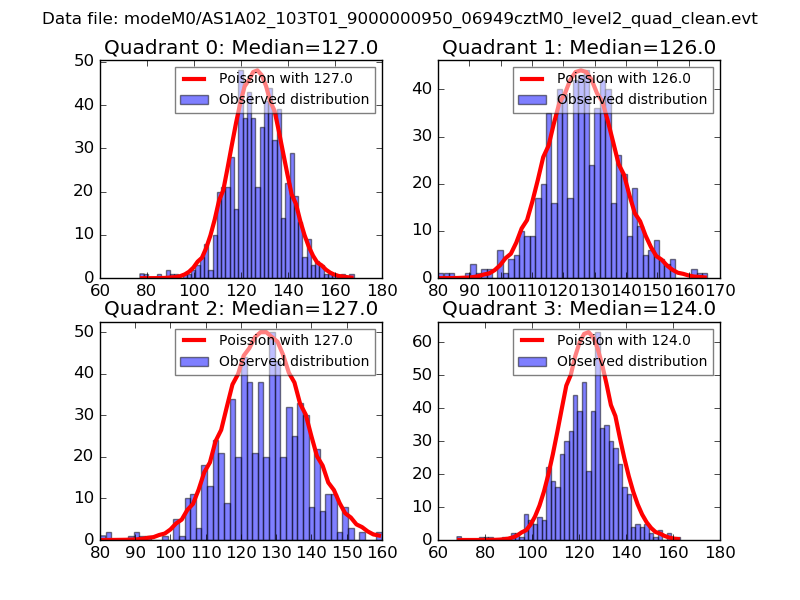 |
 |
| Quadrant-wise count rates Data is divided into 100 sec bins |
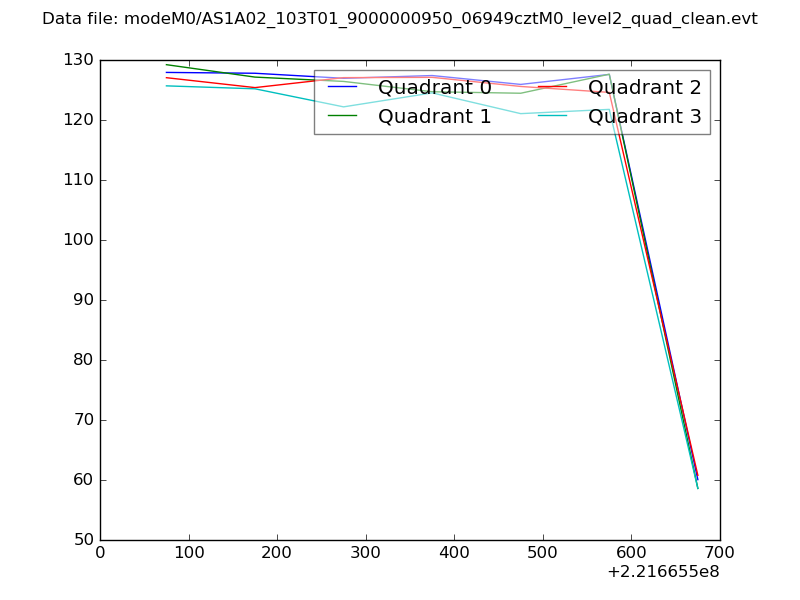 |
|
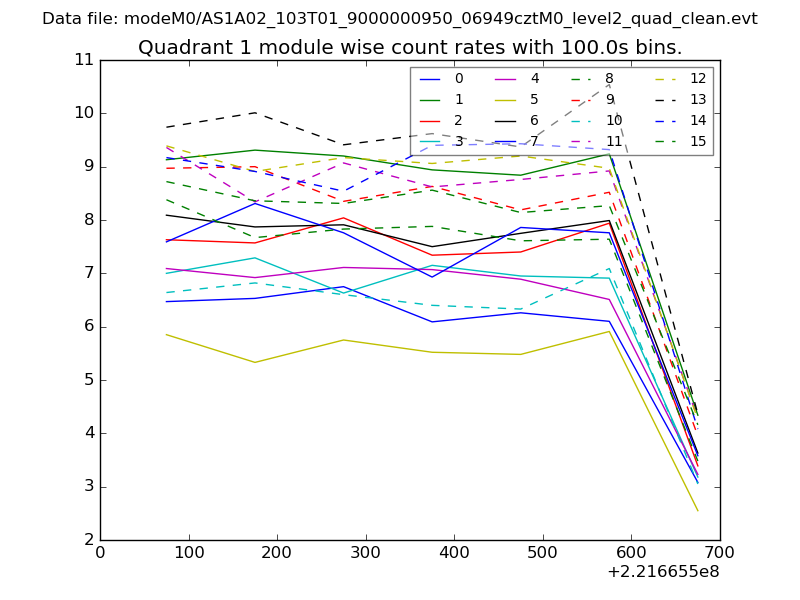
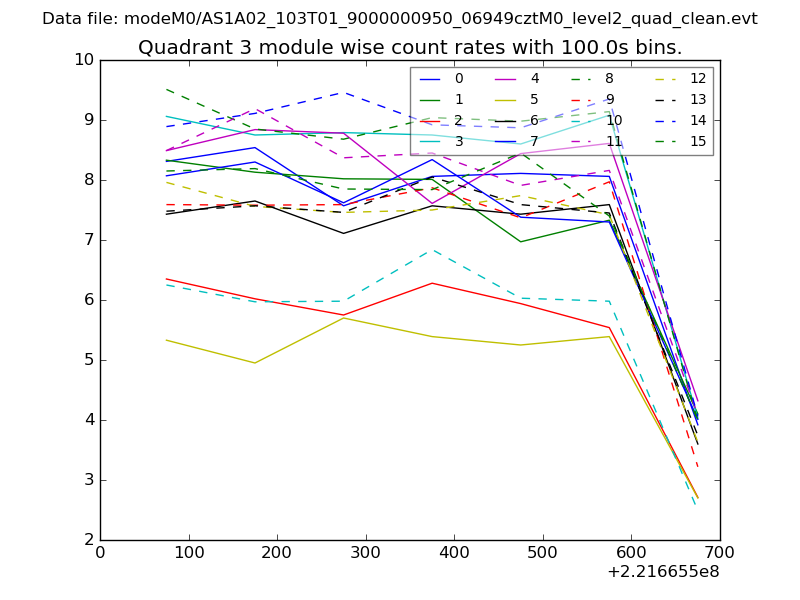
| Module-wise count rates for Quadrant A Data is divided into 100 sec bins |
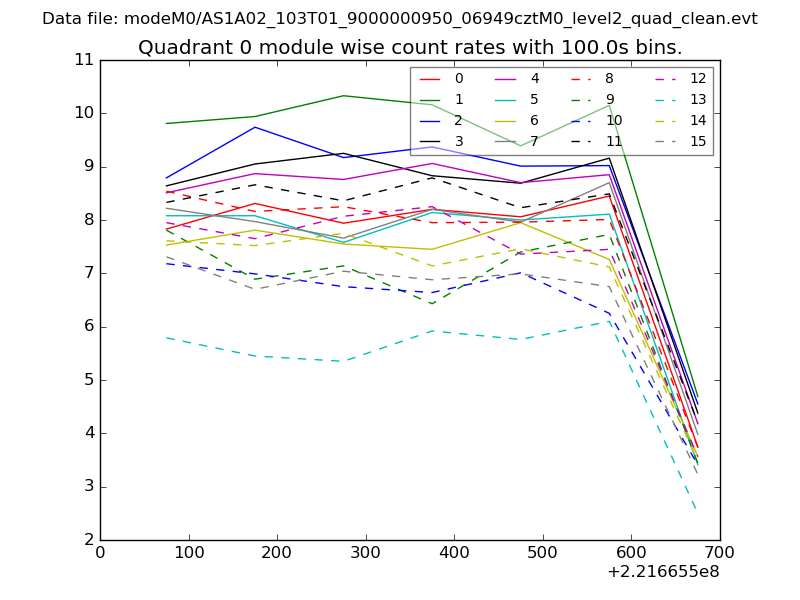 |
 |
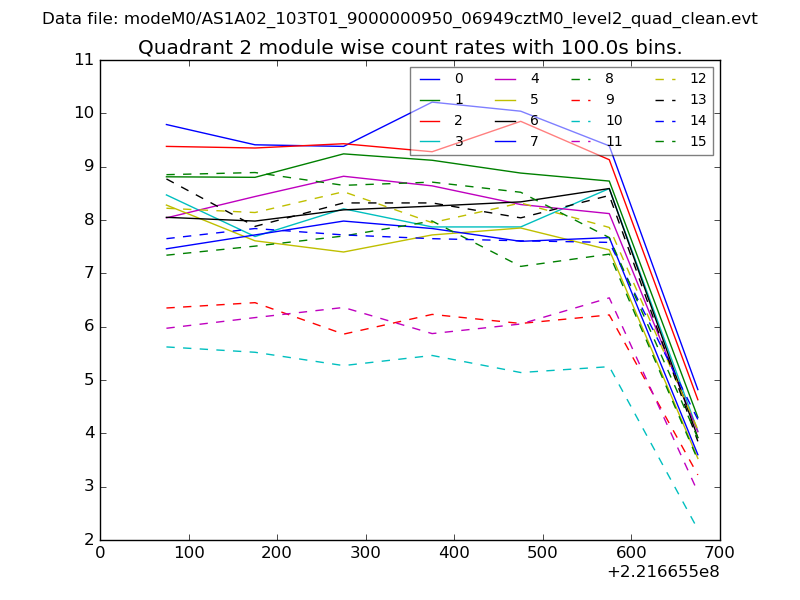
| Module-wise count rates for Quadrant B Data is divided into 100 sec bins |
 |
 |
| Module-wise count rates for Quadrant C Data is divided into 100 sec bins |
 |
 |
| Module-wise count rates for Quadrant D Data is divided into 100 sec bins |
 |
 |
| Parameter | Plot |
|---|---|
| CZT HV Monitor | 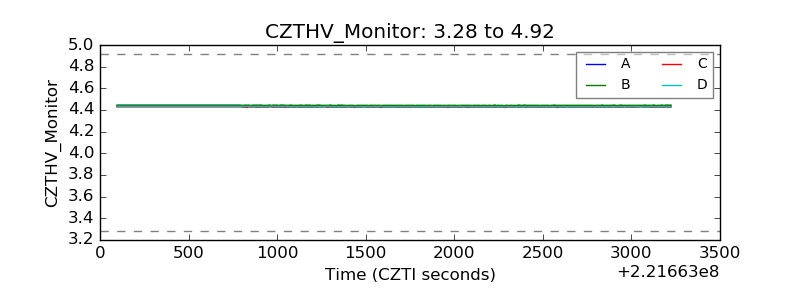 |
| D_VDD | 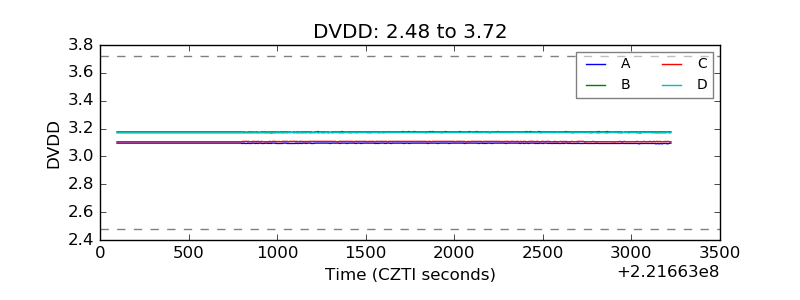 |
| Temperature 1 | 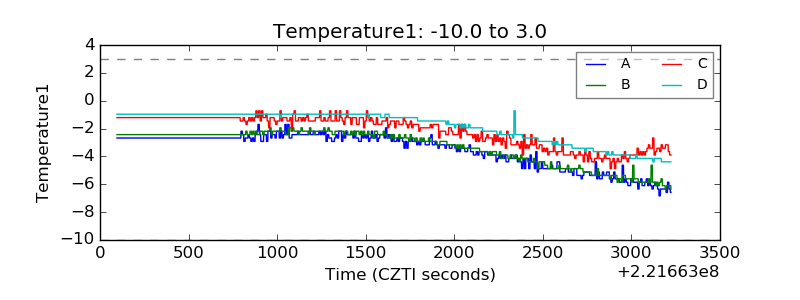 |
| Veto HV Monitor | 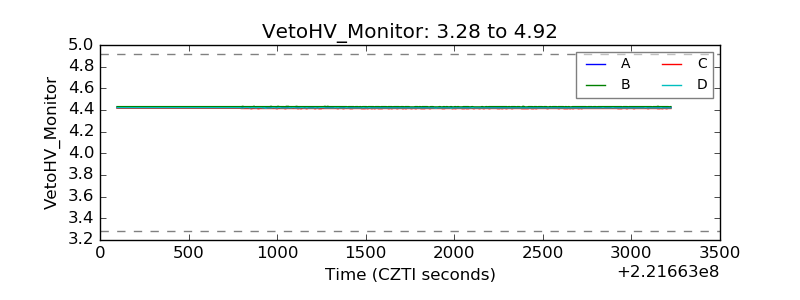 |
| Veto LLD | 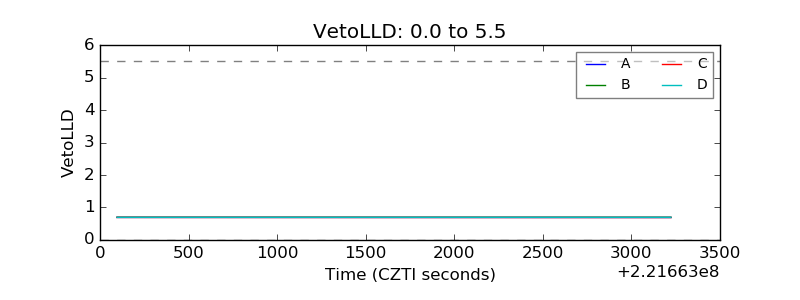 |
| Alpha Counter | 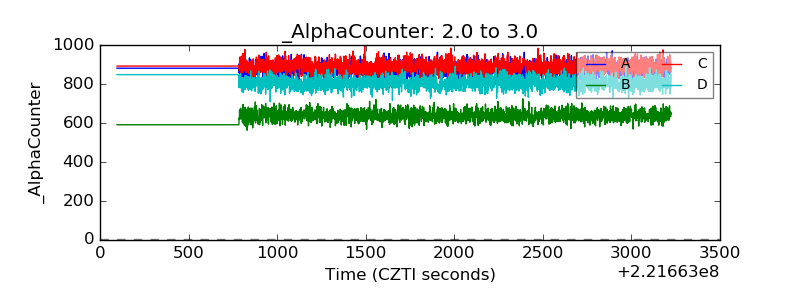 |
| _CPM_Rate | 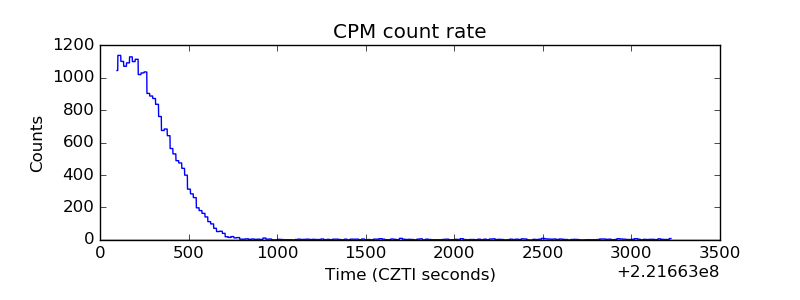 |
| CZT Counter | 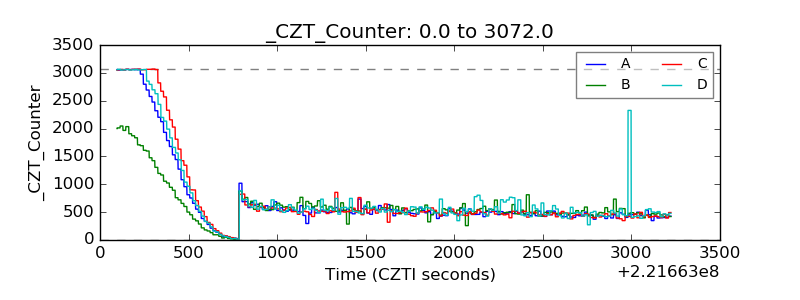 |
| +2.5 Volts monitor |  |
| +5 Volts monitor | 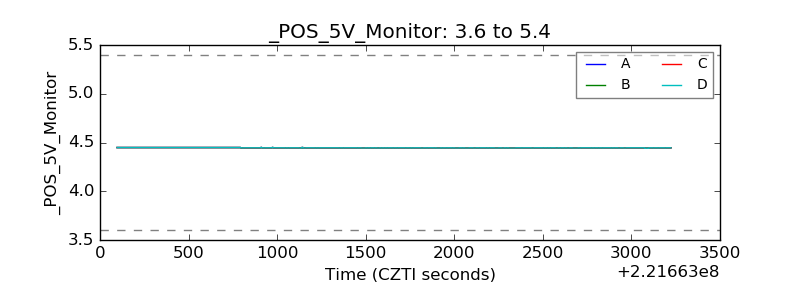 |
| _ROLL_ROT | 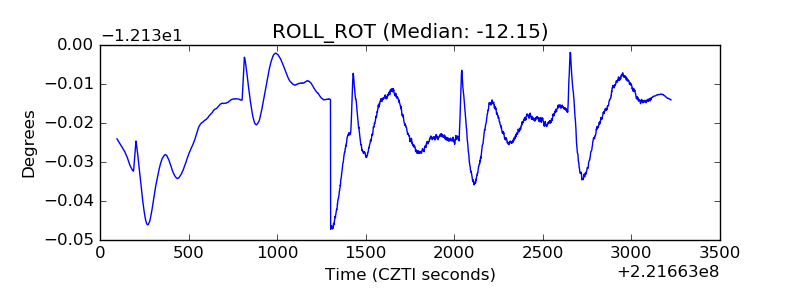 |
| _Roll_DEC | 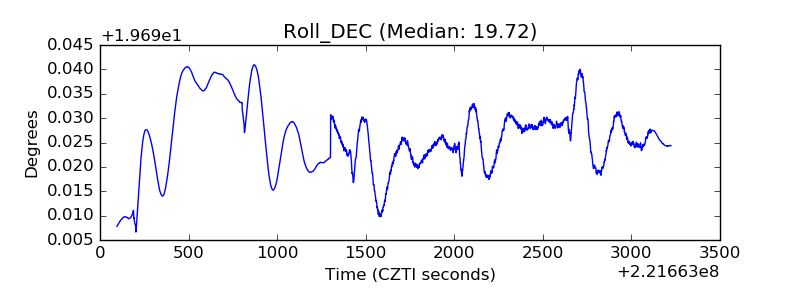 |
| _Roll_RA | 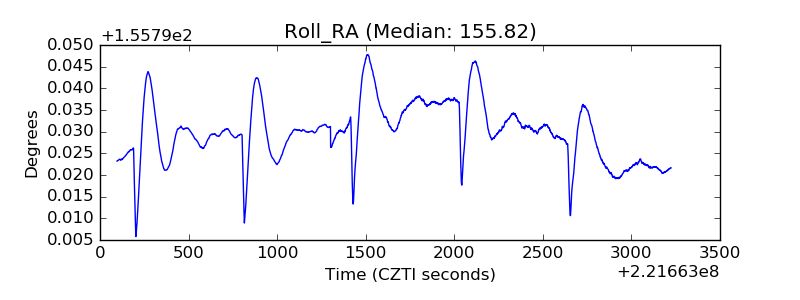 |
| Veto Counter | 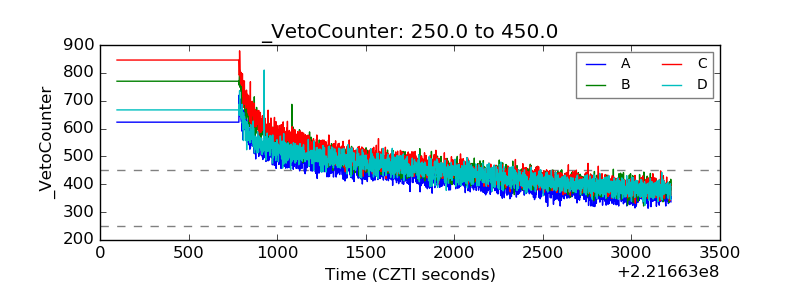 |