| Param | Original file | Final file |
|---|---|---|
| Filename | modeM0/AS1A02_111T01_9000000954cztM0_level2.fits | modeM0/AS1A02_111T01_9000000954cztM0_level2_quad_clean.evt |
| Size (bytes) | 270,060,480 | 279,768,960 |
| Size | 257.5 MB | 266.8 MB |
| Events in quadrant A | 1,613,528 | 1,678,063 |
| Events in quadrant B | 1,537,046 | 1,662,316 |
| Events in quadrant C | 1,590,364 | 1,593,135 |
| Events in quadrant D | 1,357,514 | 1,458,598 |
| Mode M0 | |||
|---|---|---|---|
| Quadrant | BADHDUFLAG | Total packets | Discarded packets |
| A | 0 | 61696 | 0 |
| B | 0 | 67842 | 0 |
| C | 0 | 61656 | 0 |
| D | 0 | 70561 | 0 |
| Mode M9 | |||
|---|---|---|---|
| Quadrant | BADHDUFLAG | Total packets | Discarded packets |
| A | 0 | 21 | 0 |
| B | 0 | 21 | 0 |
| C | 0 | 21 | 0 |
| D | 0 | 21 | 0 |
| Mode SS | |||
|---|---|---|---|
| Quadrant | BADHDUFLAG | Total packets | Discarded packets |
| A | 0 | 616 | 0 |
| B | 0 | 616 | 0 |
| C | 0 | 616 | 0 |
| D | 0 | 616 | 0 |
| Quadrant | Total seconds | Saturated seconds | Saturation percentage |
|---|---|---|---|
| A | 30265 | 194 | 0.641004% |
| B | 30265 | 686 | 2.266645% |
| C | 30265 | 111 | 0.366760% |
| D | 30265 | 332 | 1.096977% |
Noise dominated data is calculated using 1-second bins in cleaned event files. If a bin has >2000 counts, and if more than 50% of those come from <1% of pixels, then it is considered to be noise-dominated and hence unusable.
| Quadrant | # 1 sec bins | Bins with >0 counts | Bins with >2000 counts | High rate bins dominated by noise | Noise dominated (total time) | Noise dominated (detector-on time) | Marked lightcurve |
|---|---|---|---|---|---|---|---|
| A | 32289 | 30264 | 0 | 0 | 0.00% | 0.00% |  |
| B | 32289 | 30260 | 0 | 0 | 0.00% | 0.00% |  |
| C | 32289 | 30265 | 0 | 0 | 0.00% | 0.00% |  |
| D | 32289 | 30261 | 0 | 0 | 0.00% | 0.00% | 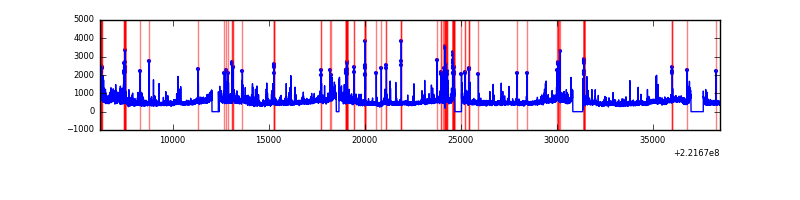 |
Top three noisy pixels from each quadrant. If the there are fewer than three noisy pixels in the level2.evt file, extra rows are filled as -1
| Pixel properties | Quadrant properties | ||||||
|---|---|---|---|---|---|---|---|
| Quadrant | DetID | PixID | Counts | Sigma | Mean | Median | Sigma |
| A | 14 | 188 | 1612 | 11.37 | 418 | 390 | 107.5 |
| A | 0 | 29 | 1597 | 11.23 | 418 | 390 | 107.5 |
| A | 14 | 204 | 1433 | 9.7 | 418 | 390 | 107.5 |
| B | 2 | 9 | 1356 | 11.56 | 406 | 386 | 83.9 |
| B | 14 | 254 | 1093 | 8.43 | 406 | 386 | 83.9 |
| B | 12 | 226 | 1067 | 8.12 | 406 | 386 | 83.9 |
| C | 12 | 241 | 1171 | 6.98 | 420 | 388 | 112.2 |
| C | 2 | 191 | 1065 | 6.04 | 420 | 388 | 112.2 |
| C | 9 | 188 | 1060 | 5.99 | 420 | 388 | 112.2 |
| D | 6 | 231 | 1008 | 6.26 | 388 | 353 | 104.7 |
| D | 15 | 63 | 1005 | 6.23 | 388 | 353 | 104.7 |
| D | 11 | 82 | 1005 | 6.23 | 388 | 353 | 104.7 |
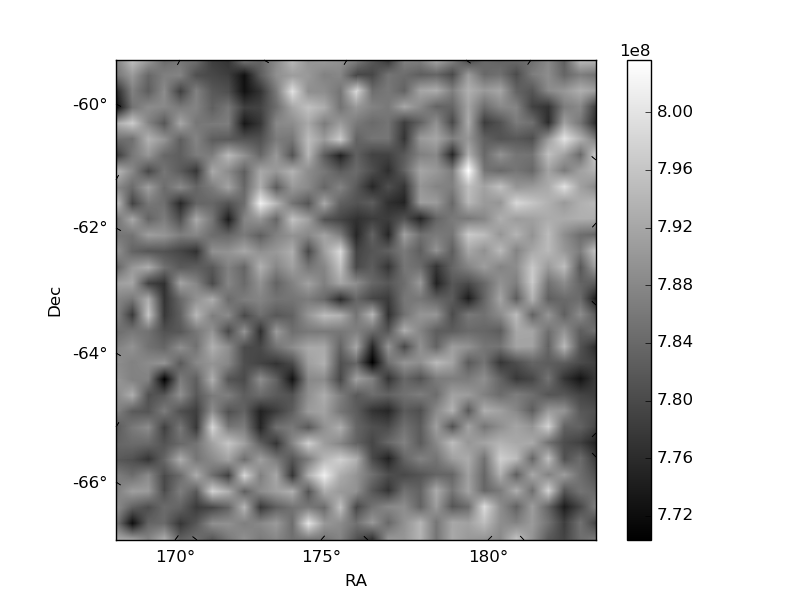
Histogram calculated using DETX and DETY for each event in the final _common_clean file
| Quadrant A | 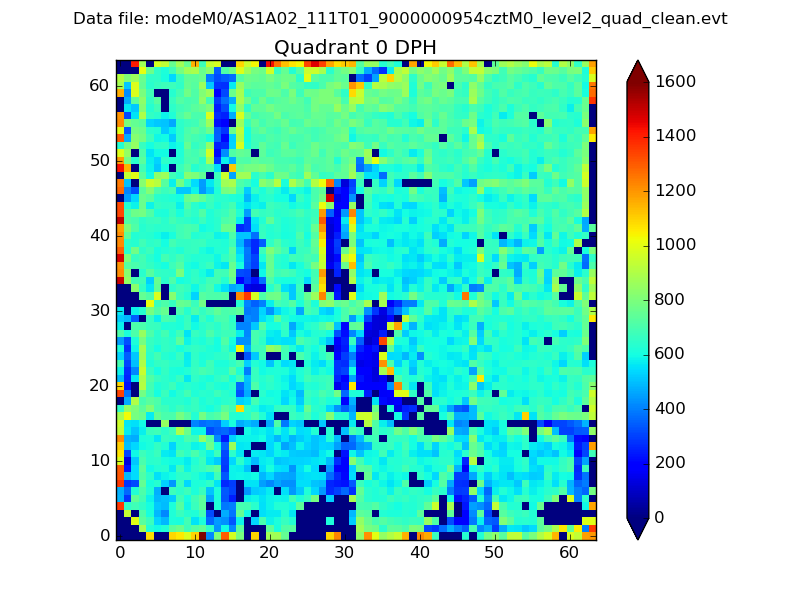 |
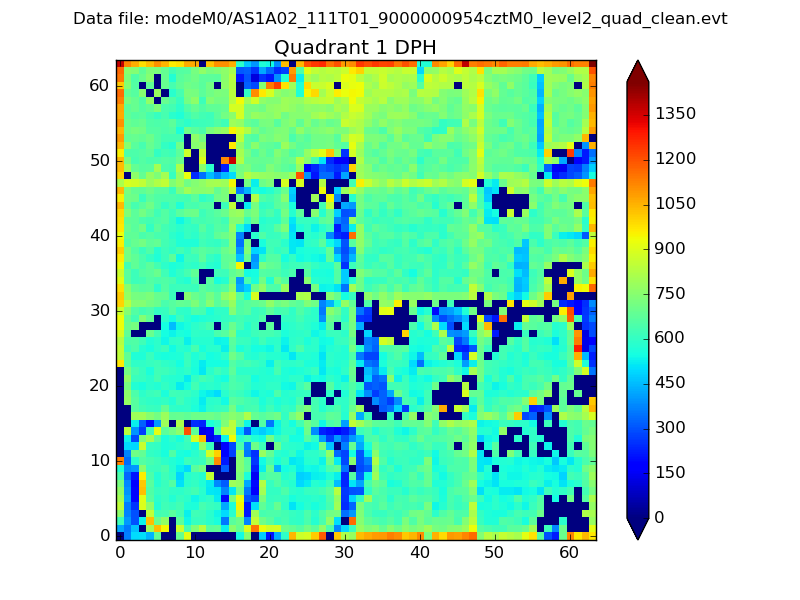 |
Quadrant B |
|---|---|---|---|
| Quadrant D |  |
 |
Quadrant C |
| Plot type | Count rate plots | Images |
|---|---|---|
| Comparison with Poisson distribution Blue bars denote a histogram of data divided into 1 sec bins. Red curve is a Poisson curve with rate = median count rate of data. |
 |
 |
| Quadrant-wise count rates Data is divided into 100 sec bins |
 |
|
| Module-wise count rates for Quadrant A Data is divided into 100 sec bins |
 |
 |
| Module-wise count rates for Quadrant B Data is divided into 100 sec bins |
 |
 |
| Module-wise count rates for Quadrant C Data is divided into 100 sec bins |
 |
 |
| Module-wise count rates for Quadrant D Data is divided into 100 sec bins |
 |
 |
| Parameter | Plot |
|---|---|
| CZT HV Monitor | 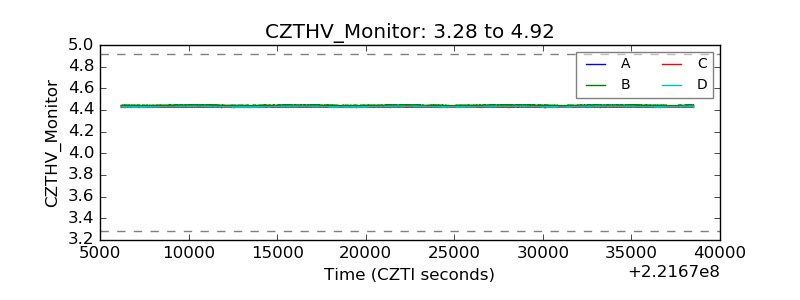 |
| D_VDD |  |
| Temperature 1 |  |
| Veto HV Monitor | 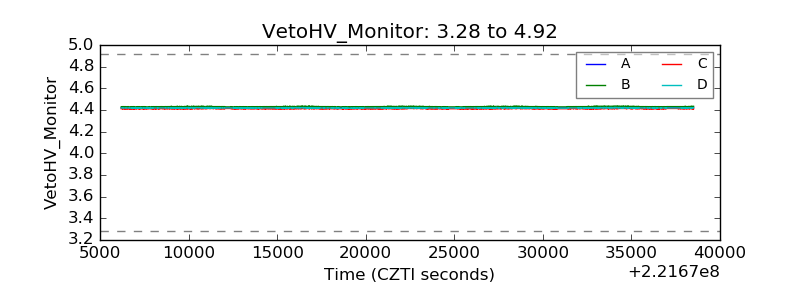 |
| Veto LLD |  |
| Alpha Counter |  |
| _CPM_Rate |  |
| CZT Counter |  |
| +2.5 Volts monitor |  |
| +5 Volts monitor |  |
| _ROLL_ROT |  |
| _Roll_DEC |  |
| _Roll_RA |  |
| Veto Counter |  |