| Param | Original file | Final file |
|---|---|---|
| Filename | modeM0/AS1A02_111T01_9000000954_06950cztM0_level2.evt | modeM0/AS1A02_111T01_9000000954_06950cztM0_level2_quad_clean.evt |
| Size (bytes) | 116,277,120 | 10,385,280 |
| Size | 110.9 MB | 9.9 MB |
| Events in quadrant A | 740,631 | 50,047 |
| Events in quadrant B | 817,887 | 50,462 |
| Events in quadrant C | 711,052 | 50,252 |
| Events in quadrant D | 1,143,538 | 48,172 |
| Mode M0 | |||
|---|---|---|---|
| Quadrant | BADHDUFLAG | Total packets | Discarded packets |
| A | 0 | 3222 | 2 |
| B | 0 | 3426 | 1 |
| C | 0 | 3198 | 1 |
| D | 0 | 4544 | 1 |
| Mode M9 | |||
|---|---|---|---|
| Quadrant | BADHDUFLAG | Total packets | Discarded packets |
| A | 0 | 1 | 0 |
| B | 0 | 1 | 0 |
| C | 0 | 1 | 0 |
| D | 0 | 1 | 0 |
| Mode SS | |||
|---|---|---|---|
| Quadrant | BADHDUFLAG | Total packets | Discarded packets |
| A | 0 | 30 | 0 |
| B | 0 | 30 | 0 |
| C | 0 | 30 | 0 |
| D | 0 | 30 | 0 |
| Quadrant | Total seconds | Saturated seconds | Saturation percentage |
|---|---|---|---|
| A | 1556 | 20 | 1.285347% |
| B | 1556 | 38 | 2.442159% |
| C | 1556 | 12 | 0.771208% |
| D | 1556 | 37 | 2.377892% |
Noise dominated data is calculated using 1-second bins in cleaned event files. If a bin has >2000 counts, and if more than 50% of those come from <1% of pixels, then it is considered to be noise-dominated and hence unusable.
| Quadrant | # 1 sec bins | Bins with >0 counts | Bins with >2000 counts | High rate bins dominated by noise | Noise dominated (total time) | Noise dominated (detector-on time) | Marked lightcurve |
|---|---|---|---|---|---|---|---|
| A | 1556 | 1556 | 0 | 0 | 0.00% | 0.00% | 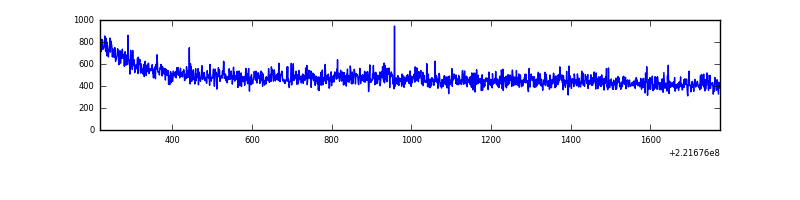 |
| B | 1556 | 1556 | 0 | 0 | 0.00% | 0.00% | 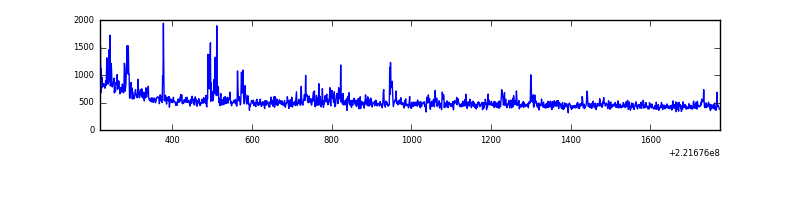 |
| C | 1556 | 1556 | 0 | 0 | 0.00% | 0.00% | 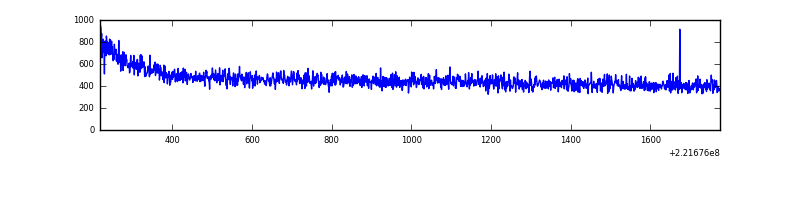 |
| D | 1556 | 1556 | 18 | 18 | 1.16% | 1.16% | 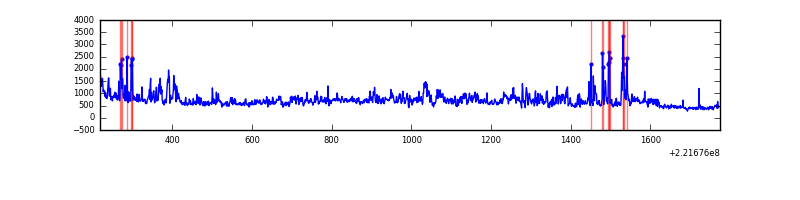 |
Top three noisy pixels from each quadrant. If the there are fewer than three noisy pixels in the level2.evt file, extra rows are filled as -1
| Pixel properties | Quadrant properties | ||||||
|---|---|---|---|---|---|---|---|
| Quadrant | DetID | PixID | Counts | Sigma | Mean | Median | Sigma |
| A | 0 | 143 | 3682 | 85.97 | 190 | 185 | 40.7 |
| A | 0 | 226 | 1895 | 42.04 | 190 | 185 | 40.7 |
| A | 12 | 194 | 1855 | 41.05 | 190 | 185 | 40.7 |
| B | 4 | 48 | 46433 | 1210.24 | 188 | 183 | 38.2 |
| B | 0 | 219 | 16536 | 427.92 | 188 | 183 | 38.2 |
| B | 0 | 245 | 6668 | 169.7 | 188 | 183 | 38.2 |
| C | 13 | 61 | 1462 | 29.52 | 181 | 182 | 43.4 |
| C | 3 | 233 | 730 | 12.64 | 181 | 182 | 43.4 |
| C | 7 | 159 | 657 | 10.95 | 181 | 182 | 43.4 |
| D | 8 | 195 | 103136 | 2234.07 | 181 | 175 | 46.1 |
| D | 14 | 34 | 89764 | 1943.93 | 181 | 175 | 46.1 |
| D | 2 | 152 | 84798 | 1836.17 | 181 | 175 | 46.1 |
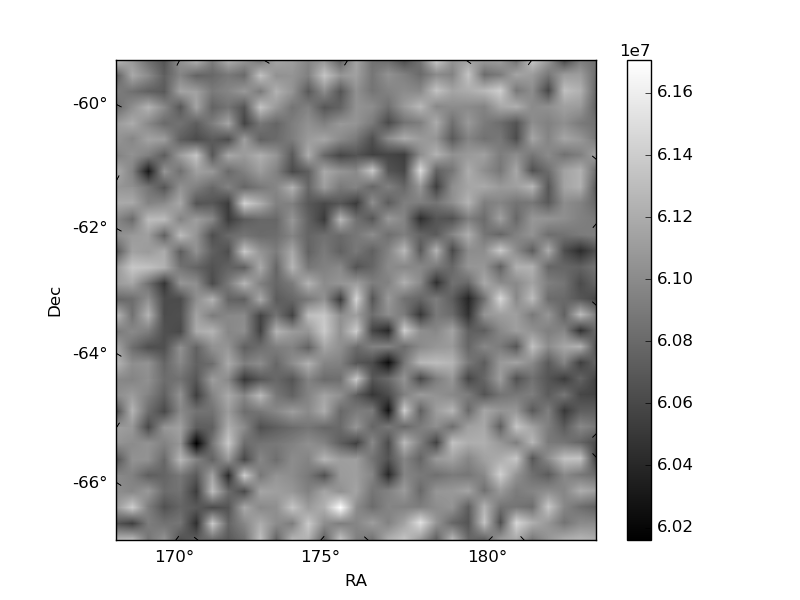
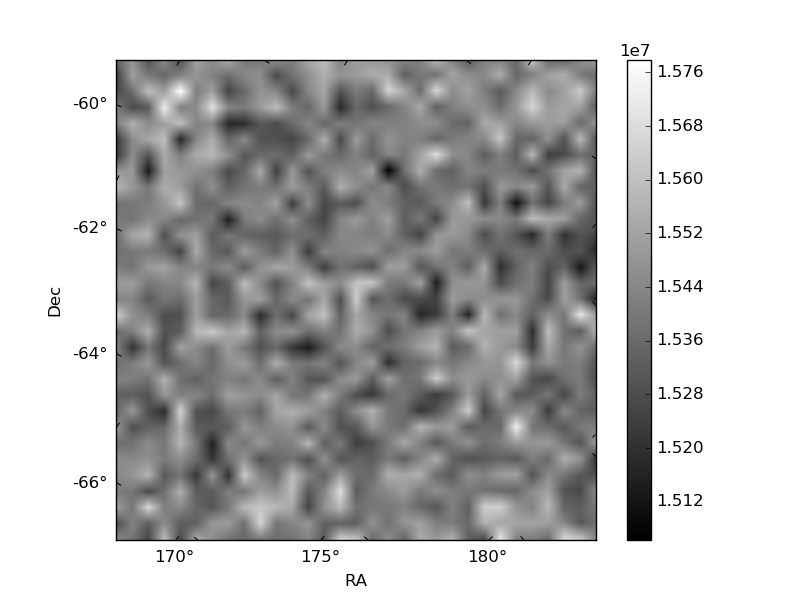
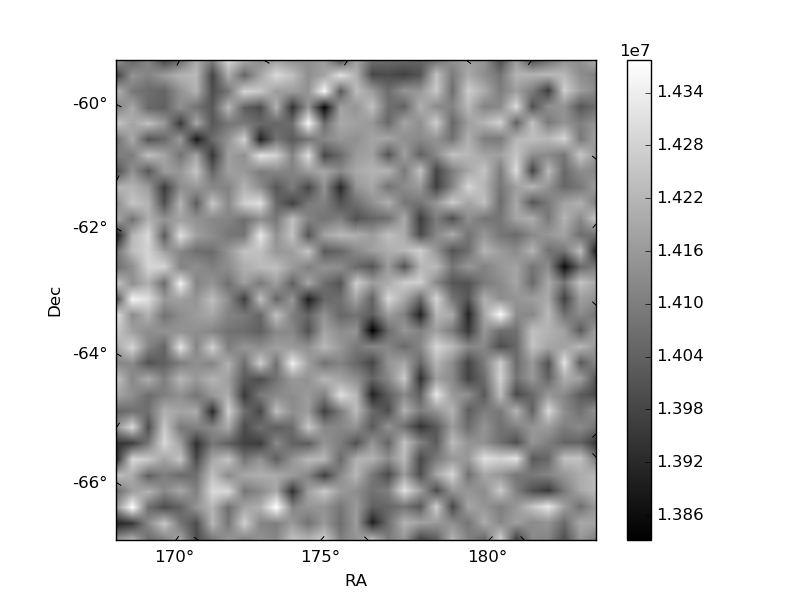
Histogram calculated using DETX and DETY for each event in the final _common_clean file
| Quadrant A | 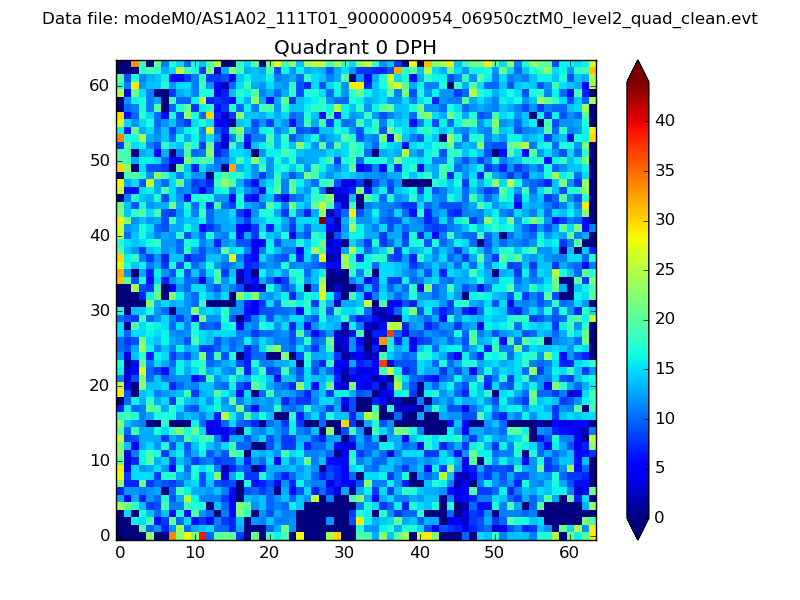 |
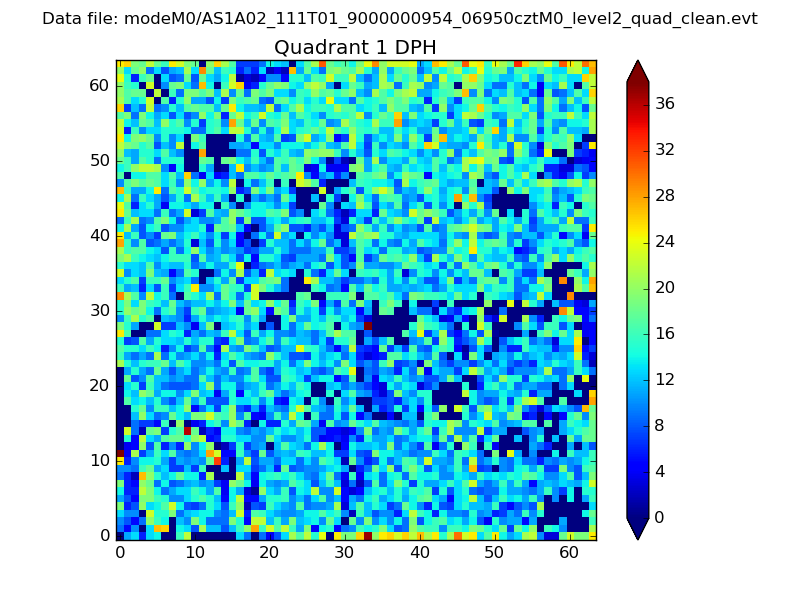 |
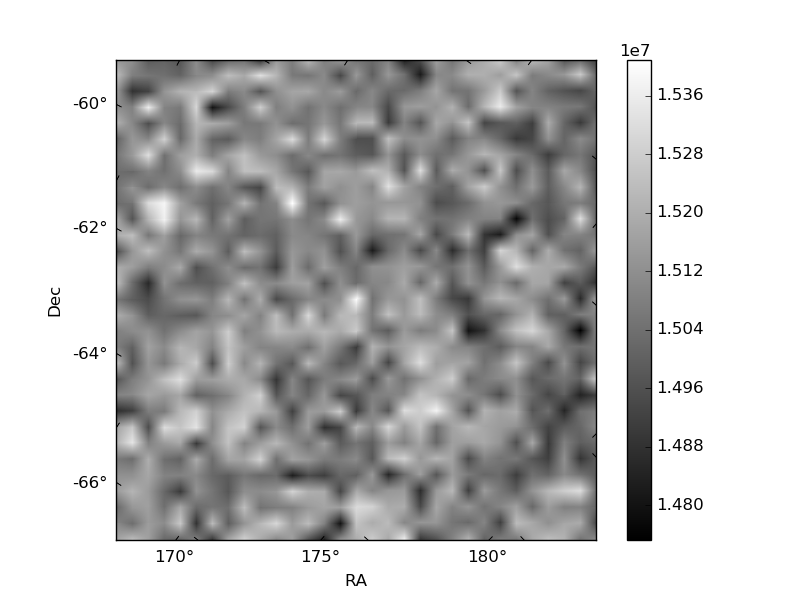
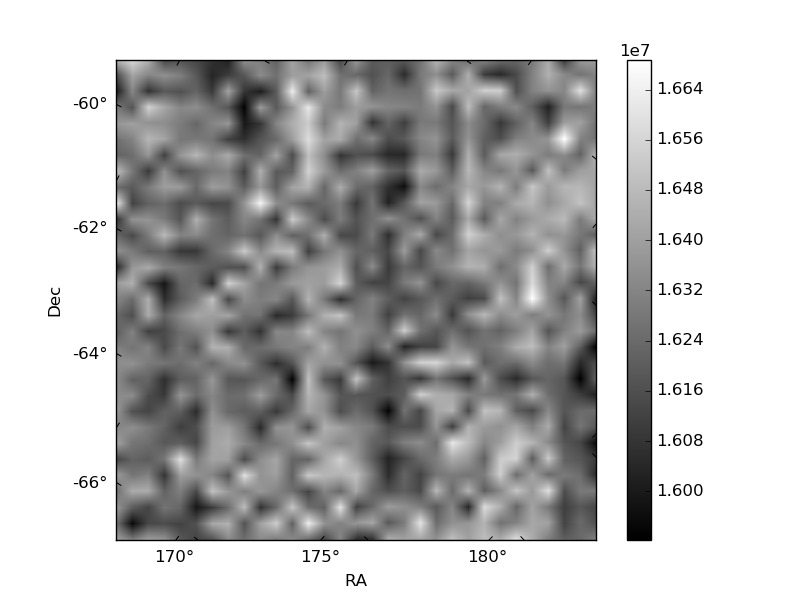
Quadrant B |
|---|---|---|---|
| Quadrant D | 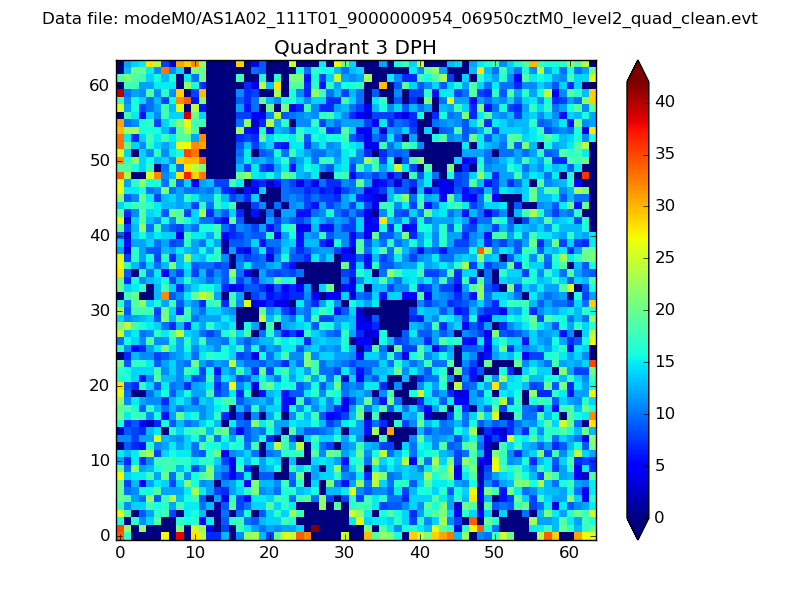 |
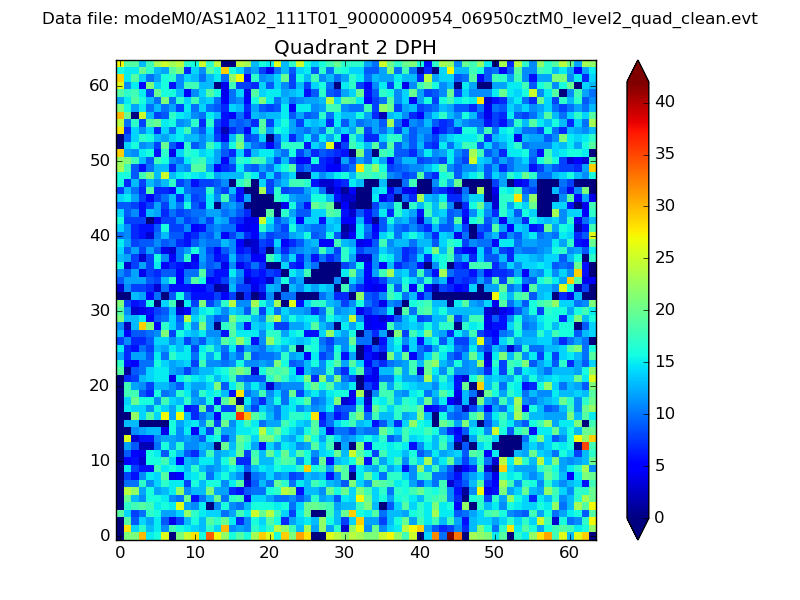 |
Quadrant C |
| Plot type | Count rate plots | Images |
|---|---|---|
| Comparison with Poisson distribution Blue bars denote a histogram of data divided into 1 sec bins. Red curve is a Poisson curve with rate = median count rate of data. |
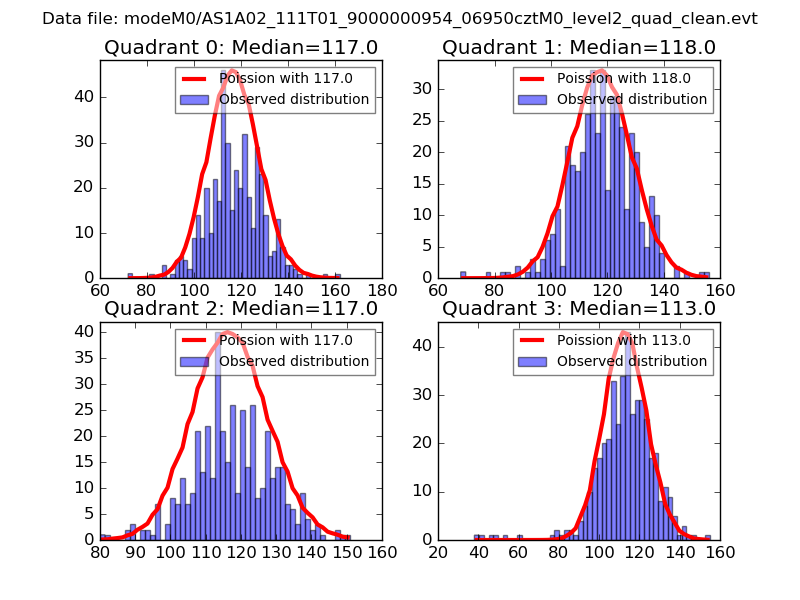 |
 |
| Quadrant-wise count rates Data is divided into 100 sec bins |
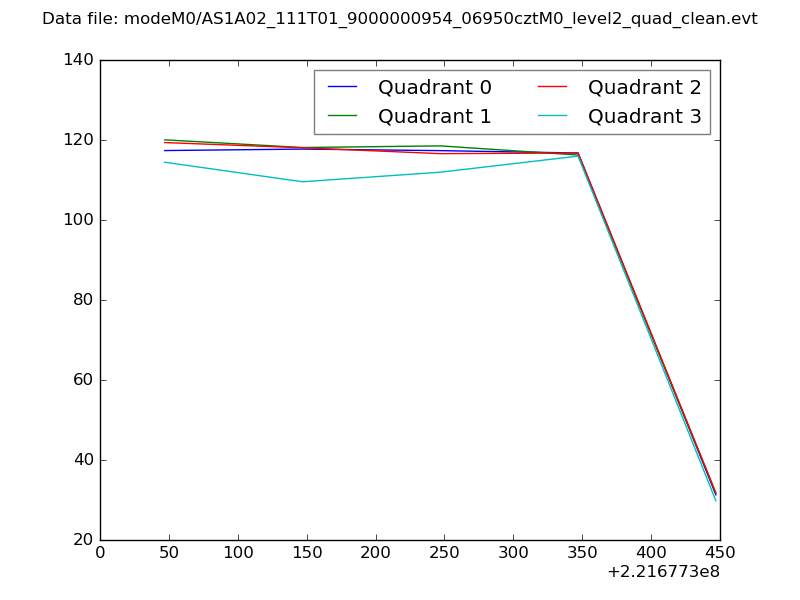 |
|
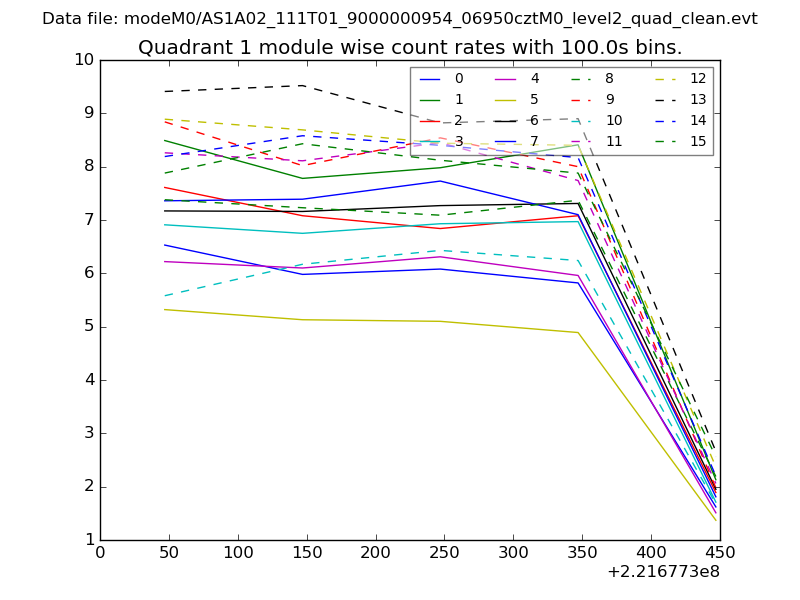
| Module-wise count rates for Quadrant A Data is divided into 100 sec bins |
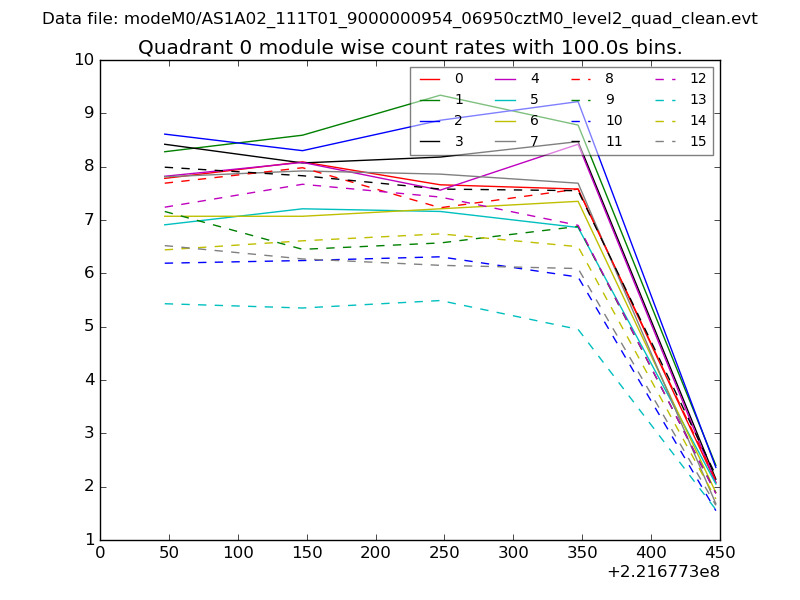 |
 |
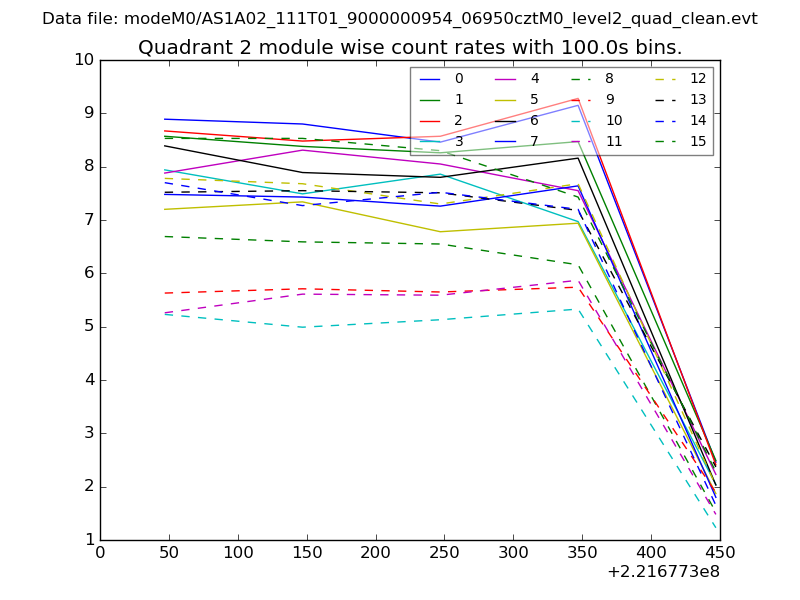
| Module-wise count rates for Quadrant B Data is divided into 100 sec bins |
 |
 |
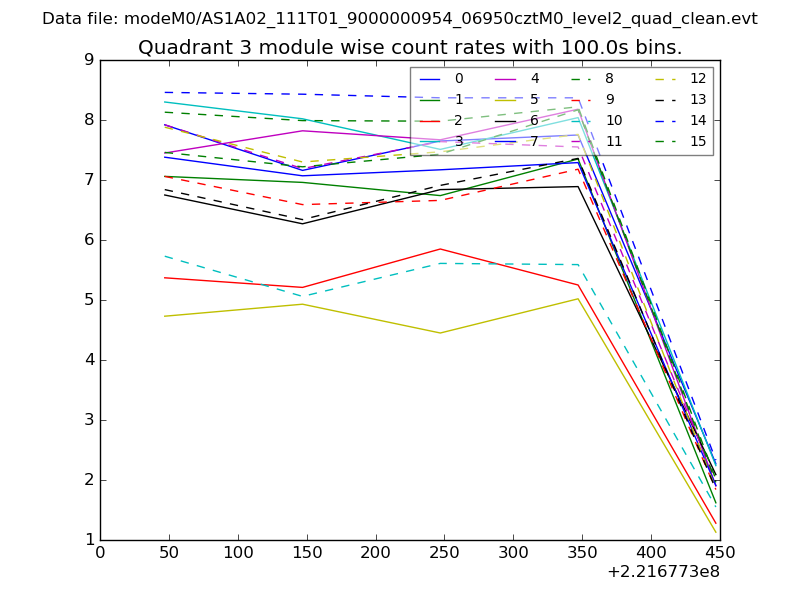
| Module-wise count rates for Quadrant C Data is divided into 100 sec bins |
 |
 |
| Module-wise count rates for Quadrant D Data is divided into 100 sec bins |
 |
 |
| Parameter | Plot |
|---|---|
| CZT HV Monitor | 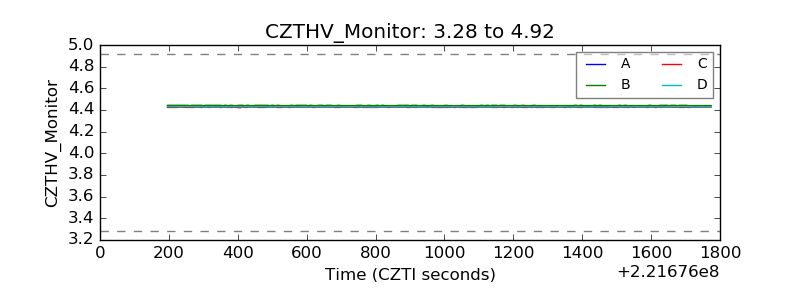 |
| D_VDD | 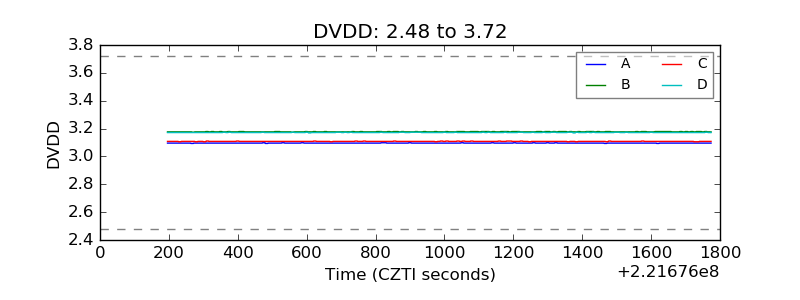 |
| Temperature 1 | 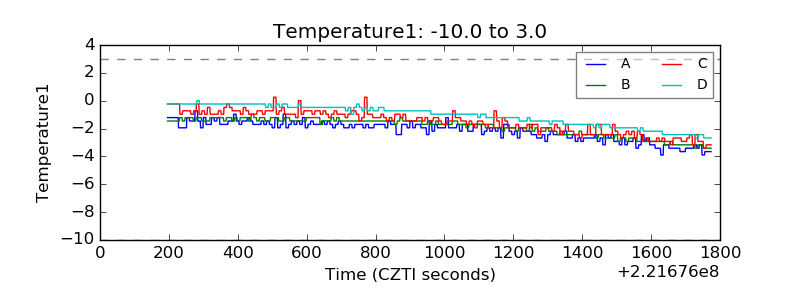 |
| Veto HV Monitor | 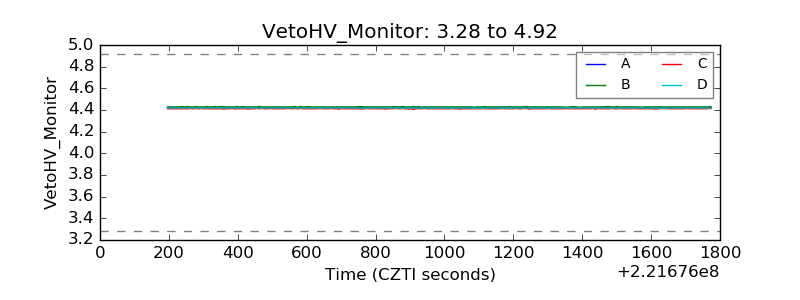 |
| Veto LLD | 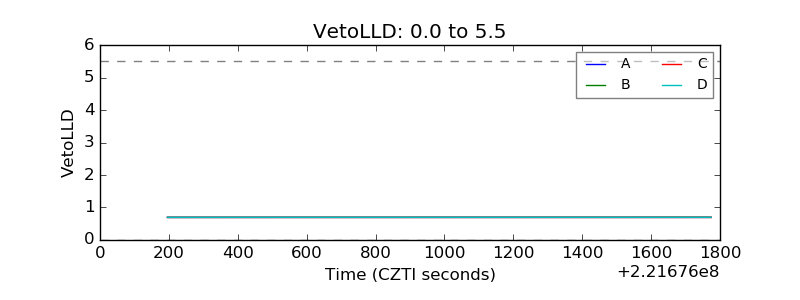 |
| Alpha Counter | 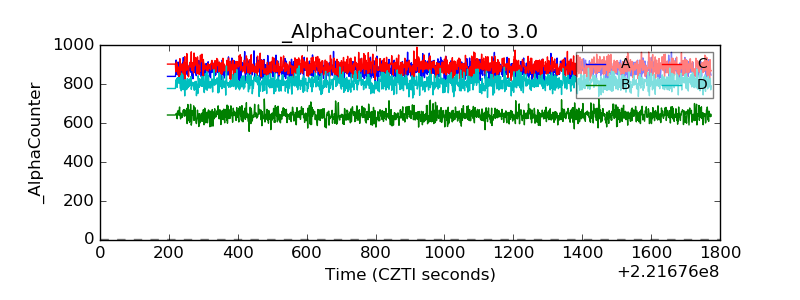 |
| _CPM_Rate | 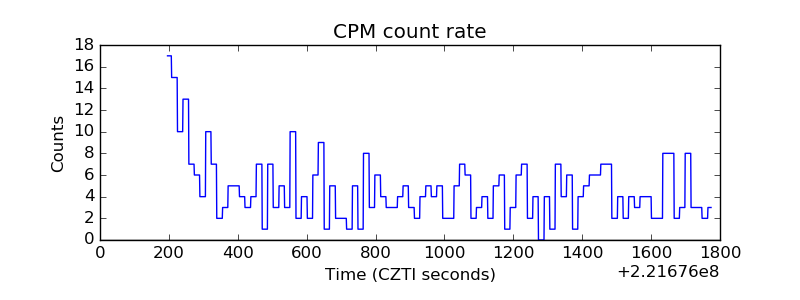 |
| CZT Counter | 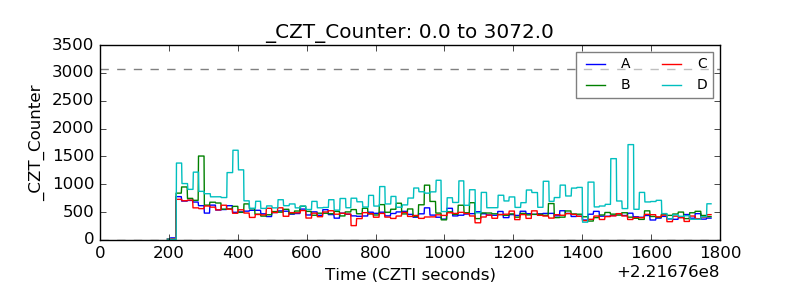 |
| +2.5 Volts monitor | 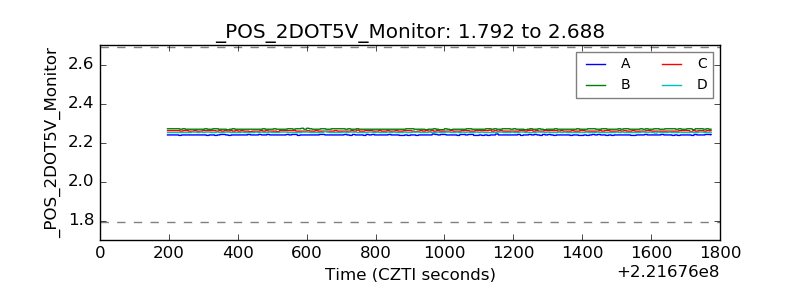 |
| +5 Volts monitor | 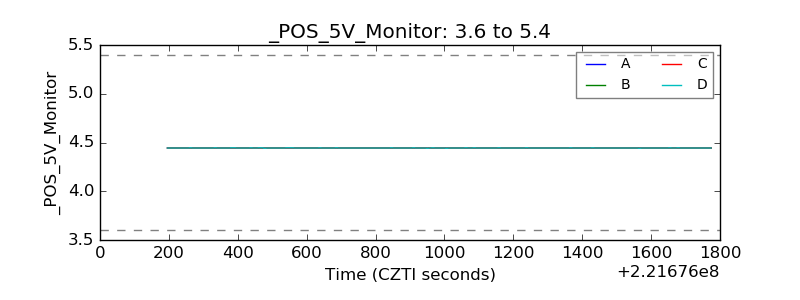 |
| _ROLL_ROT | 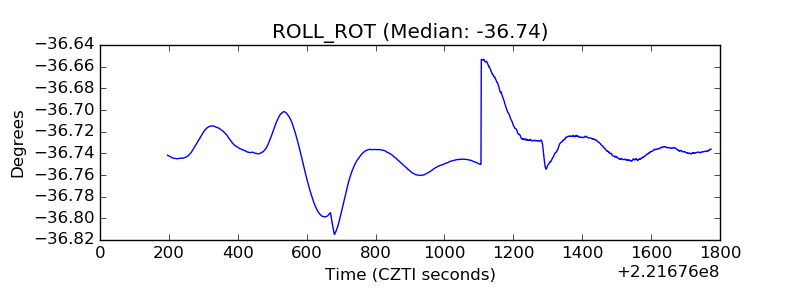 |
| _Roll_DEC | 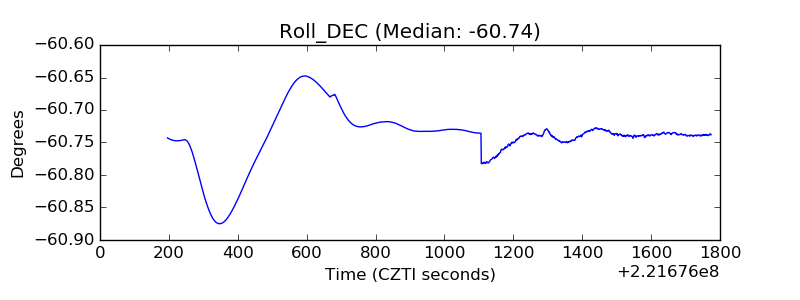 |
| _Roll_RA | 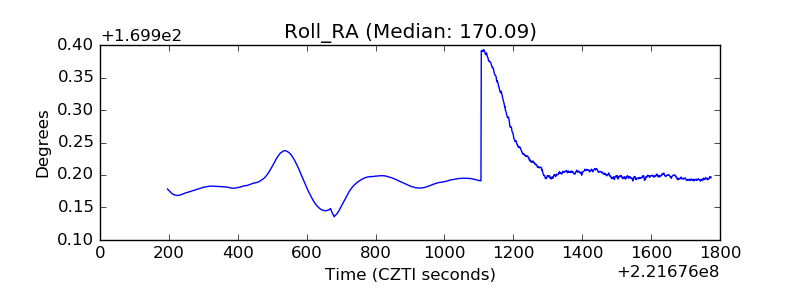 |
| Veto Counter | 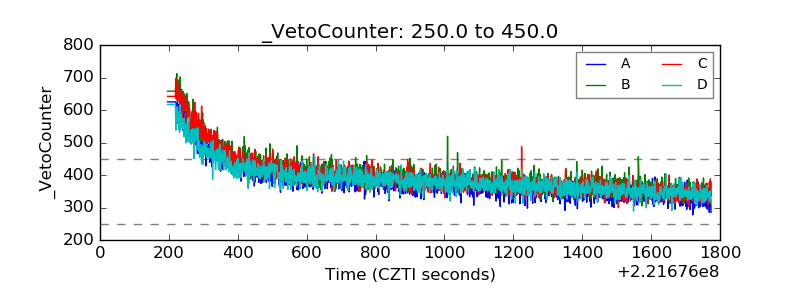 |