| Param | Original file | Final file |
|---|---|---|
| Filename | modeM0/AS1A02_111T01_9000000954_06951cztM0_level2.evt | modeM0/AS1A02_111T01_9000000954_06951cztM0_level2_quad_clean.evt |
| Size (bytes) | 506,341,440 | 91,661,760 |
| Size | 482.9 MB | 87.4 MB |
| Events in quadrant A | 3,333,413 | 574,745 |
| Events in quadrant B | 3,856,912 | 573,757 |
| Events in quadrant C | 3,319,439 | 568,433 |
| Events in quadrant D | 4,325,514 | 547,136 |
| Mode M0 | |||
|---|---|---|---|
| Quadrant | BADHDUFLAG | Total packets | Discarded packets |
| A | 0 | 15111 | 4 |
| B | 0 | 16481 | 3 |
| C | 0 | 15192 | 3 |
| D | 0 | 17997 | 3 |
| Mode M9 | |||
|---|---|---|---|
| Quadrant | BADHDUFLAG | Total packets | Discarded packets |
| A | 0 | 4 | 0 |
| B | 0 | 4 | 0 |
| C | 0 | 4 | 0 |
| D | 0 | 4 | 0 |
| Mode SS | |||
|---|---|---|---|
| Quadrant | BADHDUFLAG | Total packets | Discarded packets |
| A | 0 | 150 | 0 |
| B | 0 | 150 | 0 |
| C | 0 | 150 | 0 |
| D | 0 | 150 | 0 |
| Quadrant | Total seconds | Saturated seconds | Saturation percentage |
|---|---|---|---|
| A | 7348 | 107 | 1.456179% |
| B | 7348 | 214 | 2.912357% |
| C | 7348 | 48 | 0.653239% |
| D | 7348 | 104 | 1.415351% |
Noise dominated data is calculated using 1-second bins in cleaned event files. If a bin has >2000 counts, and if more than 50% of those come from <1% of pixels, then it is considered to be noise-dominated and hence unusable.
| Quadrant | # 1 sec bins | Bins with >0 counts | Bins with >2000 counts | High rate bins dominated by noise | Noise dominated (total time) | Noise dominated (detector-on time) | Marked lightcurve |
|---|---|---|---|---|---|---|---|
| A | 7713 | 7350 | 0 | 0 | 0.00% | 0.00% | 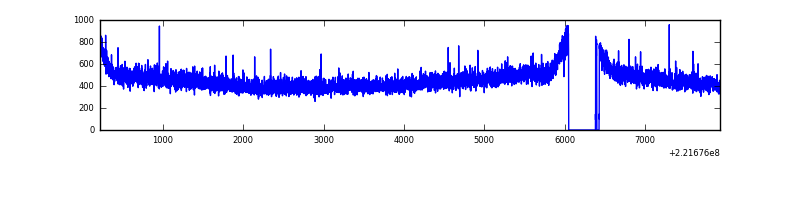 |
| B | 7713 | 7350 | 45 | 45 | 0.58% | 0.61% | 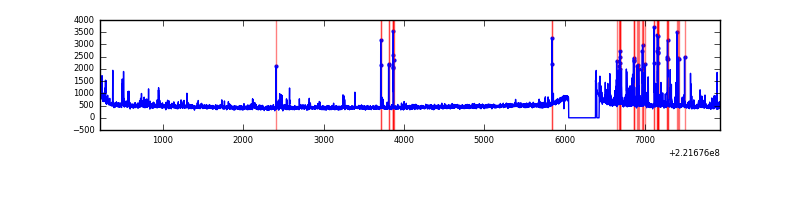 |
| C | 7713 | 7350 | 0 | 0 | 0.00% | 0.00% | 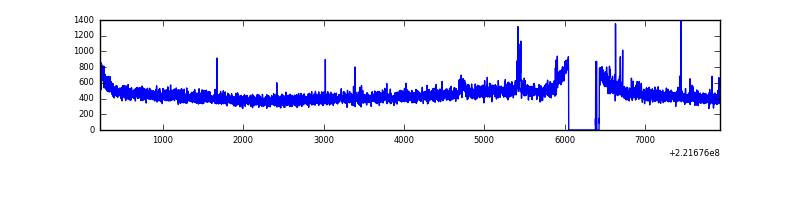 |
| D | 7713 | 7350 | 29 | 29 | 0.38% | 0.39% | 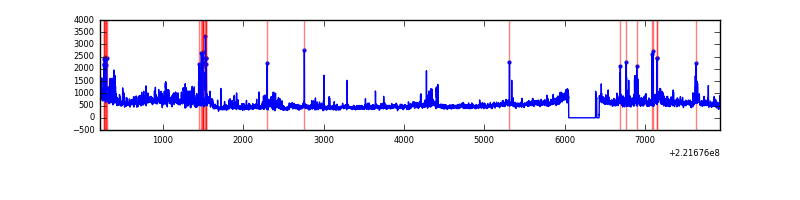 |
Top three noisy pixels from each quadrant. If the there are fewer than three noisy pixels in the level2.evt file, extra rows are filled as -1
| Pixel properties | Quadrant properties | ||||||
|---|---|---|---|---|---|---|---|
| Quadrant | DetID | PixID | Counts | Sigma | Mean | Median | Sigma |
| A | 0 | 143 | 14054 | 75.62 | 860 | 840 | 174.7 |
| A | 0 | 226 | 8339 | 42.92 | 860 | 840 | 174.7 |
| A | 12 | 194 | 7987 | 40.9 | 860 | 840 | 174.7 |
| B | 0 | 219 | 219110 | 1358.35 | 856 | 835 | 160.7 |
| B | 4 | 48 | 129646 | 801.61 | 856 | 835 | 160.7 |
| B | 0 | 245 | 66368 | 407.82 | 856 | 835 | 160.7 |
| C | 1 | 241 | 31723 | 159.85 | 833 | 836 | 193.2 |
| C | 7 | 247 | 29247 | 147.03 | 833 | 836 | 193.2 |
| C | 13 | 61 | 6649 | 30.08 | 833 | 836 | 193.2 |
| D | 8 | 195 | 451072 | 2225.12 | 831 | 804 | 202.4 |
| D | 2 | 136 | 226758 | 1116.61 | 831 | 804 | 202.4 |
| D | 2 | 152 | 182943 | 900.09 | 831 | 804 | 202.4 |
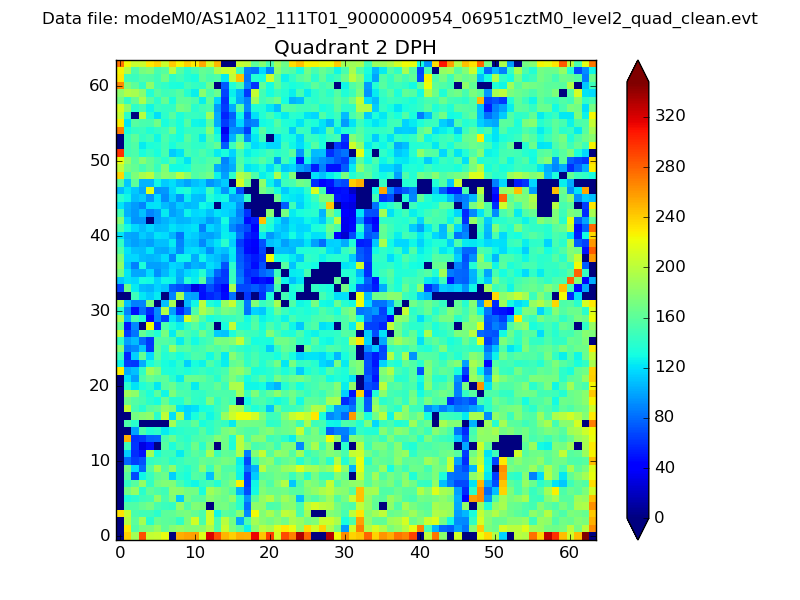
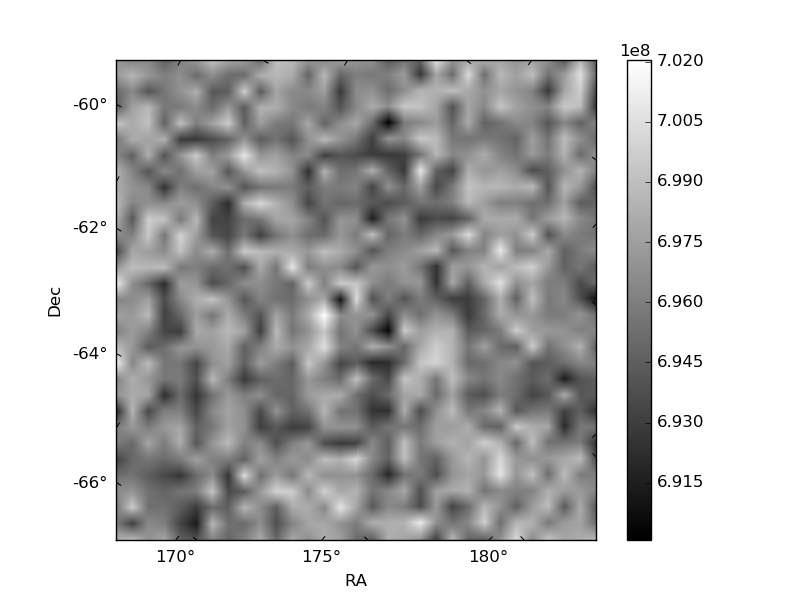
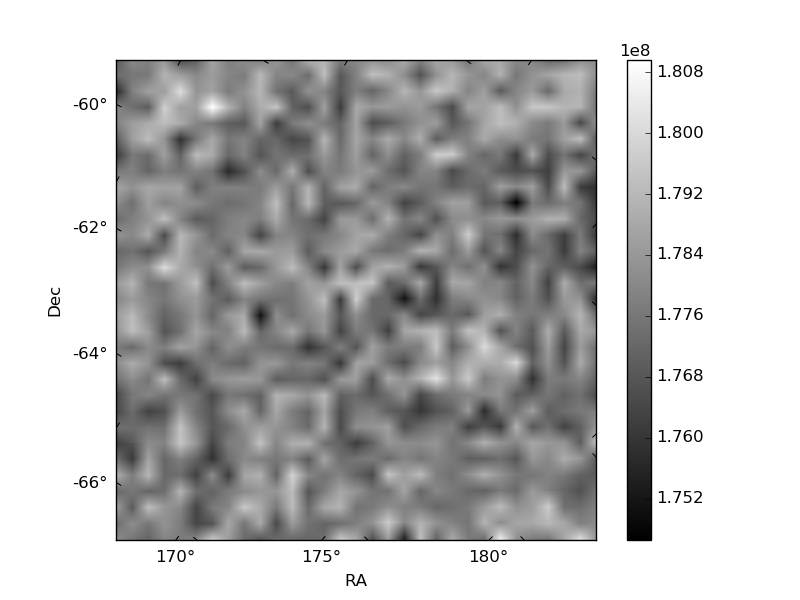
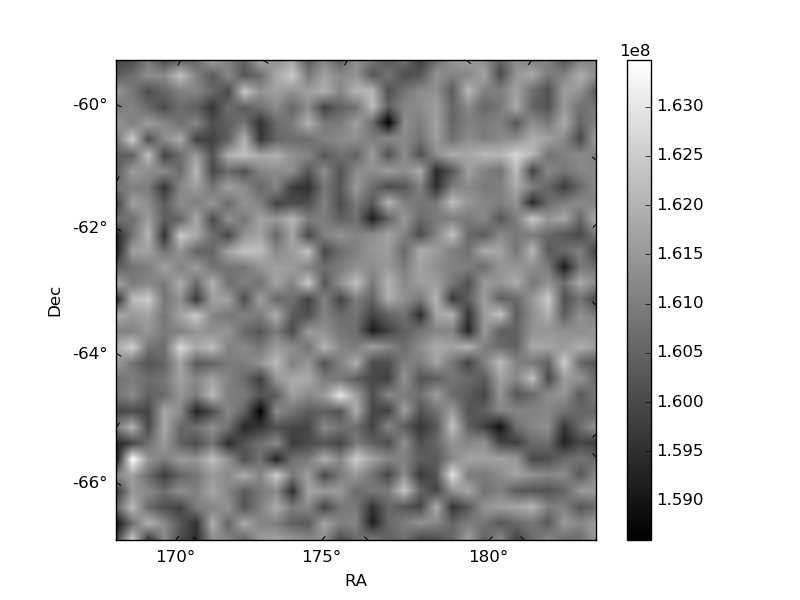
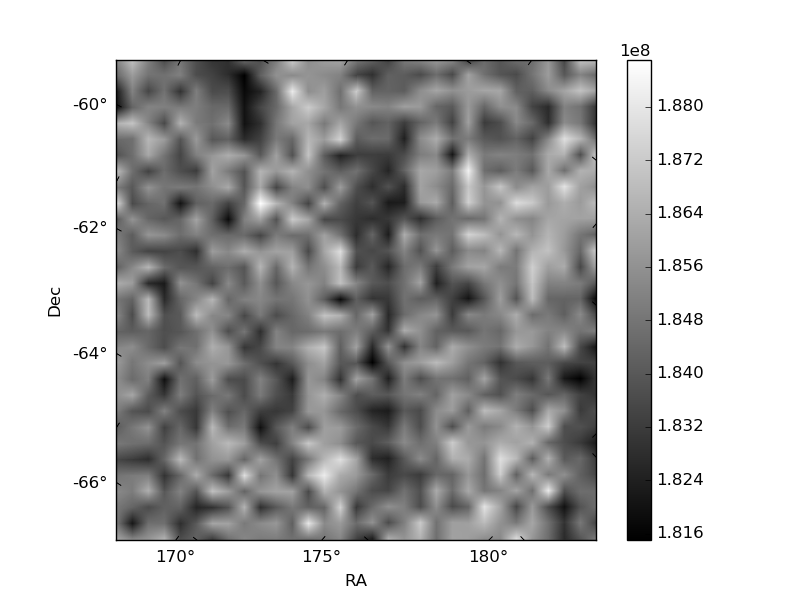
Histogram calculated using DETX and DETY for each event in the final _common_clean file
| Quadrant A | 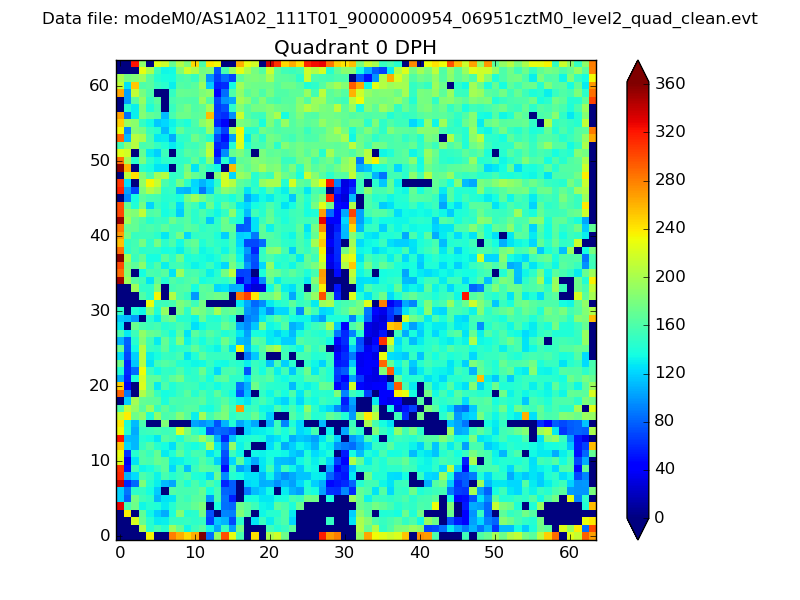 |
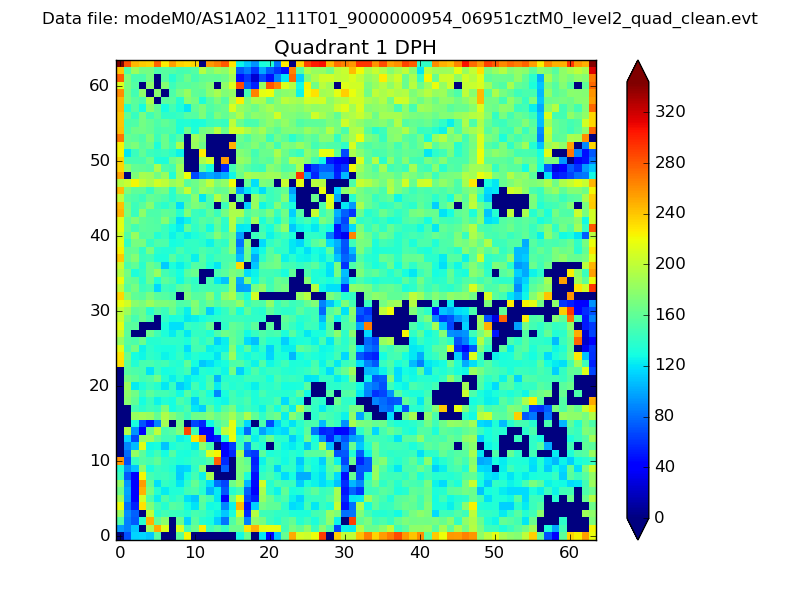 |
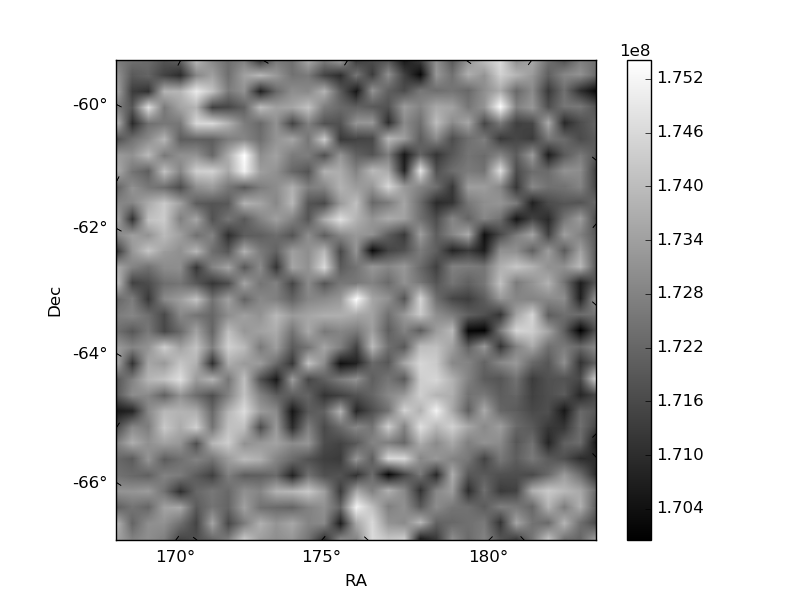
Quadrant B |
|---|---|---|---|
| Quadrant D | 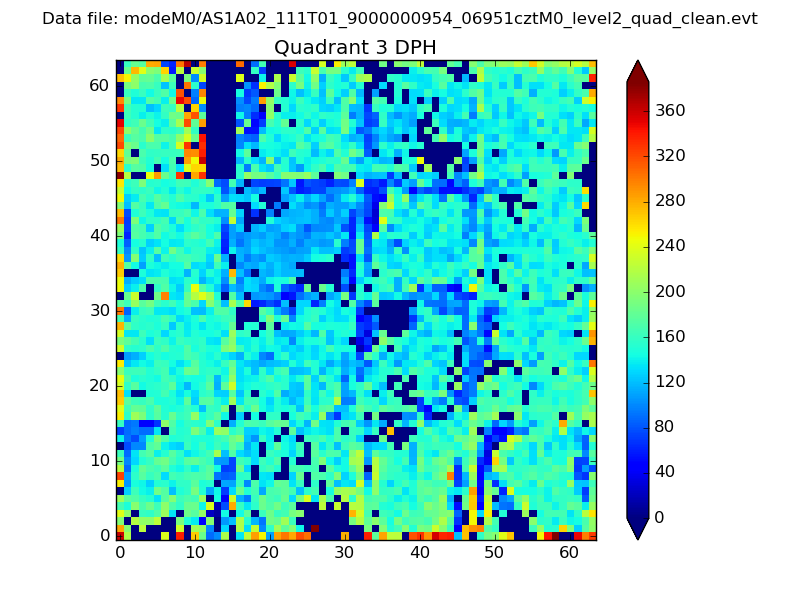 |
 |
Quadrant C |
| Plot type | Count rate plots | Images |
|---|---|---|
| Comparison with Poisson distribution Blue bars denote a histogram of data divided into 1 sec bins. Red curve is a Poisson curve with rate = median count rate of data. |
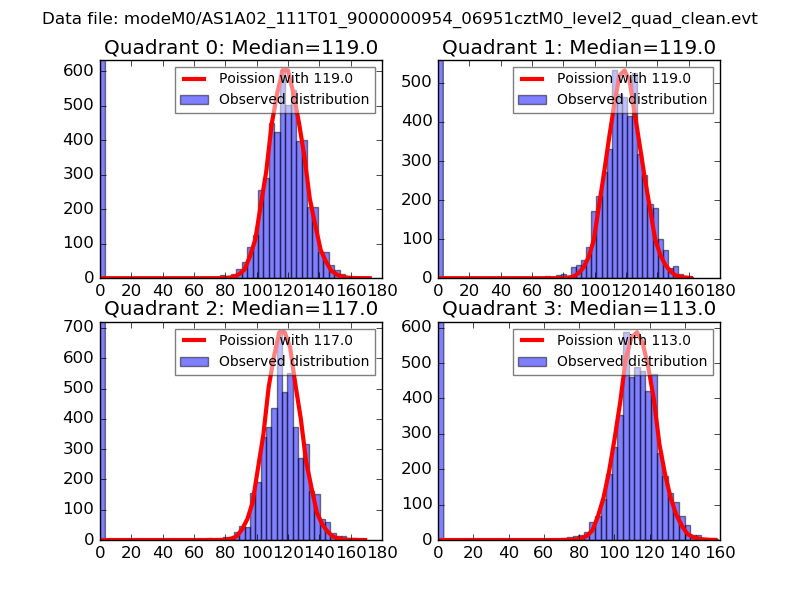 |
 |
| Quadrant-wise count rates Data is divided into 100 sec bins |
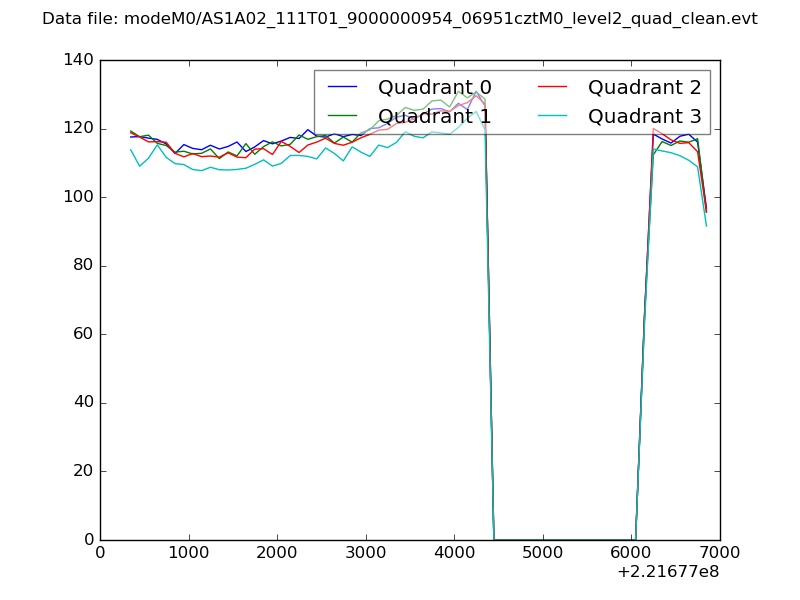 |
|
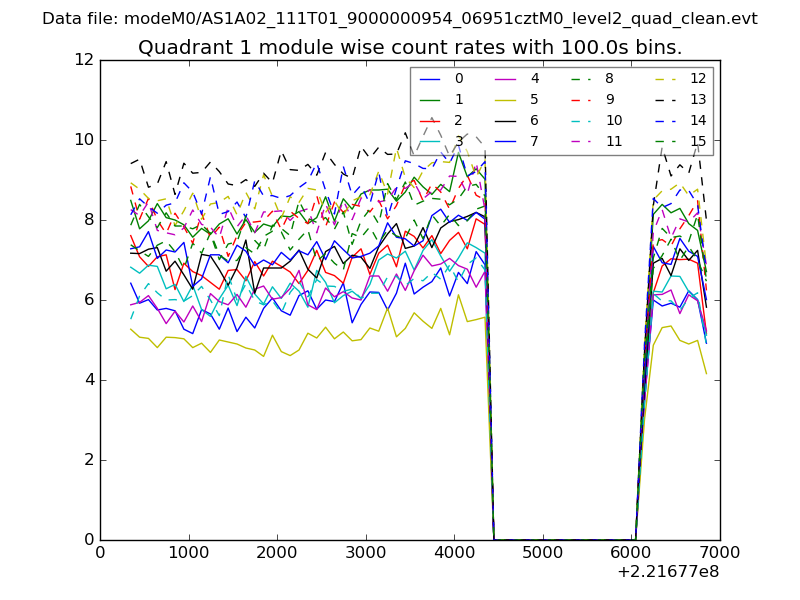
| Module-wise count rates for Quadrant A Data is divided into 100 sec bins |
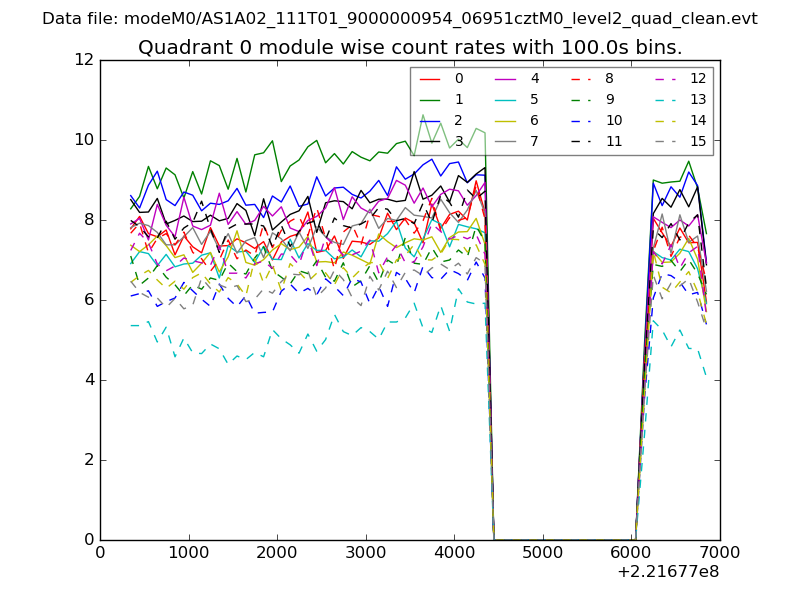 |
 |
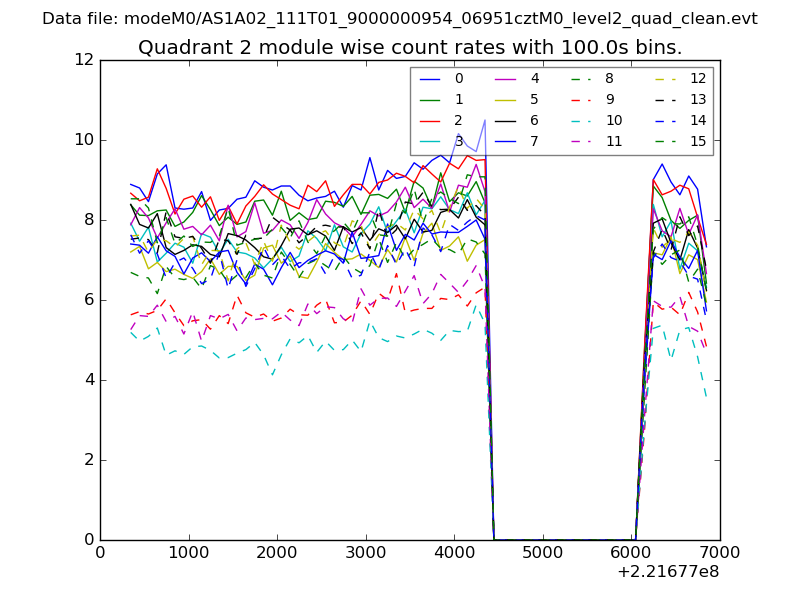
| Module-wise count rates for Quadrant B Data is divided into 100 sec bins |
 |
 |
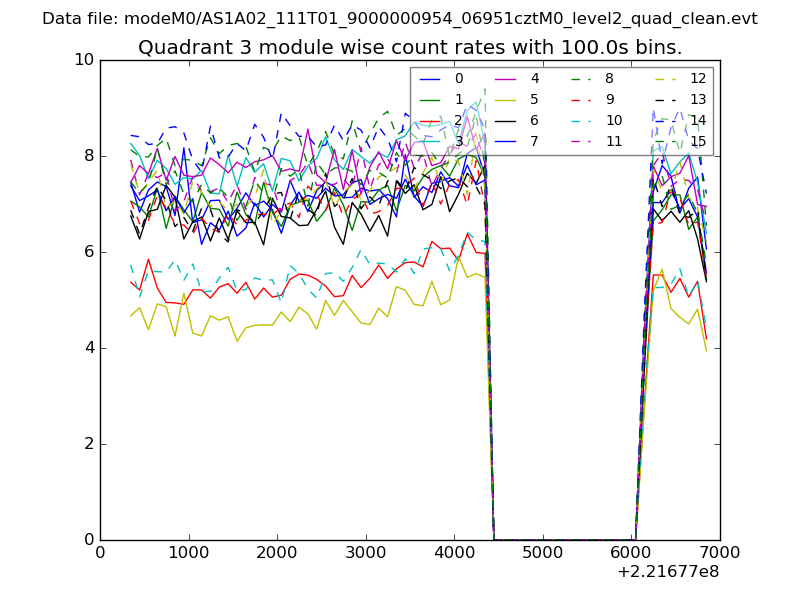
| Module-wise count rates for Quadrant C Data is divided into 100 sec bins |
 |
 |
| Module-wise count rates for Quadrant D Data is divided into 100 sec bins |
 |
 |
| Parameter | Plot |
|---|---|
| CZT HV Monitor | 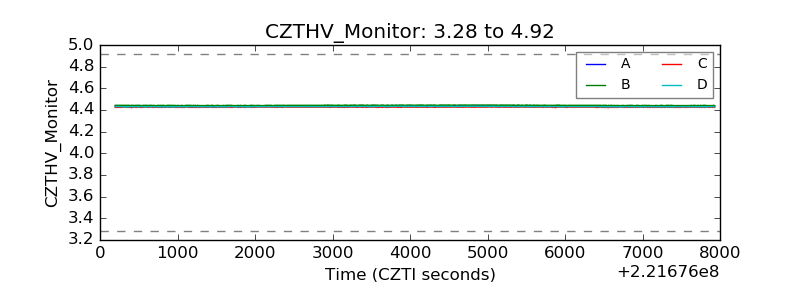 |
| D_VDD | 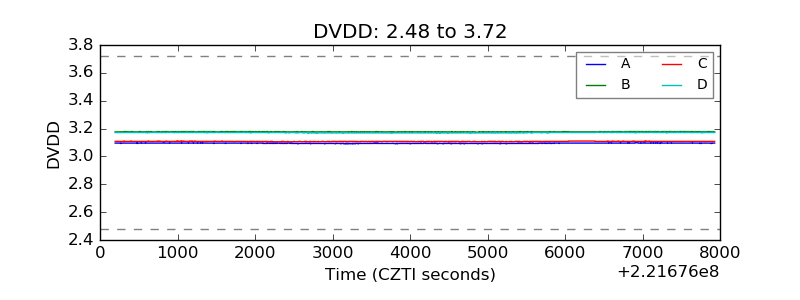 |
| Temperature 1 |  |
| Veto HV Monitor | 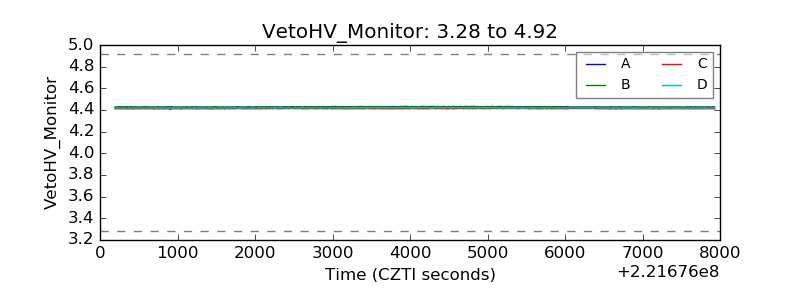 |
| Veto LLD | 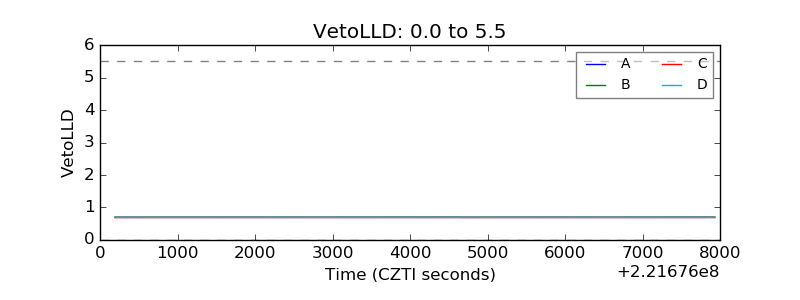 |
| Alpha Counter | 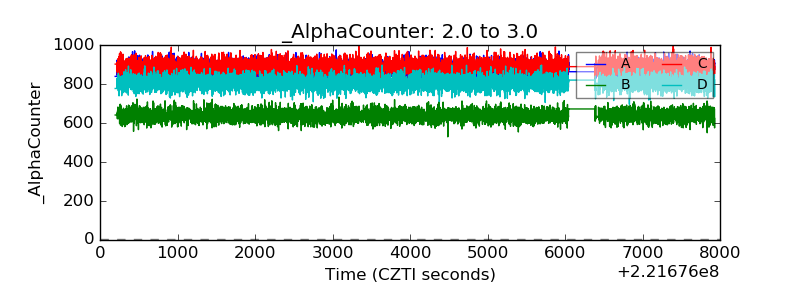 |
| _CPM_Rate | 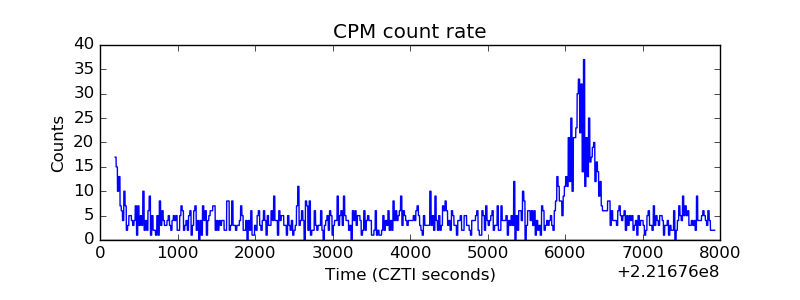 |
| CZT Counter | 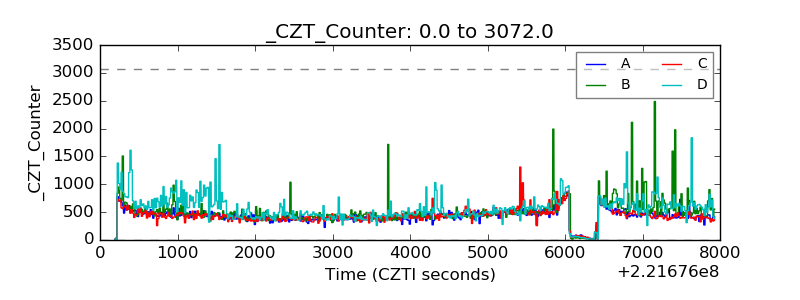 |
| +2.5 Volts monitor | 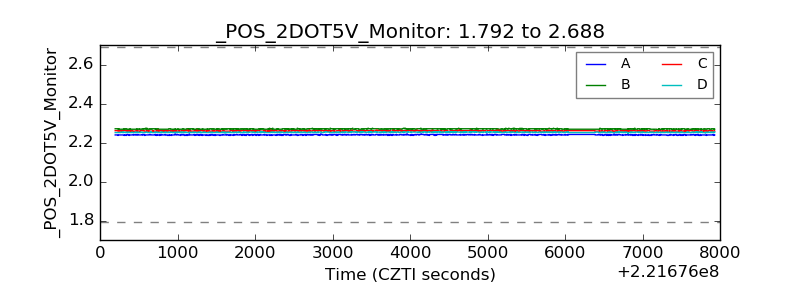 |
| +5 Volts monitor | 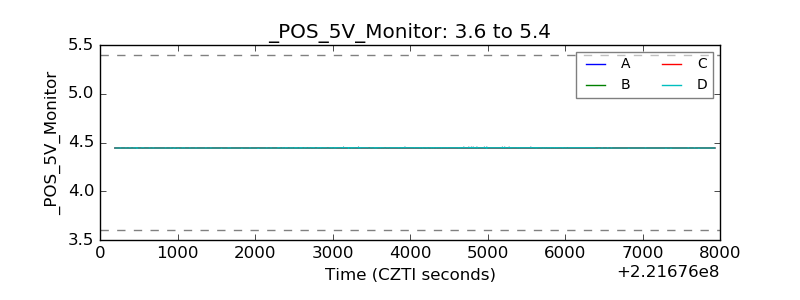 |
| _ROLL_ROT | 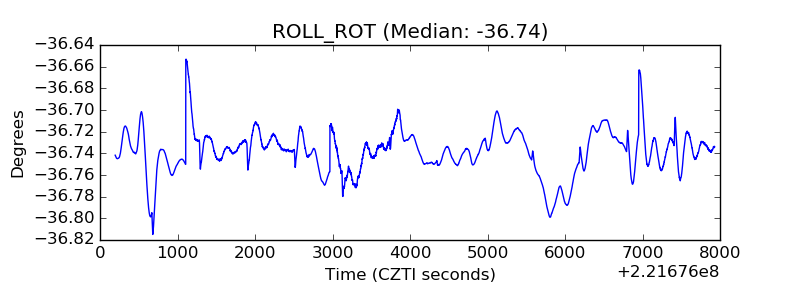 |
| _Roll_DEC | 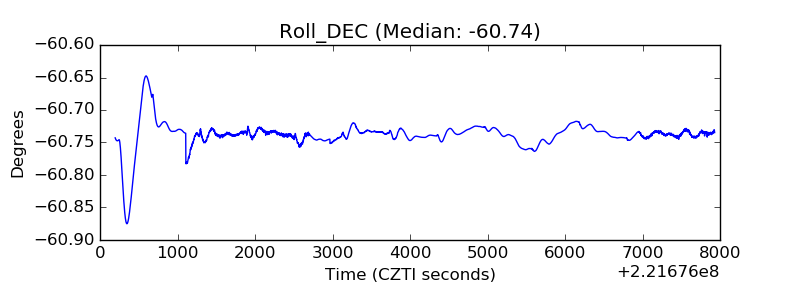 |
| _Roll_RA | 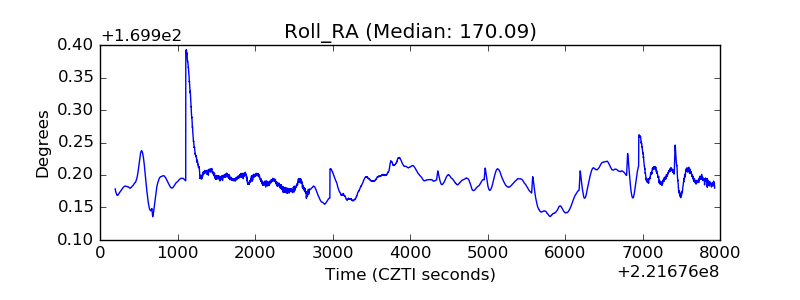 |
| Veto Counter | 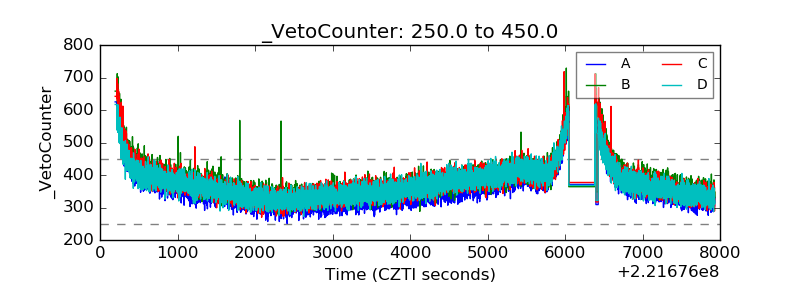 |