| Param | Original file | Final file |
|---|---|---|
| Filename | modeM0/AS1A02_111T01_9000000954_06952cztM0_level2.evt | modeM0/AS1A02_111T01_9000000954_06952cztM0_level2_quad_clean.evt |
| Size (bytes) | 538,683,840 | 99,489,600 |
| Size | 513.7 MB | 94.9 MB |
| Events in quadrant A | 3,495,375 | 627,614 |
| Events in quadrant B | 4,283,539 | 625,966 |
| Events in quadrant C | 3,443,496 | 623,188 |
| Events in quadrant D | 4,564,245 | 595,906 |
| Mode M0 | |||
|---|---|---|---|
| Quadrant | BADHDUFLAG | Total packets | Discarded packets |
| A | 0 | 15964 | 4 |
| B | 0 | 18008 | 3 |
| C | 0 | 15953 | 3 |
| D | 0 | 18875 | 3 |
| Mode M9 | |||
|---|---|---|---|
| Quadrant | BADHDUFLAG | Total packets | Discarded packets |
| A | 0 | 1 | 0 |
| B | 0 | 1 | 0 |
| C | 0 | 1 | 0 |
| D | 0 | 1 | 0 |
| Mode SS | |||
|---|---|---|---|
| Quadrant | BADHDUFLAG | Total packets | Discarded packets |
| A | 0 | 160 | 0 |
| B | 0 | 160 | 0 |
| C | 0 | 160 | 0 |
| D | 0 | 160 | 0 |
| Quadrant | Total seconds | Saturated seconds | Saturation percentage |
|---|---|---|---|
| A | 7760 | 80 | 1.030928% |
| B | 7760 | 271 | 3.492268% |
| C | 7760 | 40 | 0.515464% |
| D | 7761 | 107 | 1.378688% |
Noise dominated data is calculated using 1-second bins in cleaned event files. If a bin has >2000 counts, and if more than 50% of those come from <1% of pixels, then it is considered to be noise-dominated and hence unusable.
| Quadrant | # 1 sec bins | Bins with >0 counts | Bins with >2000 counts | High rate bins dominated by noise | Noise dominated (total time) | Noise dominated (detector-on time) | Marked lightcurve |
|---|---|---|---|---|---|---|---|
| A | 7935 | 7762 | 0 | 0 | 0.00% | 0.00% | 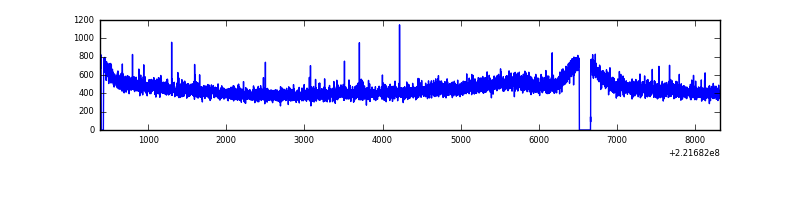 |
| B | 7935 | 7762 | 79 | 79 | 1.00% | 1.02% | 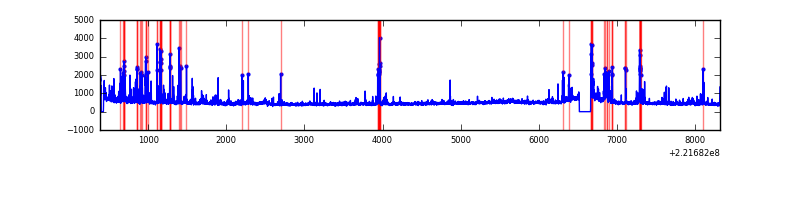 |
| C | 7935 | 7762 | 0 | 0 | 0.00% | 0.00% | 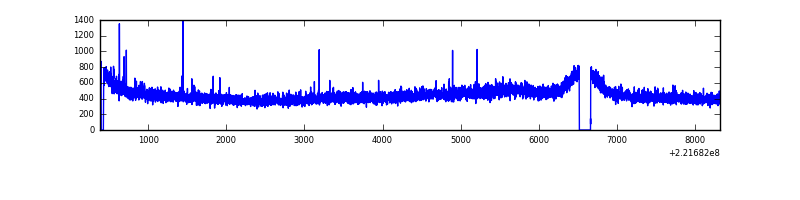 |
| D | 7936 | 7763 | 38 | 38 | 0.48% | 0.49% | 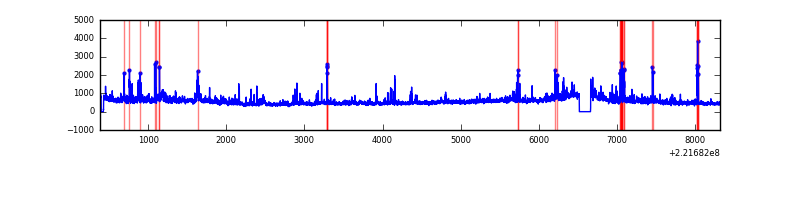 |
Top three noisy pixels from each quadrant. If the there are fewer than three noisy pixels in the level2.evt file, extra rows are filled as -1
| Pixel properties | Quadrant properties | ||||||
|---|---|---|---|---|---|---|---|
| Quadrant | DetID | PixID | Counts | Sigma | Mean | Median | Sigma |
| A | 0 | 143 | 10776 | 53.19 | 903 | 882 | 186.0 |
| A | 0 | 226 | 8856 | 42.87 | 903 | 882 | 186.0 |
| A | 12 | 194 | 8442 | 40.65 | 903 | 882 | 186.0 |
| B | 0 | 219 | 342234 | 1998.94 | 898 | 877 | 170.8 |
| B | 4 | 48 | 144399 | 840.45 | 898 | 877 | 170.8 |
| B | 4 | 81 | 121153 | 704.32 | 898 | 877 | 170.8 |
| C | 7 | 247 | 26208 | 124.8 | 875 | 877 | 203.0 |
| C | 13 | 61 | 6971 | 30.02 | 875 | 877 | 203.0 |
| C | 12 | 4 | 4719 | 18.93 | 875 | 877 | 203.0 |
| D | 8 | 195 | 601017 | 2790.22 | 871 | 843 | 215.1 |
| D | 2 | 136 | 172506 | 798.06 | 871 | 843 | 215.1 |
| D | 14 | 34 | 149227 | 689.84 | 871 | 843 | 215.1 |
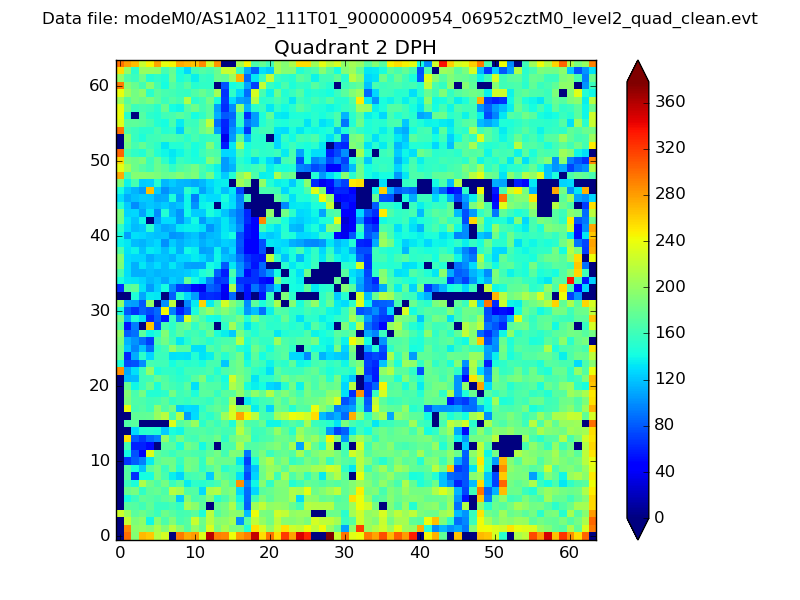
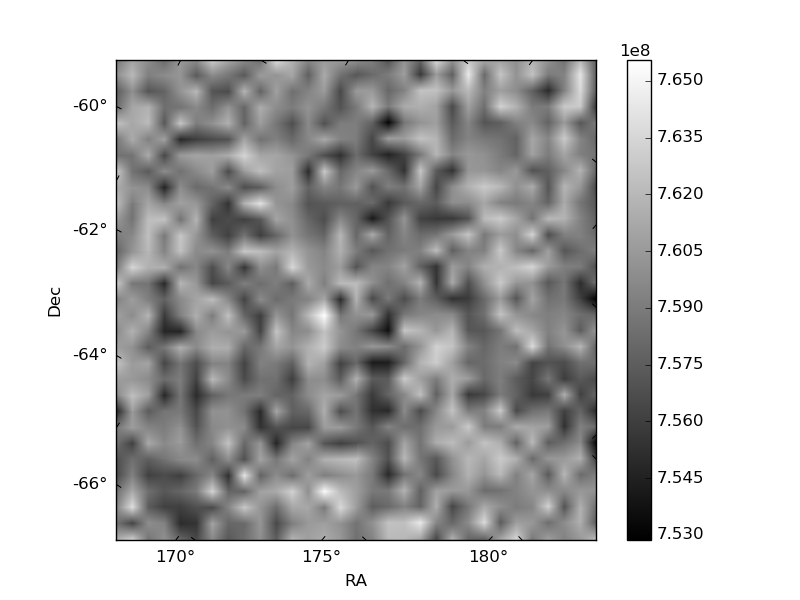
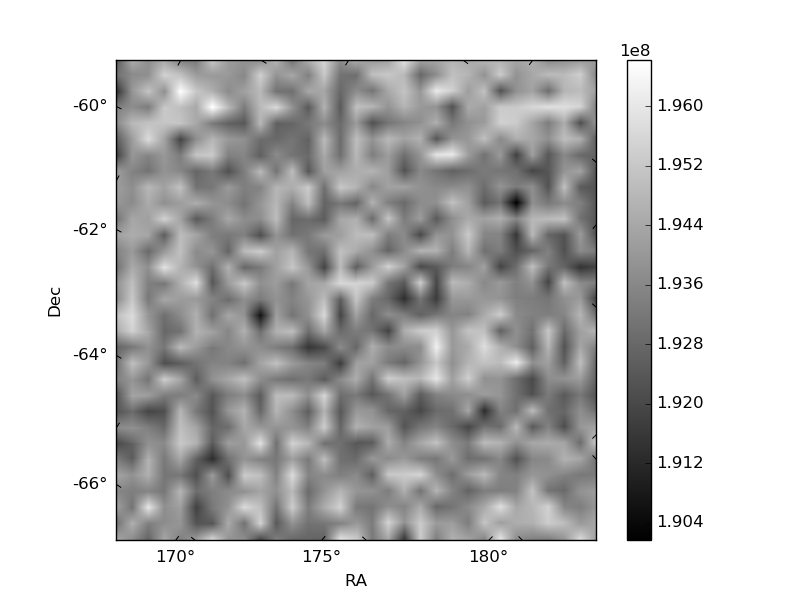
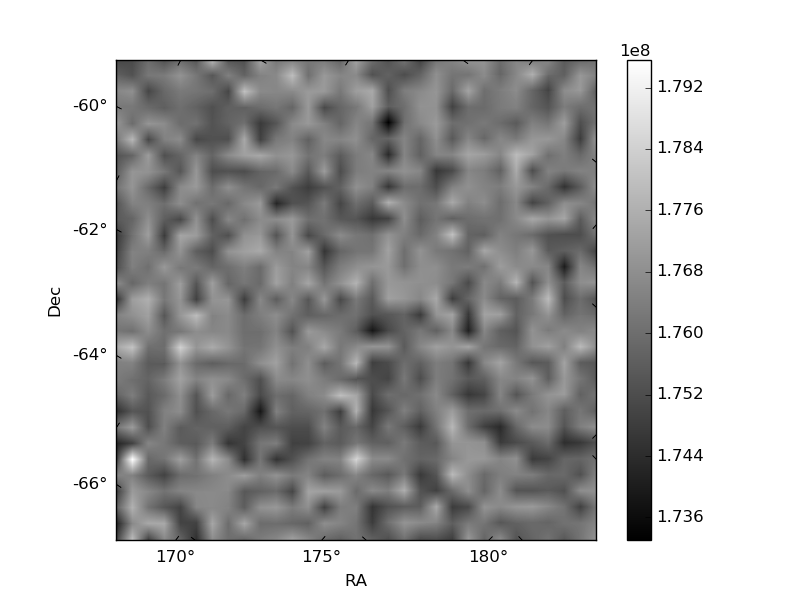
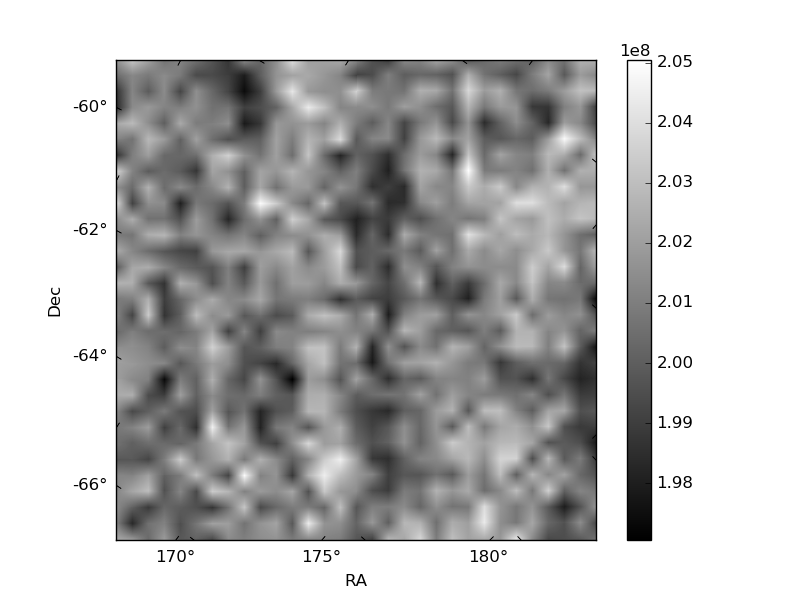
Histogram calculated using DETX and DETY for each event in the final _common_clean file
| Quadrant A | 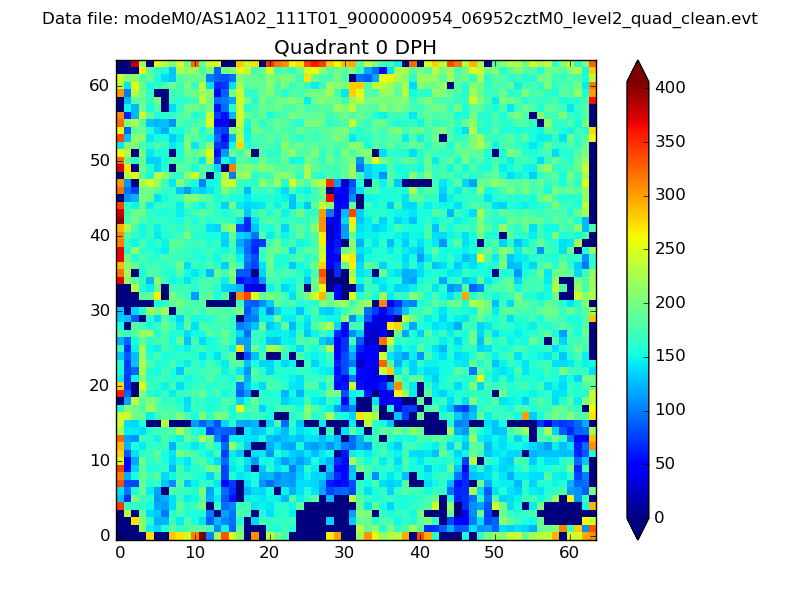 |
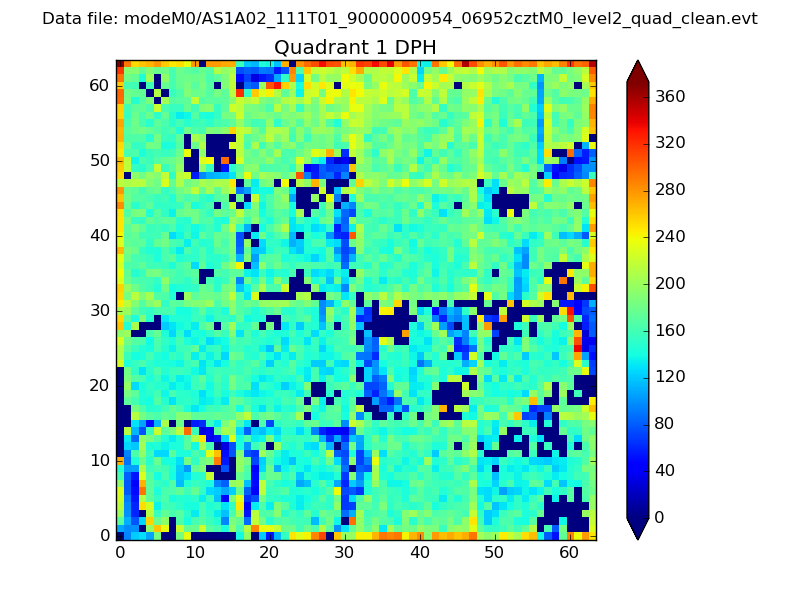 |
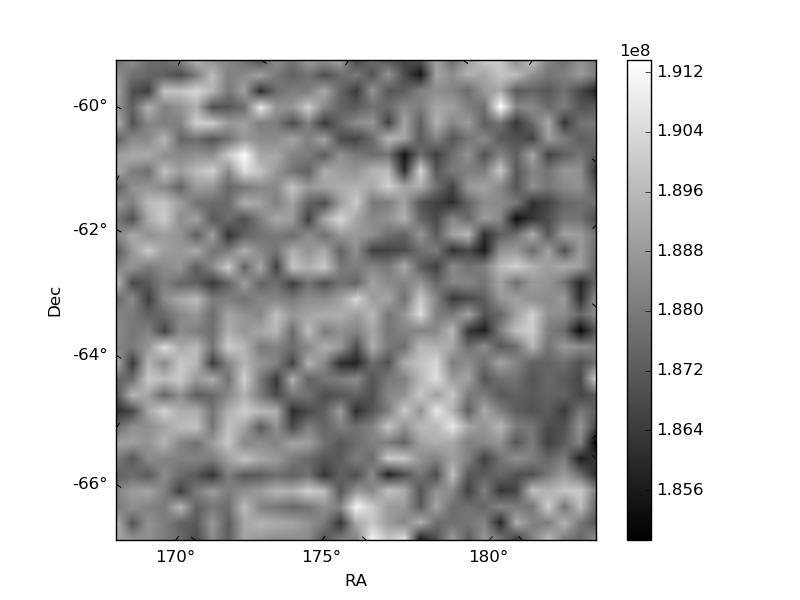
Quadrant B |
|---|---|---|---|
| Quadrant D | 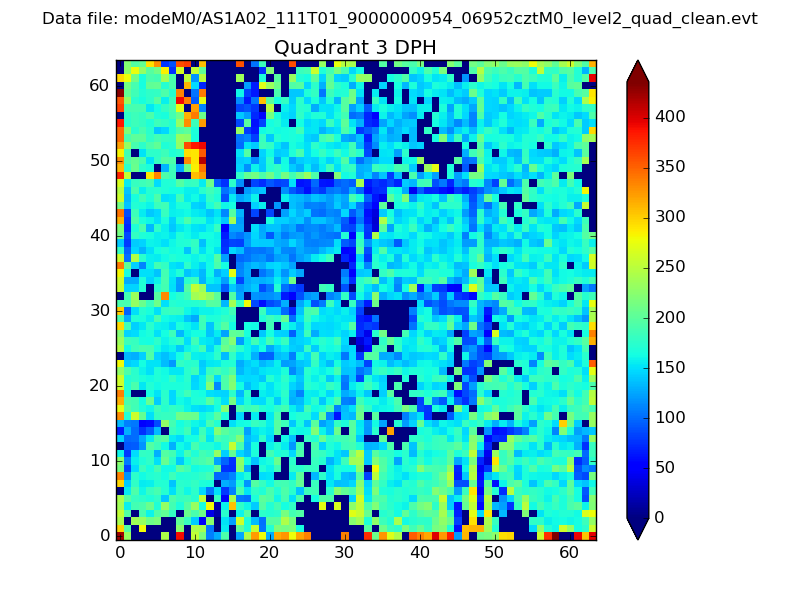 |
 |
Quadrant C |
| Plot type | Count rate plots | Images |
|---|---|---|
| Comparison with Poisson distribution Blue bars denote a histogram of data divided into 1 sec bins. Red curve is a Poisson curve with rate = median count rate of data. |
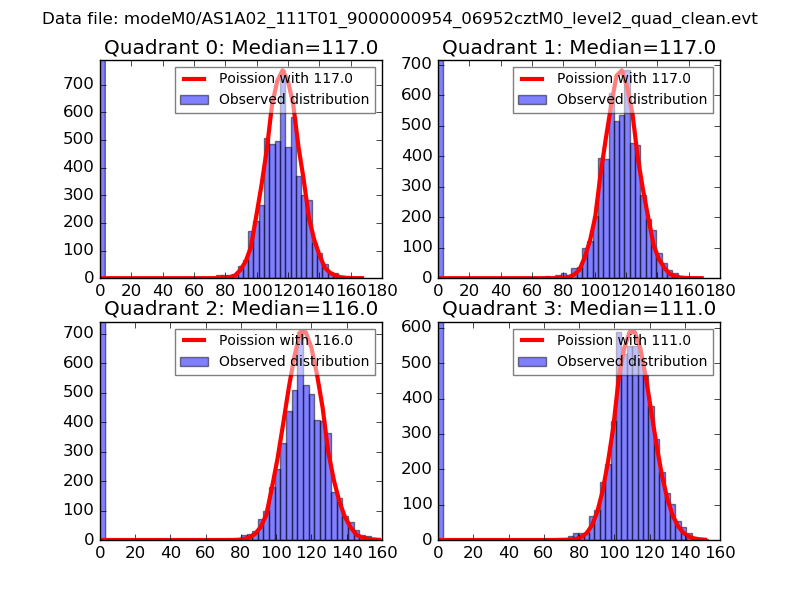 |
 |
| Quadrant-wise count rates Data is divided into 100 sec bins |
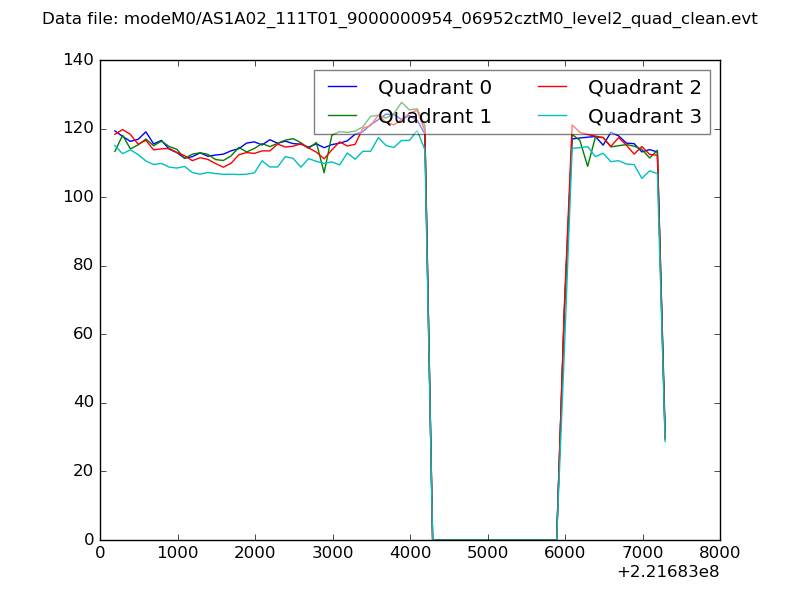 |
|
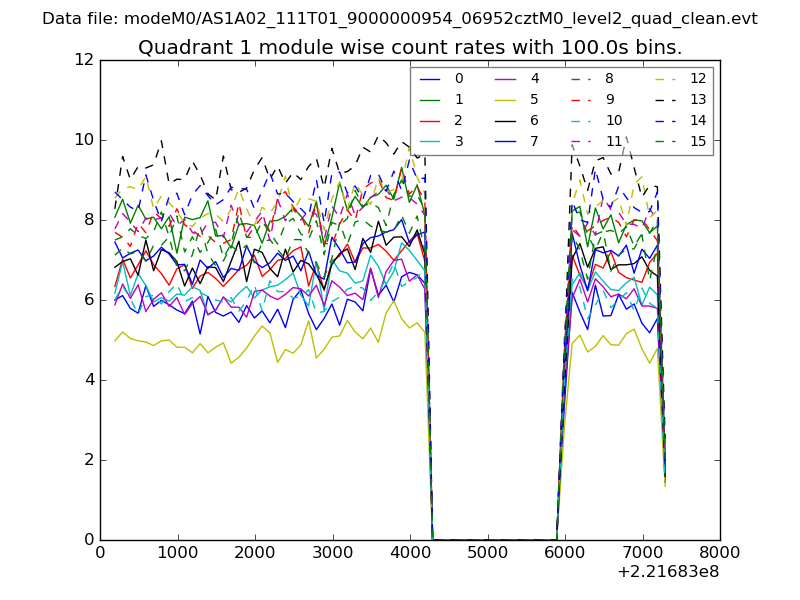
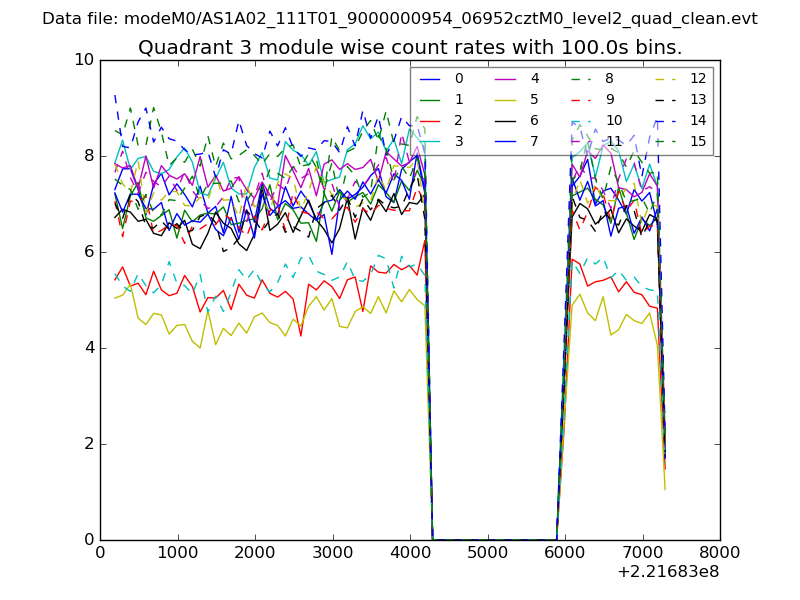
| Module-wise count rates for Quadrant A Data is divided into 100 sec bins |
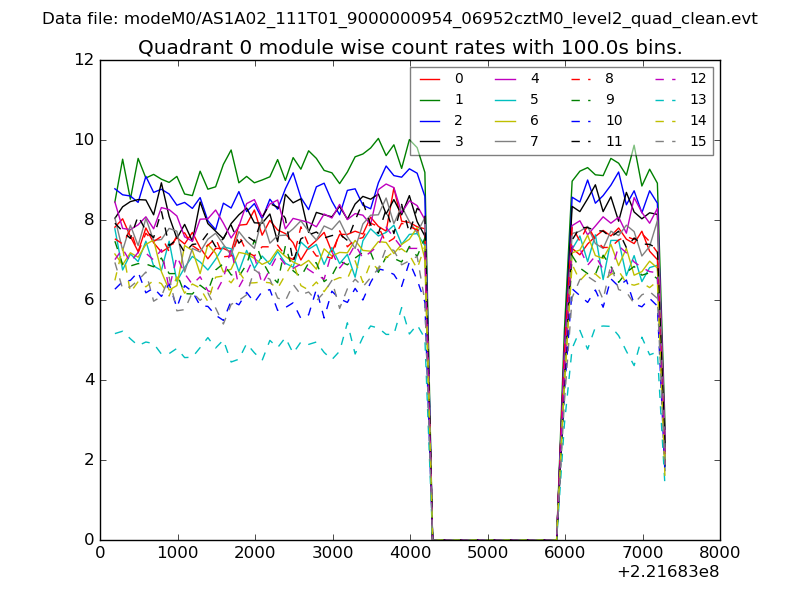 |
 |
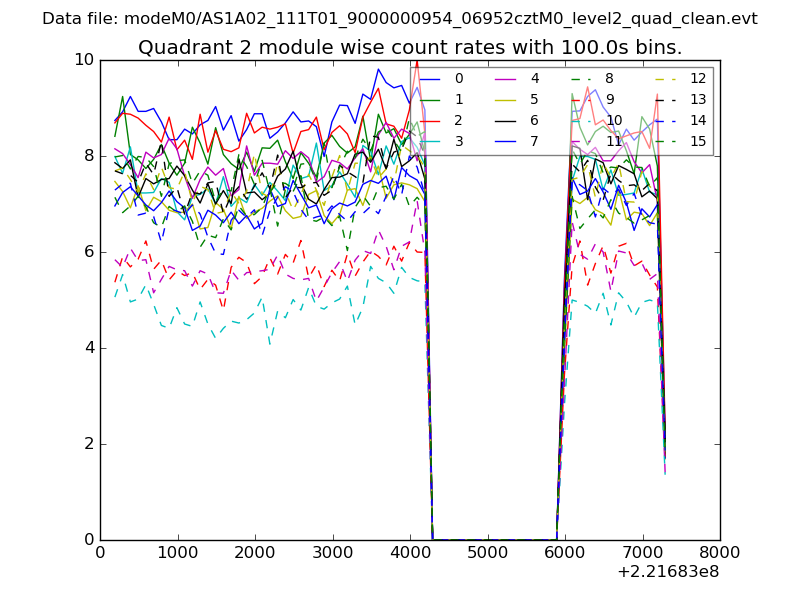
| Module-wise count rates for Quadrant B Data is divided into 100 sec bins |
 |
 |
| Module-wise count rates for Quadrant C Data is divided into 100 sec bins |
 |
 |
| Module-wise count rates for Quadrant D Data is divided into 100 sec bins |
 |
 |
| Parameter | Plot |
|---|---|
| CZT HV Monitor | 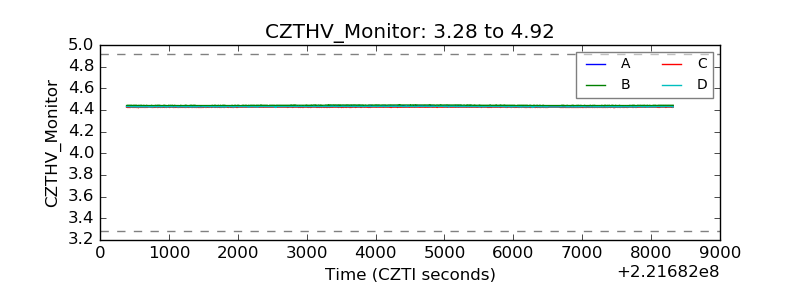 |
| D_VDD | 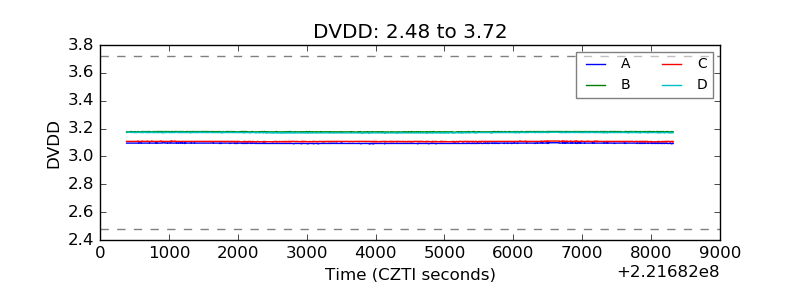 |
| Temperature 1 | 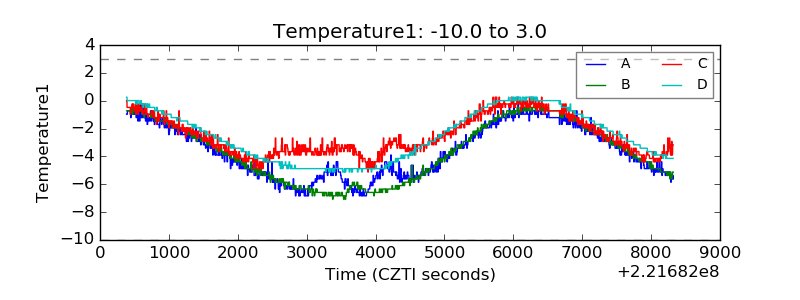 |
| Veto HV Monitor | 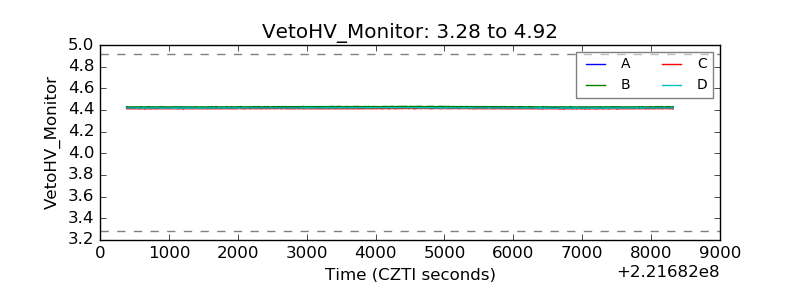 |
| Veto LLD | 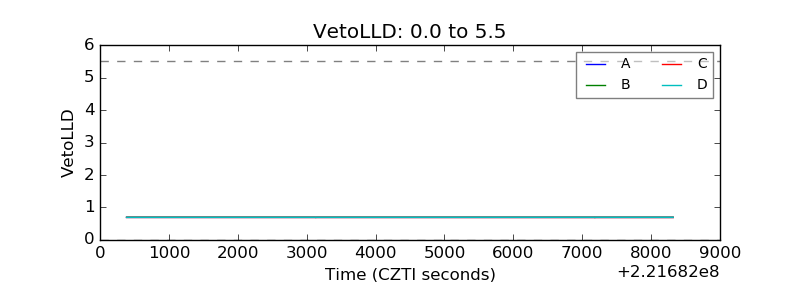 |
| Alpha Counter | 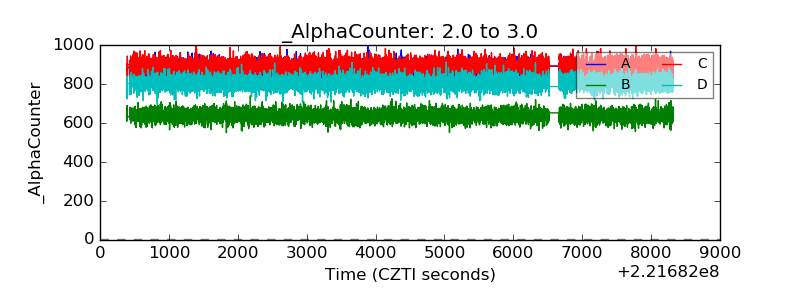 |
| _CPM_Rate | 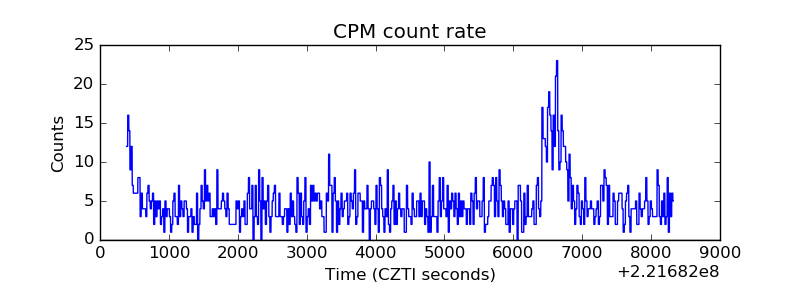 |
| CZT Counter | 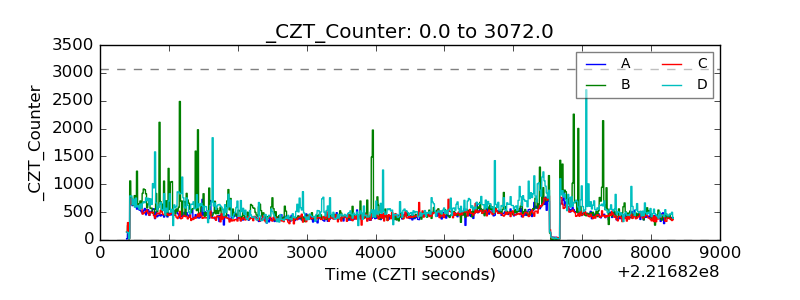 |
| +2.5 Volts monitor | 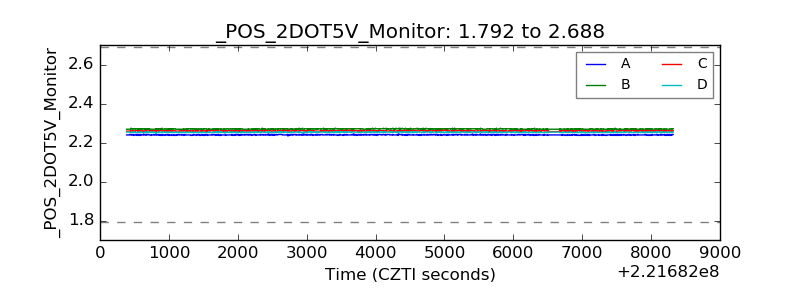 |
| +5 Volts monitor | 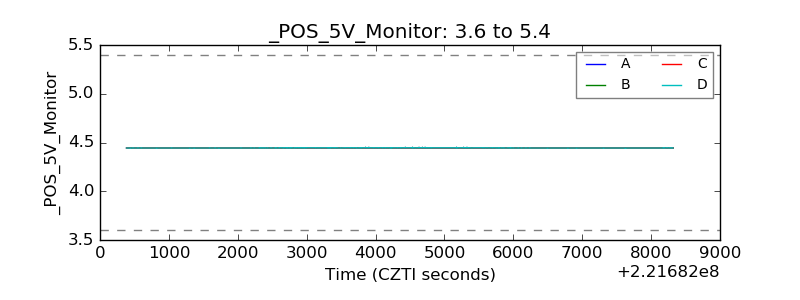 |
| _ROLL_ROT | 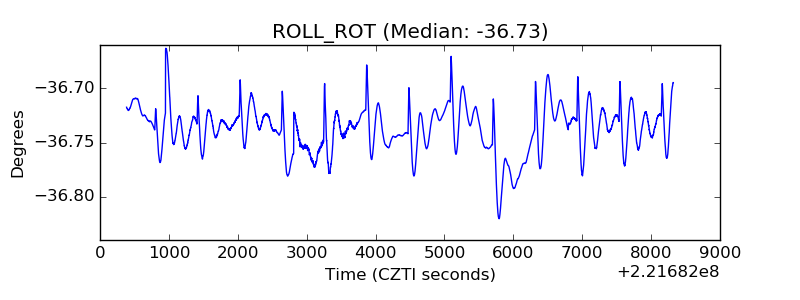 |
| _Roll_DEC | 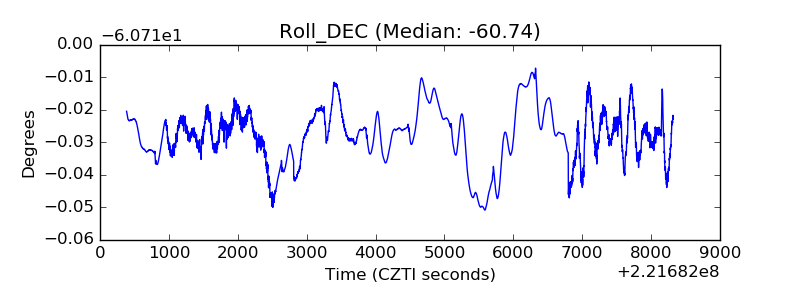 |
| _Roll_RA | 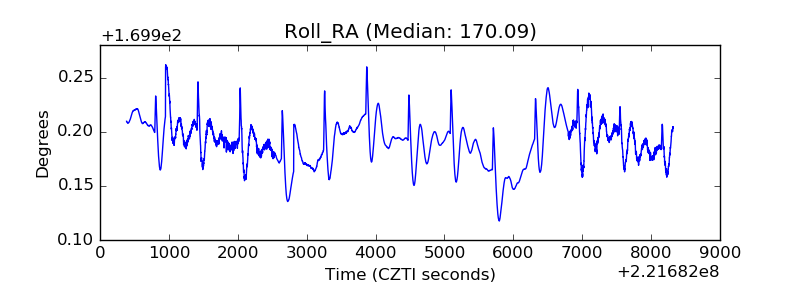 |
| Veto Counter | 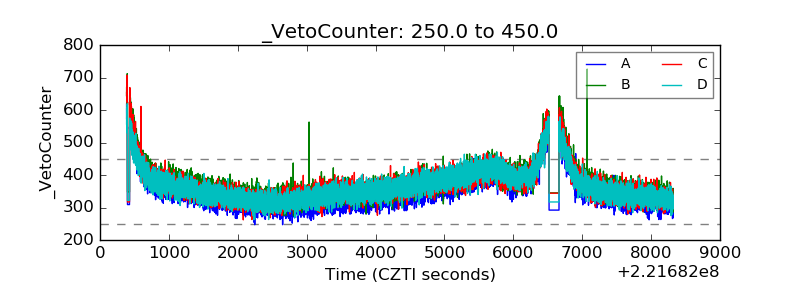 |