| Param | Original file | Final file |
|---|---|---|
| Filename | modeM0/AS1A02_111T01_9000000954_06953cztM0_level2.evt | modeM0/AS1A02_111T01_9000000954_06953cztM0_level2_quad_clean.evt |
| Size (bytes) | 255,214,080 | 63,233,280 |
| Size | 243.4 MB | 60.3 MB |
| Events in quadrant A | 1,671,885 | 415,470 |
| Events in quadrant B | 2,025,509 | 414,266 |
| Events in quadrant C | 1,661,074 | 412,348 |
| Events in quadrant D | 2,097,790 | 391,368 |
| Mode M0 | |||
|---|---|---|---|
| Quadrant | BADHDUFLAG | Total packets | Discarded packets |
| A | 0 | 8094 | 2 |
| B | 0 | 8961 | 1 |
| C | 0 | 8089 | 1 |
| D | 0 | 8906 | 1 |
| Mode SS | |||
|---|---|---|---|
| Quadrant | BADHDUFLAG | Total packets | Discarded packets |
| A | 0 | 80 | 0 |
| B | 0 | 80 | 0 |
| C | 0 | 80 | 0 |
| D | 0 | 80 | 0 |
| Quadrant | Total seconds | Saturated seconds | Saturation percentage |
|---|---|---|---|
| A | 3985 | 14 | 0.351317% |
| B | 3985 | 113 | 2.835634% |
| C | 3985 | 8 | 0.200753% |
| D | 3986 | 48 | 1.204215% |
Noise dominated data is calculated using 1-second bins in cleaned event files. If a bin has >2000 counts, and if more than 50% of those come from <1% of pixels, then it is considered to be noise-dominated and hence unusable.
| Quadrant | # 1 sec bins | Bins with >0 counts | Bins with >2000 counts | High rate bins dominated by noise | Noise dominated (total time) | Noise dominated (detector-on time) | Marked lightcurve |
|---|---|---|---|---|---|---|---|
| A | 3985 | 3985 | 0 | 0 | 0.00% | 0.00% | 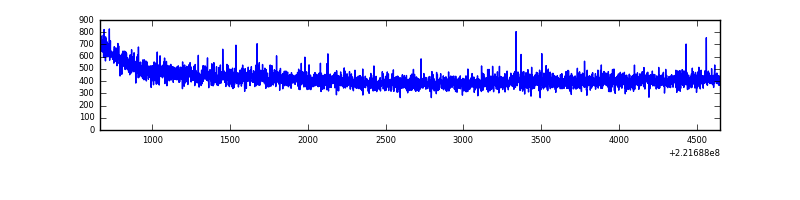 |
| B | 3985 | 3985 | 40 | 40 | 1.00% | 1.00% | 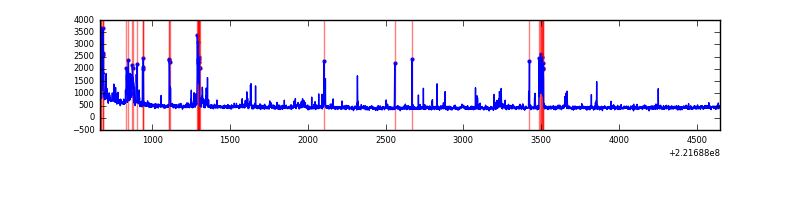 |
| C | 3985 | 3985 | 1 | 1 | 0.03% | 0.03% | 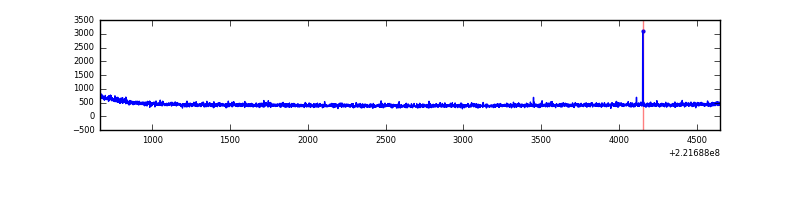 |
| D | 3986 | 3986 | 29 | 29 | 0.73% | 0.73% | 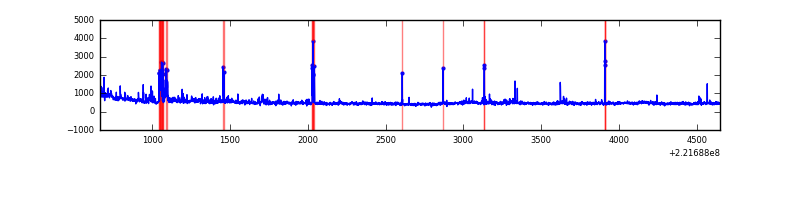 |
Top three noisy pixels from each quadrant. If the there are fewer than three noisy pixels in the level2.evt file, extra rows are filled as -1
| Pixel properties | Quadrant properties | ||||||
|---|---|---|---|---|---|---|---|
| Quadrant | DetID | PixID | Counts | Sigma | Mean | Median | Sigma |
| A | 13 | 248 | 5892 | 60.14 | 432 | 423 | 90.9 |
| A | 0 | 226 | 4141 | 40.88 | 432 | 423 | 90.9 |
| A | 12 | 194 | 4042 | 39.8 | 432 | 423 | 90.9 |
| B | 0 | 219 | 185973 | 2214.97 | 434 | 424 | 83.8 |
| B | 4 | 48 | 56950 | 674.77 | 434 | 424 | 83.8 |
| B | 4 | 81 | 47596 | 563.11 | 434 | 424 | 83.8 |
| C | 12 | 4 | 7361 | 70.08 | 423 | 424 | 99.0 |
| C | 13 | 61 | 3292 | 28.98 | 423 | 424 | 99.0 |
| C | 7 | 247 | 1648 | 12.37 | 423 | 424 | 99.0 |
| D | 8 | 195 | 309900 | 2995.03 | 416 | 403 | 103.3 |
| D | 14 | 34 | 62459 | 600.52 | 416 | 403 | 103.3 |
| D | 2 | 136 | 36517 | 349.48 | 416 | 403 | 103.3 |
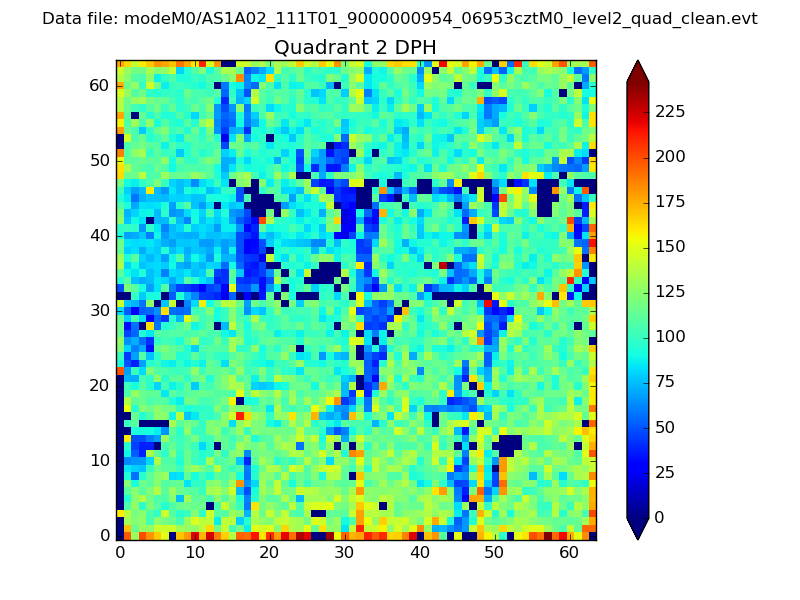
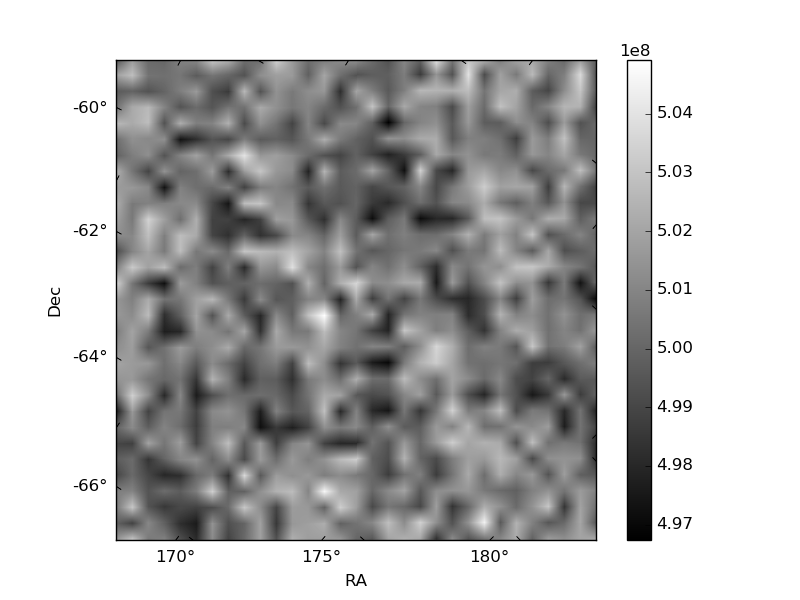
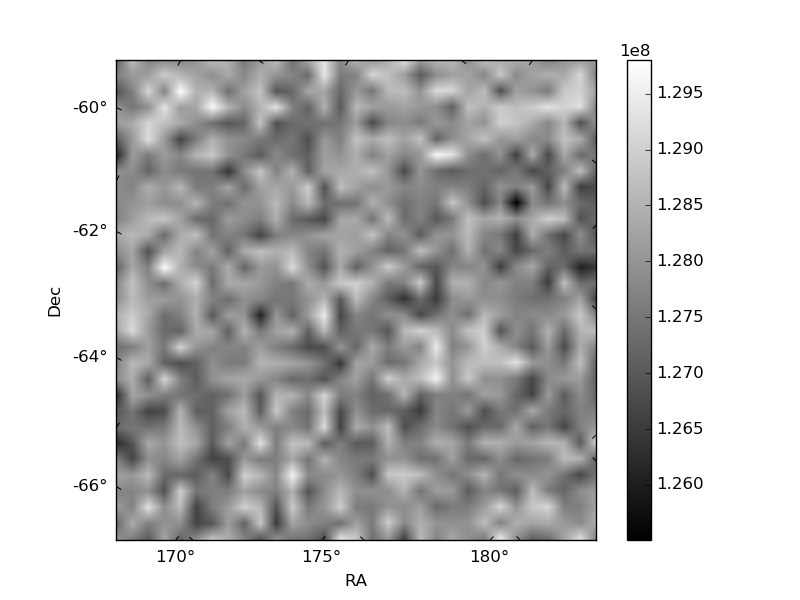
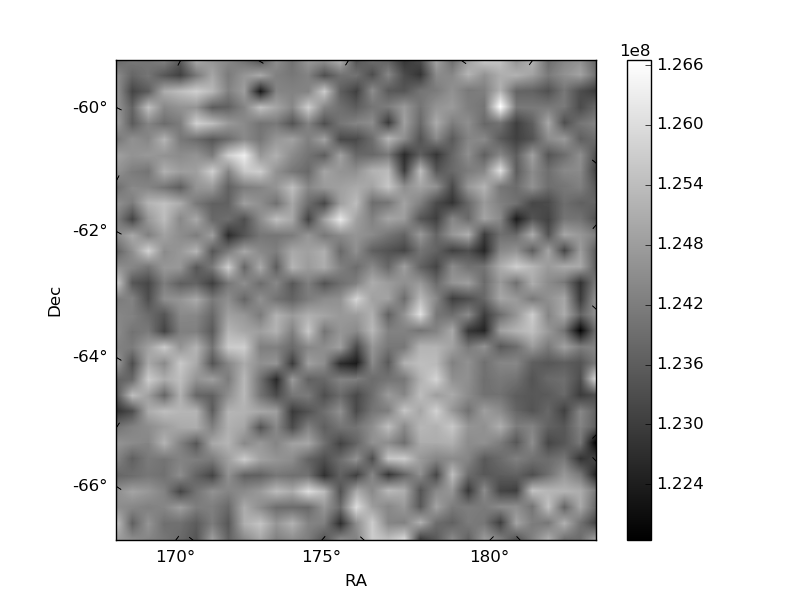
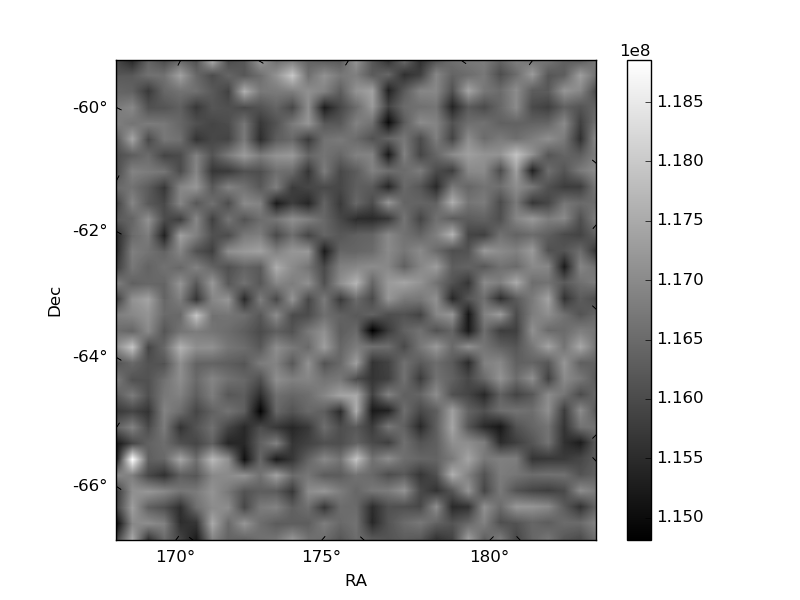
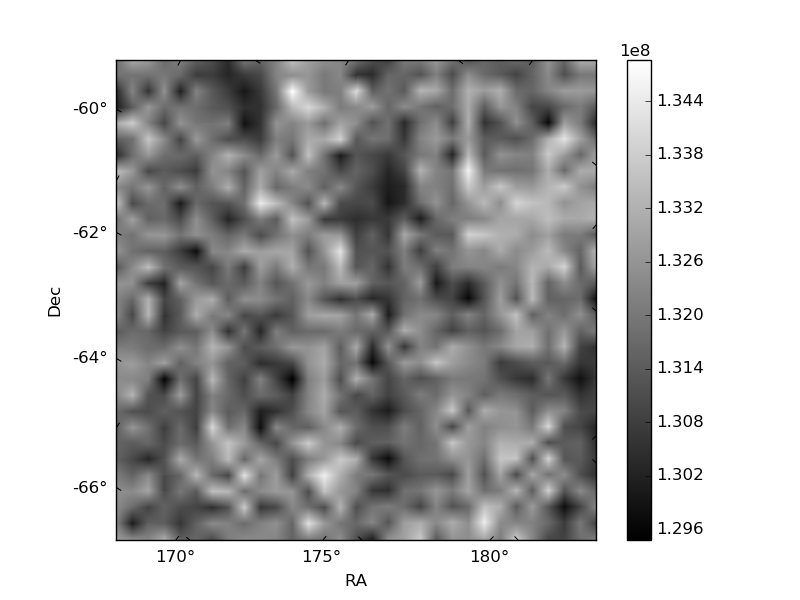
Histogram calculated using DETX and DETY for each event in the final _common_clean file
| Quadrant A | 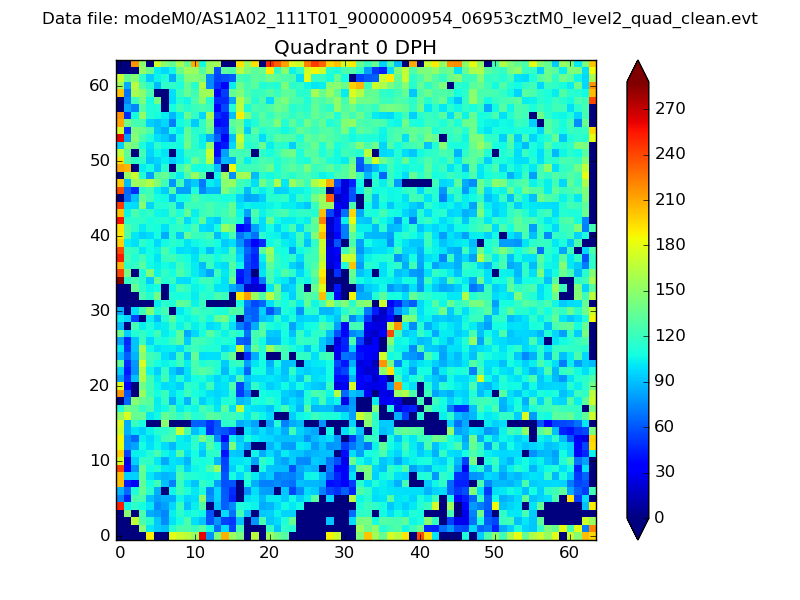 |
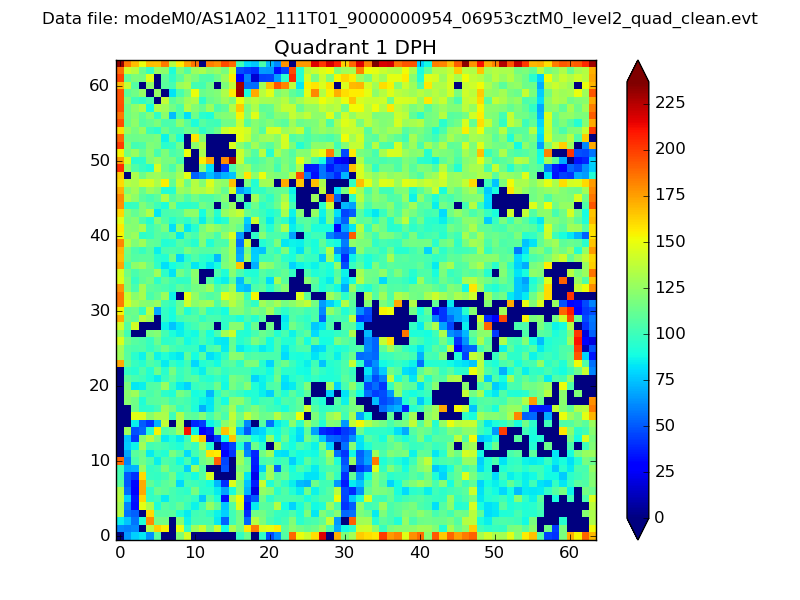 |
Quadrant B |
|---|---|---|---|
| Quadrant D | 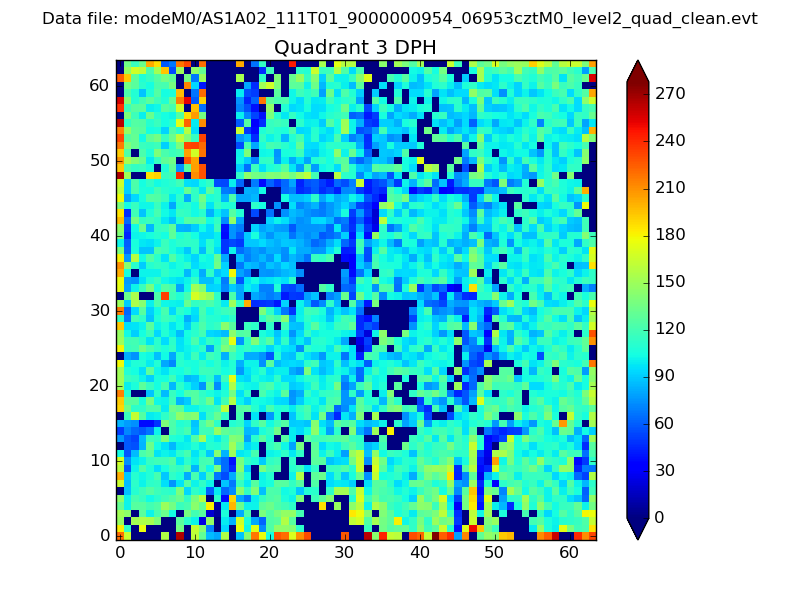 |
 |
Quadrant C |
| Plot type | Count rate plots | Images |
|---|---|---|
| Comparison with Poisson distribution Blue bars denote a histogram of data divided into 1 sec bins. Red curve is a Poisson curve with rate = median count rate of data. |
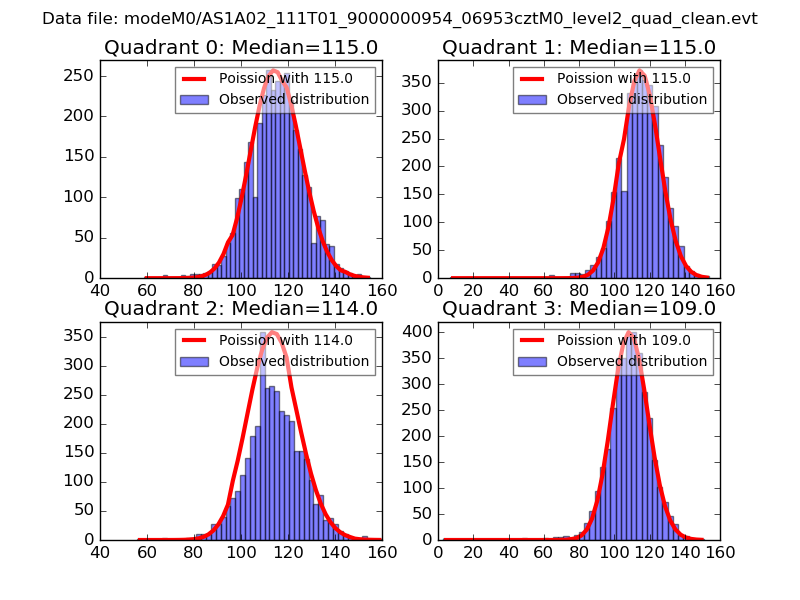 |
 |
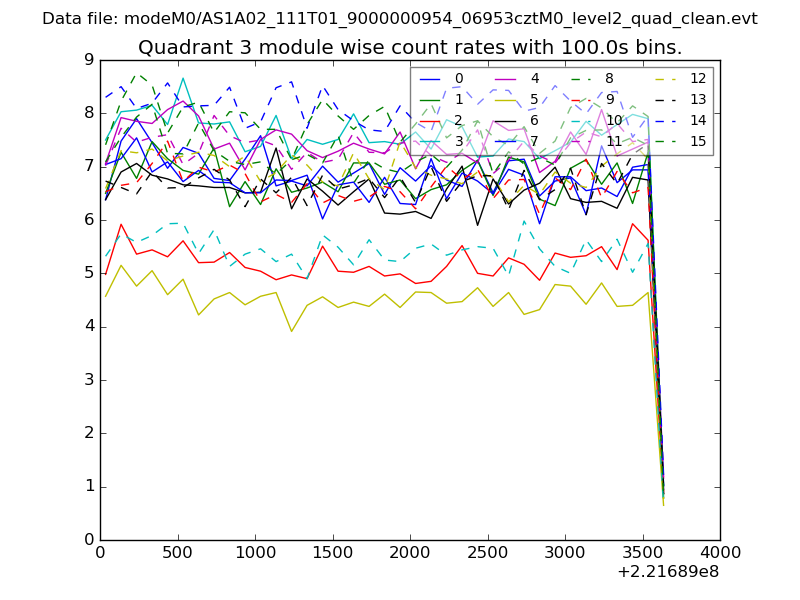
| Quadrant-wise count rates Data is divided into 100 sec bins |
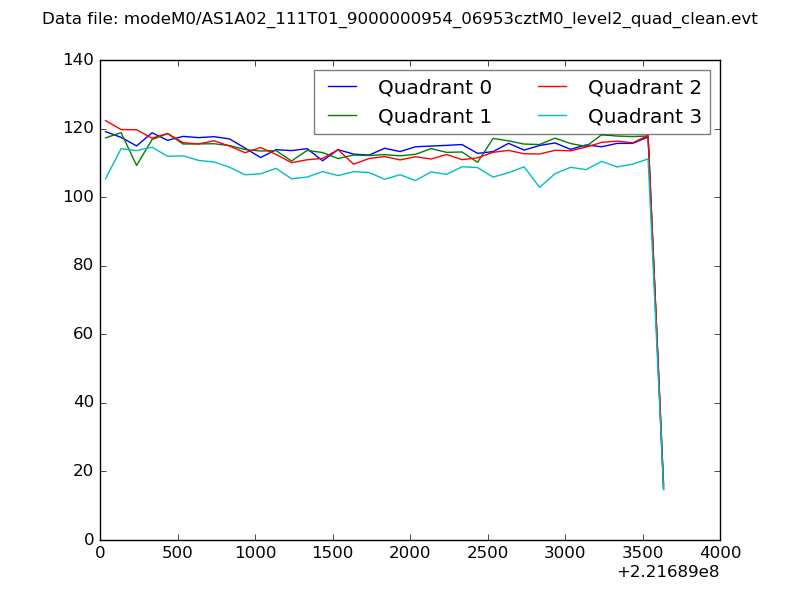 |
|
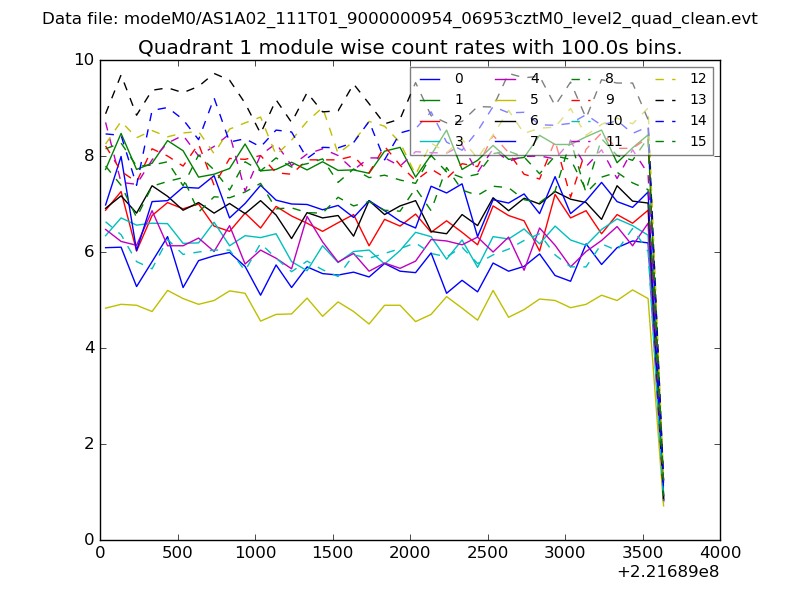
| Module-wise count rates for Quadrant A Data is divided into 100 sec bins |
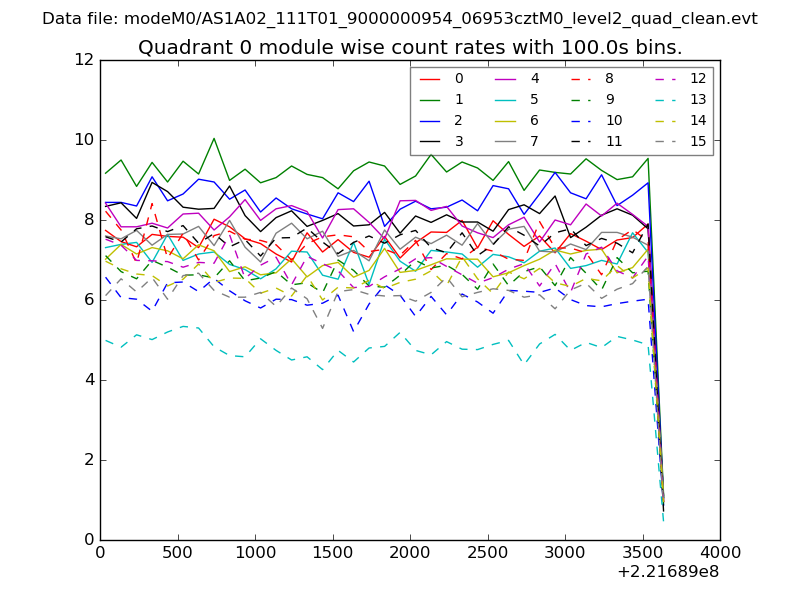 |
 |
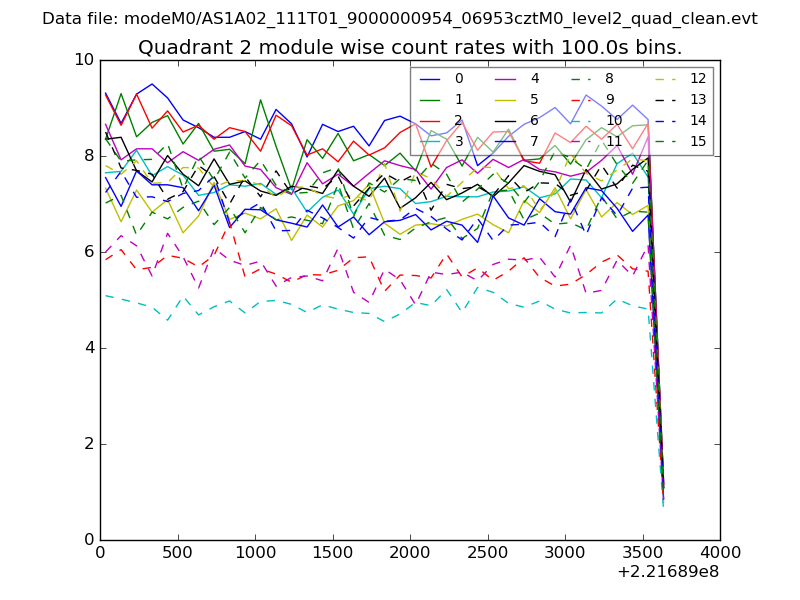
| Module-wise count rates for Quadrant B Data is divided into 100 sec bins |
 |
 |
| Module-wise count rates for Quadrant C Data is divided into 100 sec bins |
 |
 |
| Module-wise count rates for Quadrant D Data is divided into 100 sec bins |
 |
 |
| Parameter | Plot |
|---|---|
| CZT HV Monitor | 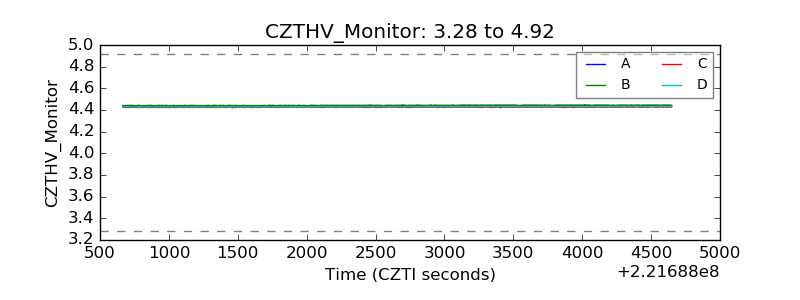 |
| D_VDD | 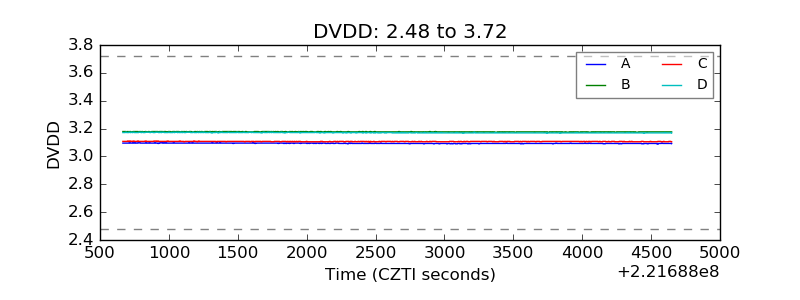 |
| Temperature 1 | 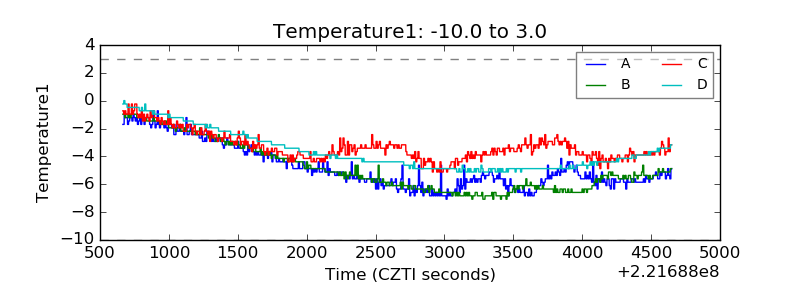 |
| Veto HV Monitor | 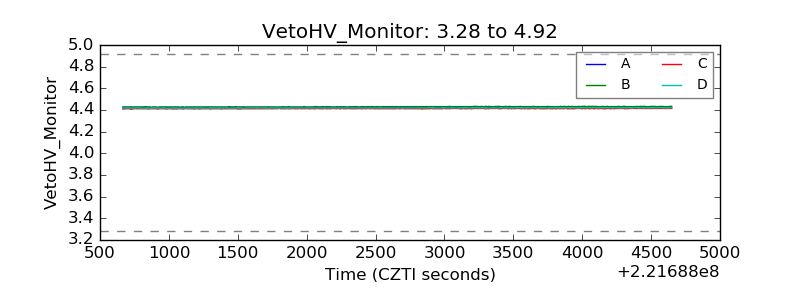 |
| Veto LLD | 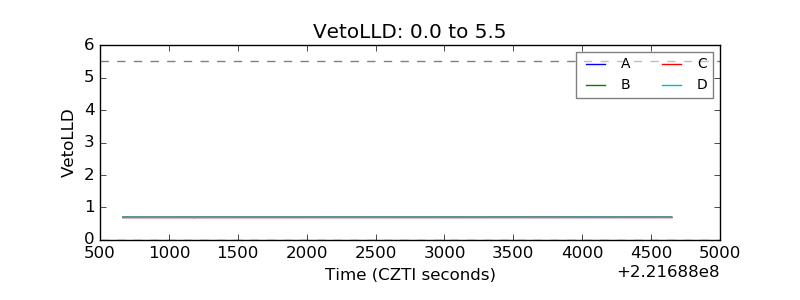 |
| Alpha Counter | 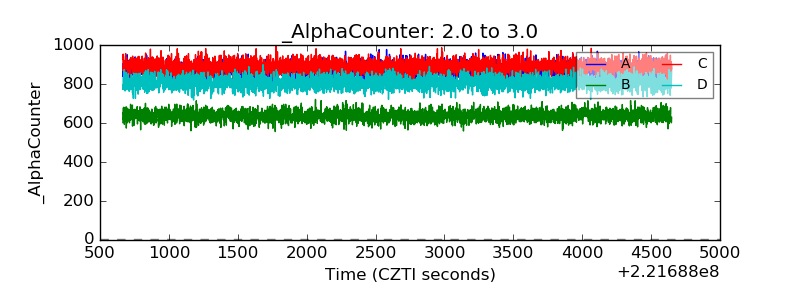 |
| _CPM_Rate | 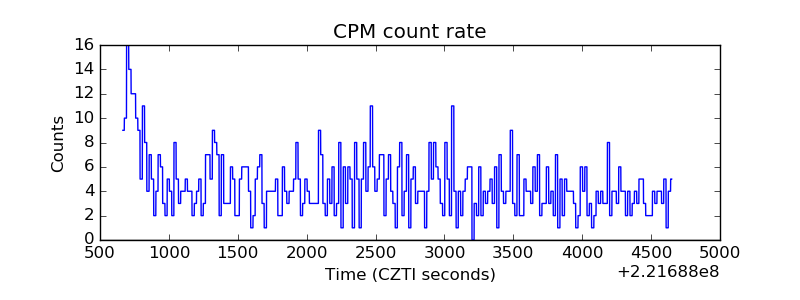 |
| CZT Counter | 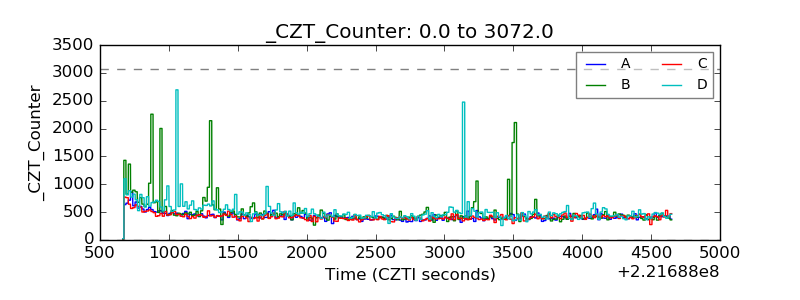 |
| +2.5 Volts monitor | 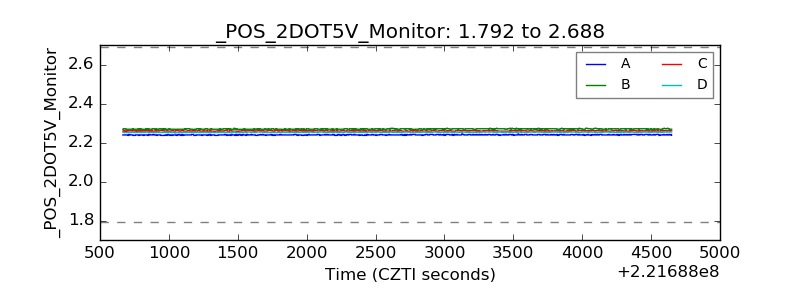 |
| +5 Volts monitor | 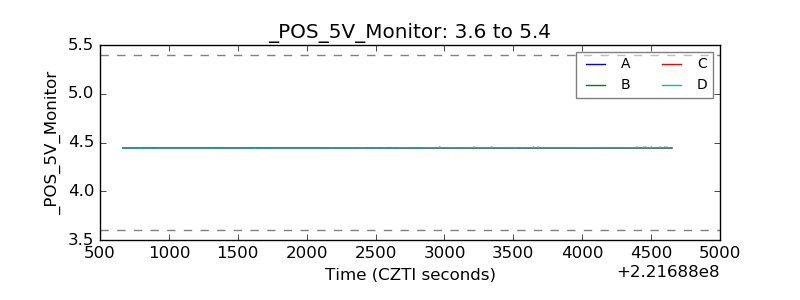 |
| _ROLL_ROT | 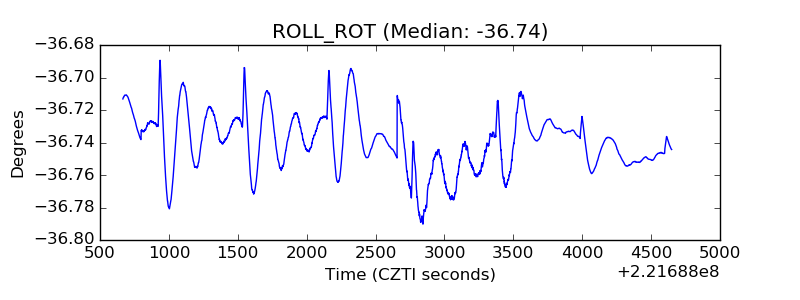 |
| _Roll_DEC | 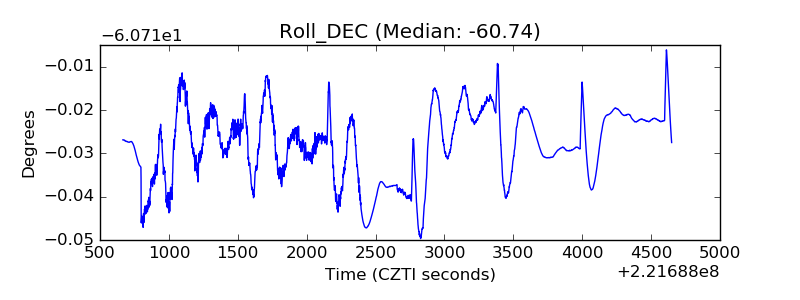 |
| _Roll_RA | 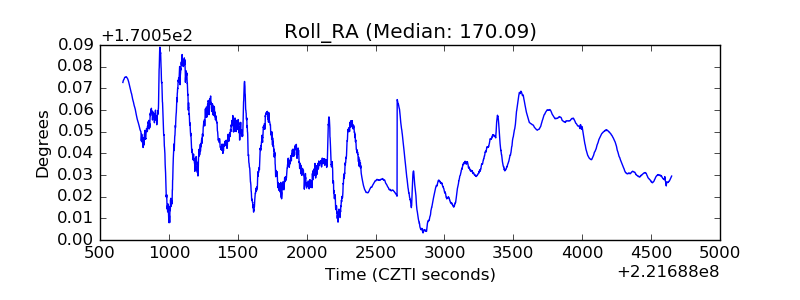 |
| Veto Counter | 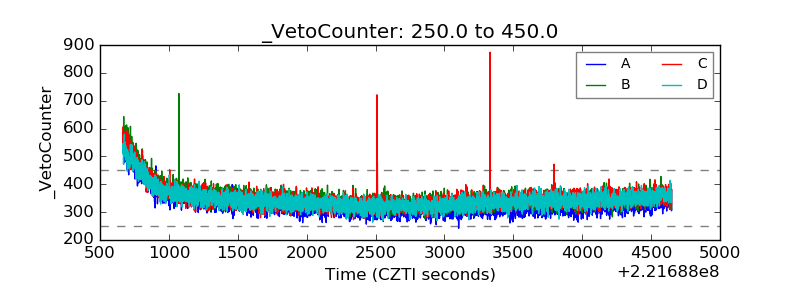 |