| Param | Original file | Final file |
|---|---|---|
| Filename | modeM0/AS1A02_111T01_9000000954_06956cztM0_level2.evt | modeM0/AS1A02_111T01_9000000954_06956cztM0_level2_quad_clean.evt |
| Size (bytes) | 967,872,960 | 173,272,320 |
| Size | 923.0 MB | 165.2 MB |
| Events in quadrant A | 6,431,212 | 1,080,825 |
| Events in quadrant B | 7,675,298 | 1,083,090 |
| Events in quadrant C | 6,367,762 | 1,070,973 |
| Events in quadrant D | 7,867,073 | 1,022,738 |
| Mode M0 | |||
|---|---|---|---|
| Quadrant | BADHDUFLAG | Total packets | Discarded packets |
| A | 0 | 29131 | 3 |
| B | 0 | 32598 | 3 |
| C | 0 | 29041 | 3 |
| D | 0 | 33056 | 3 |
| Mode M9 | |||
|---|---|---|---|
| Quadrant | BADHDUFLAG | Total packets | Discarded packets |
| A | 0 | 16 | 0 |
| B | 0 | 16 | 0 |
| C | 0 | 16 | 0 |
| D | 0 | 16 | 0 |
| Mode SS | |||
|---|---|---|---|
| Quadrant | BADHDUFLAG | Total packets | Discarded packets |
| A | 0 | 292 | 0 |
| B | 0 | 292 | 0 |
| C | 0 | 292 | 0 |
| D | 0 | 292 | 0 |
| Quadrant | Total seconds | Saturated seconds | Saturation percentage |
|---|---|---|---|
| A | 14345 | 32 | 0.223074% |
| B | 14345 | 284 | 1.979784% |
| C | 14345 | 38 | 0.264901% |
| D | 14345 | 138 | 0.962008% |
Noise dominated data is calculated using 1-second bins in cleaned event files. If a bin has >2000 counts, and if more than 50% of those come from <1% of pixels, then it is considered to be noise-dominated and hence unusable.
| Quadrant | # 1 sec bins | Bins with >0 counts | Bins with >2000 counts | High rate bins dominated by noise | Noise dominated (total time) | Noise dominated (detector-on time) | Marked lightcurve |
|---|---|---|---|---|---|---|---|
| A | 15860 | 14348 | 0 | 0 | 0.00% | 0.00% | 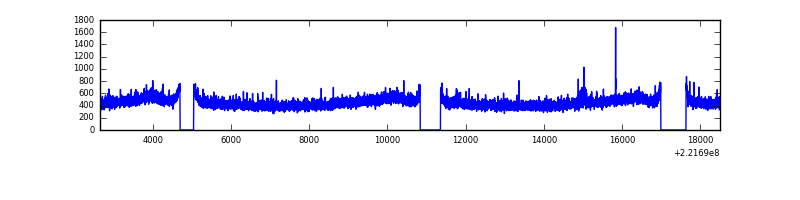 |
| B | 15860 | 14348 | 141 | 141 | 0.89% | 0.98% | 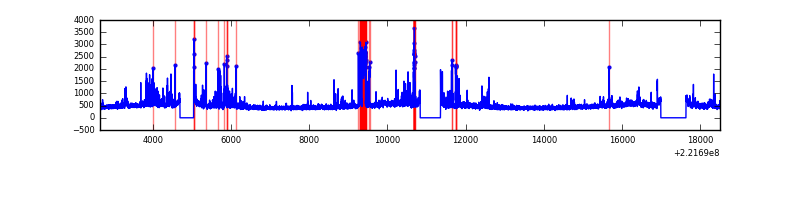 |
| C | 15860 | 14348 | 3 | 3 | 0.02% | 0.02% | 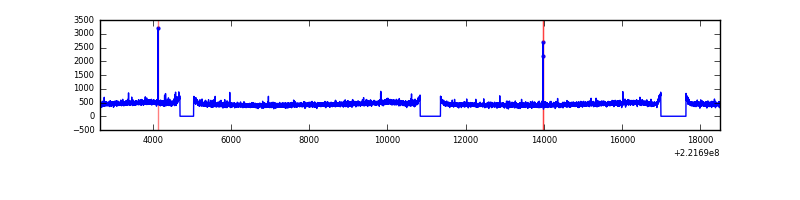 |
| D | 15860 | 14348 | 60 | 60 | 0.38% | 0.42% | 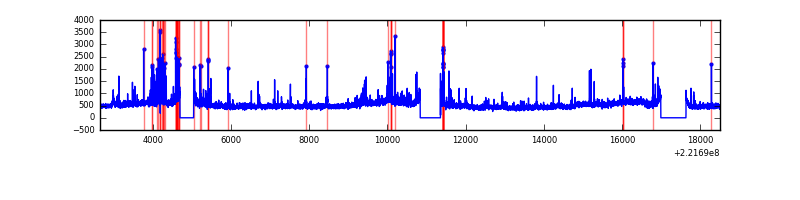 |
Top three noisy pixels from each quadrant. If the there are fewer than three noisy pixels in the level2.evt file, extra rows are filled as -1
| Pixel properties | Quadrant properties | ||||||
|---|---|---|---|---|---|---|---|
| Quadrant | DetID | PixID | Counts | Sigma | Mean | Median | Sigma |
| A | 13 | 248 | 19336 | 52.33 | 1663 | 1627 | 338.4 |
| A | 0 | 226 | 16203 | 43.07 | 1663 | 1627 | 338.4 |
| A | 12 | 194 | 15246 | 40.24 | 1663 | 1627 | 338.4 |
| B | 0 | 228 | 543675 | 1709.37 | 1664 | 1620 | 317.1 |
| B | 4 | 48 | 187255 | 585.4 | 1664 | 1620 | 317.1 |
| B | 4 | 81 | 176919 | 552.8 | 1664 | 1620 | 317.1 |
| C | 7 | 247 | 21522 | 53.27 | 1617 | 1623 | 373.6 |
| C | 12 | 4 | 14762 | 35.17 | 1617 | 1623 | 373.6 |
| C | 13 | 61 | 12900 | 30.19 | 1617 | 1623 | 373.6 |
| D | 8 | 195 | 1035123 | 2612.14 | 1613 | 1563 | 395.7 |
| D | 14 | 34 | 169866 | 425.36 | 1613 | 1563 | 395.7 |
| D | 2 | 152 | 132113 | 329.94 | 1613 | 1563 | 395.7 |
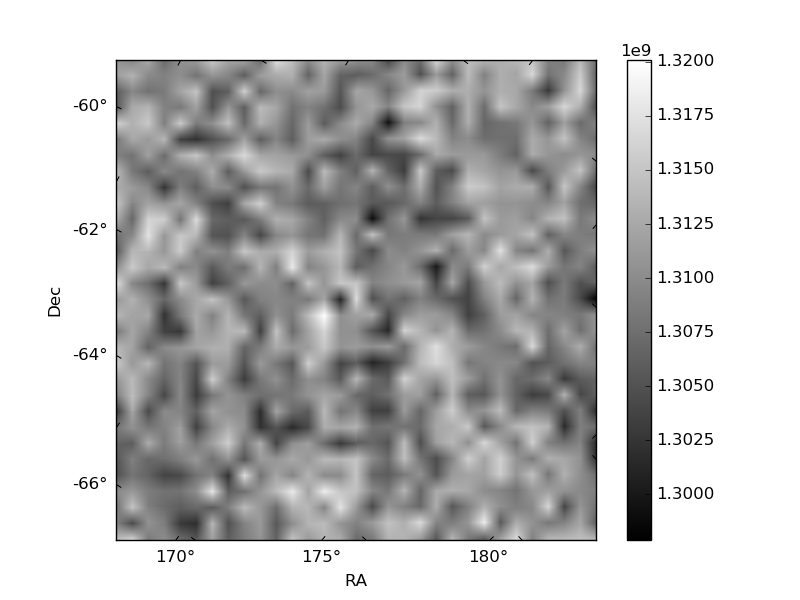
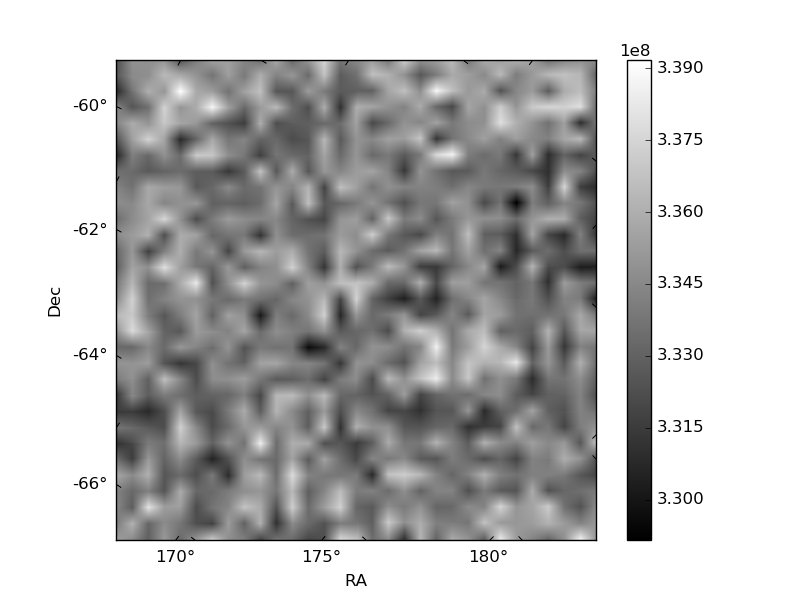
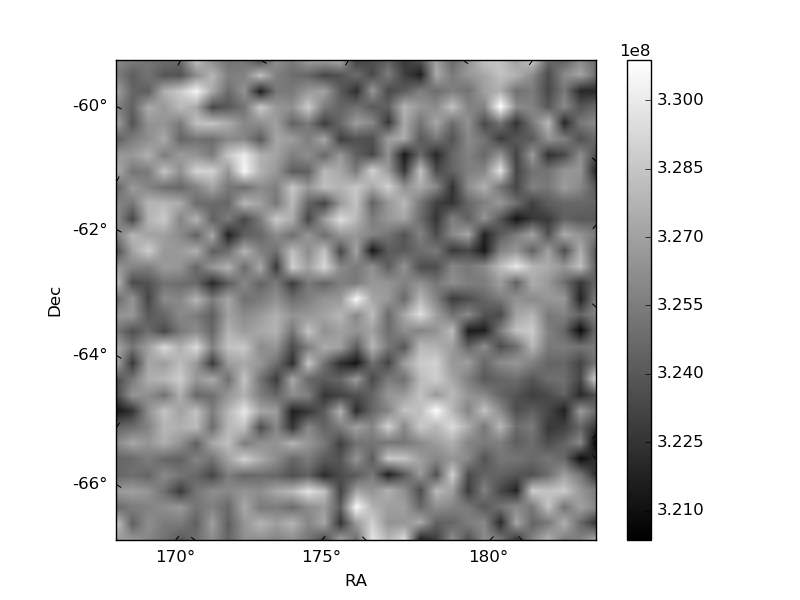
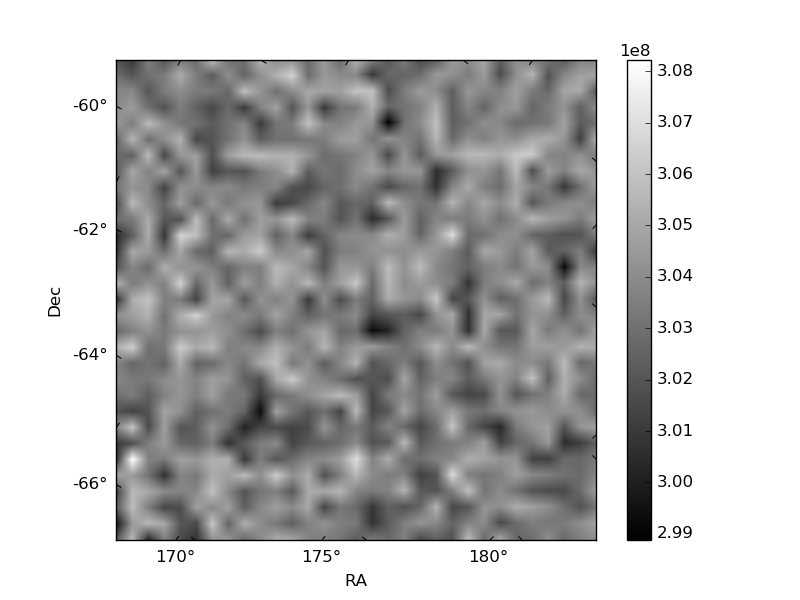
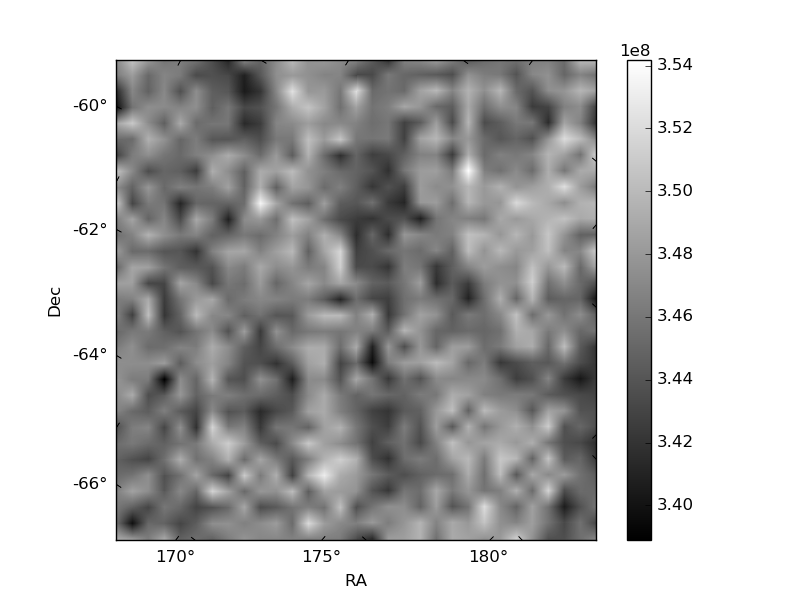
Histogram calculated using DETX and DETY for each event in the final _common_clean file
| Quadrant A | 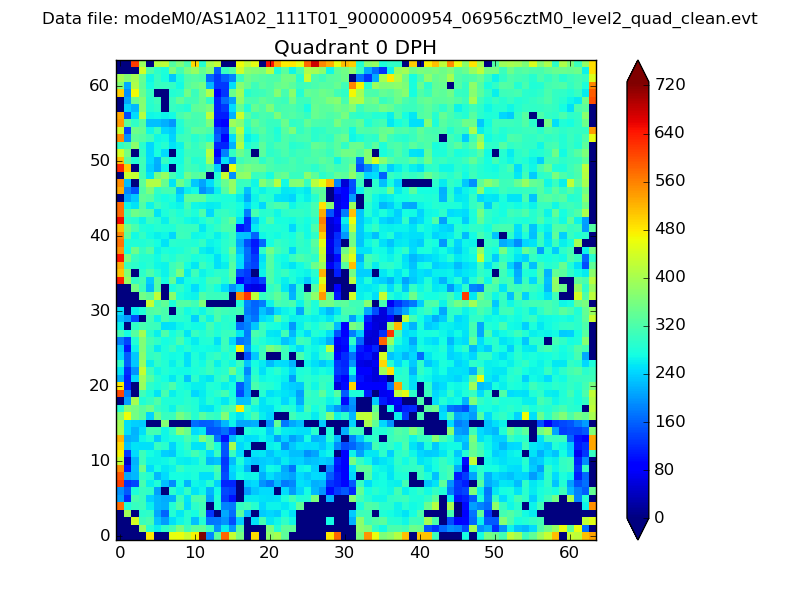 |
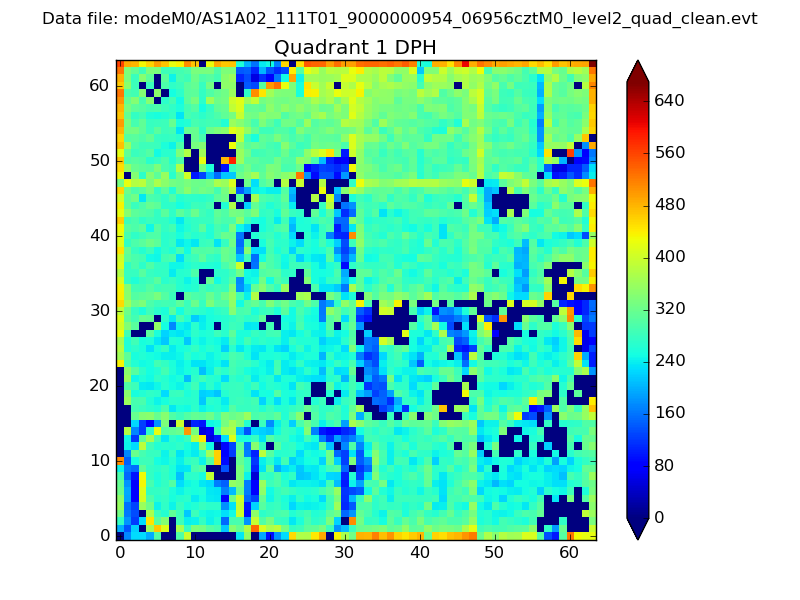 |
Quadrant B |
|---|---|---|---|
| Quadrant D | 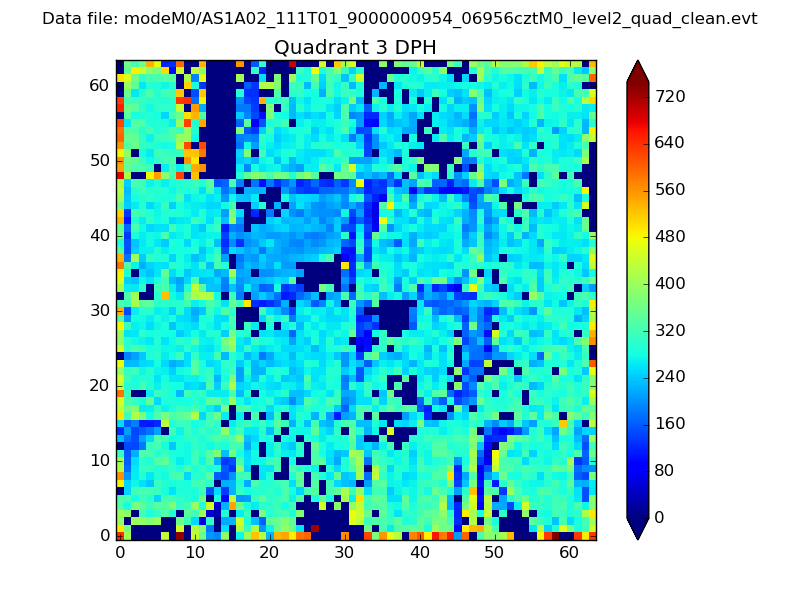 |
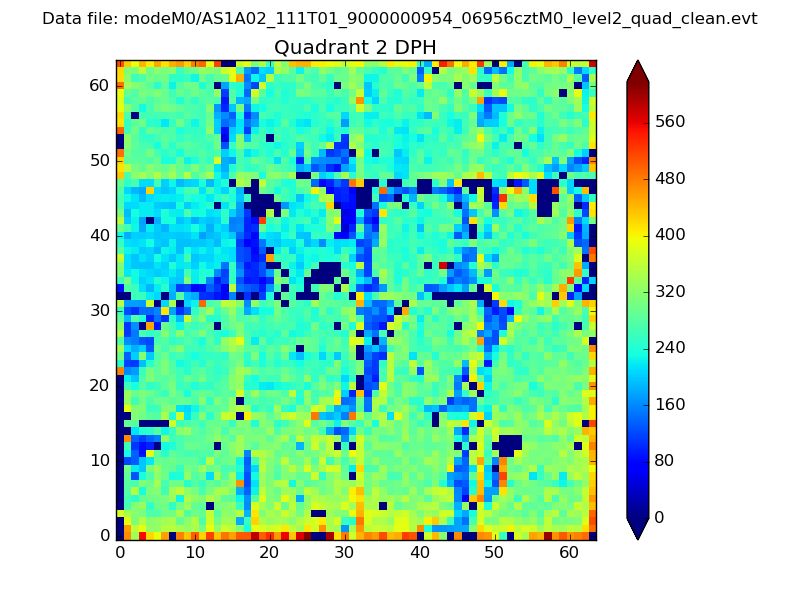 |
Quadrant C |
| Plot type | Count rate plots | Images |
|---|---|---|
| Comparison with Poisson distribution Blue bars denote a histogram of data divided into 1 sec bins. Red curve is a Poisson curve with rate = median count rate of data. |
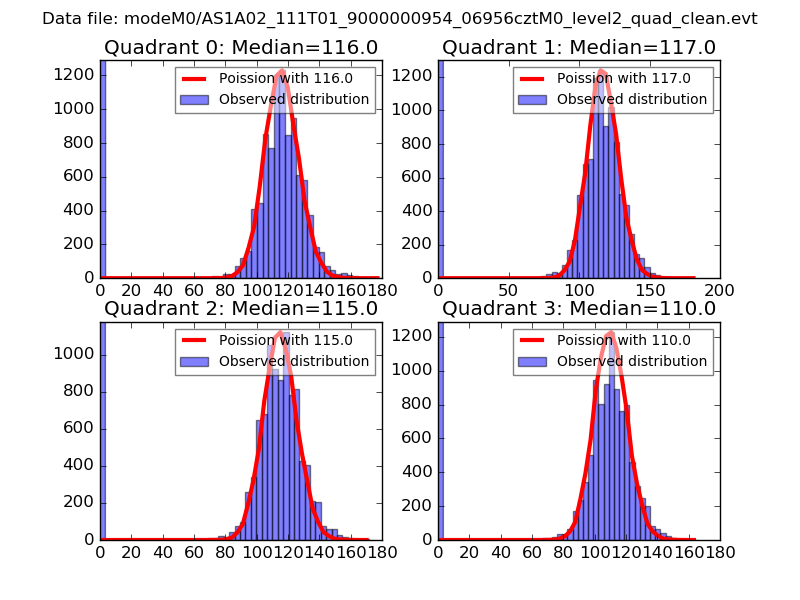 |
 |
| Quadrant-wise count rates Data is divided into 100 sec bins |
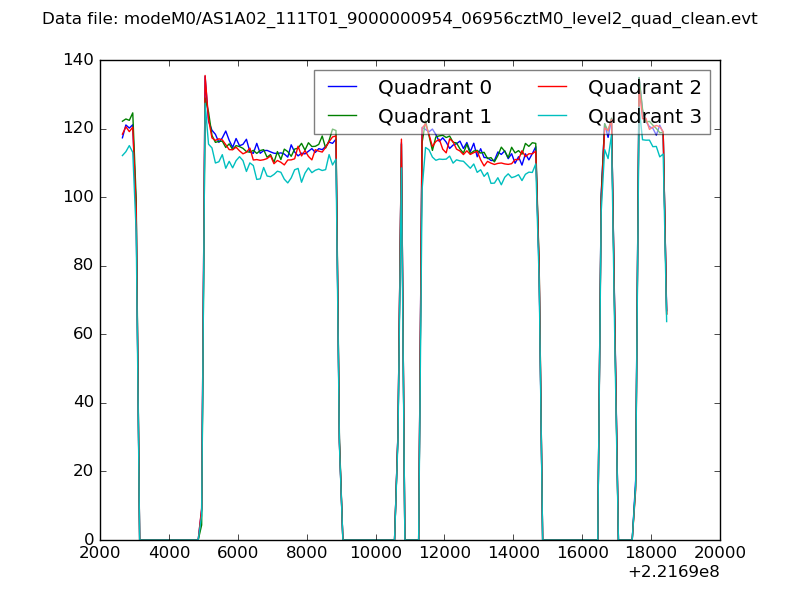 |
|
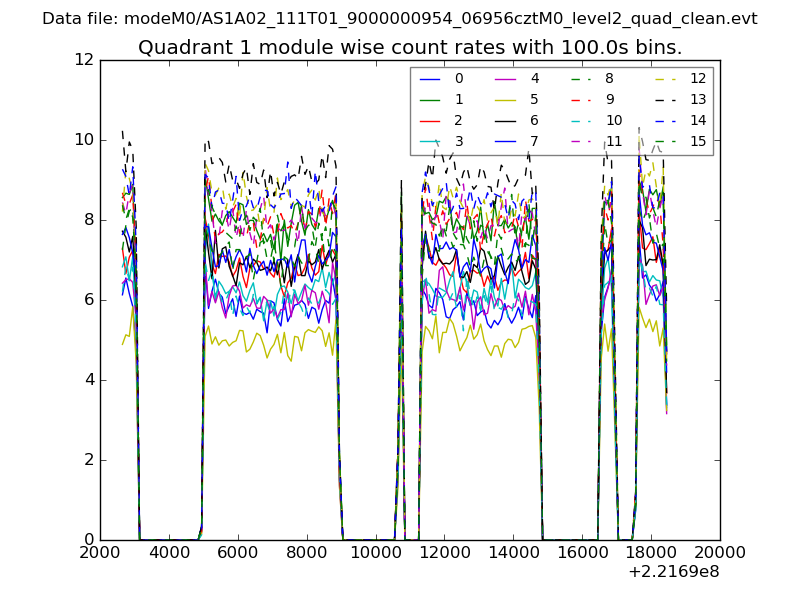
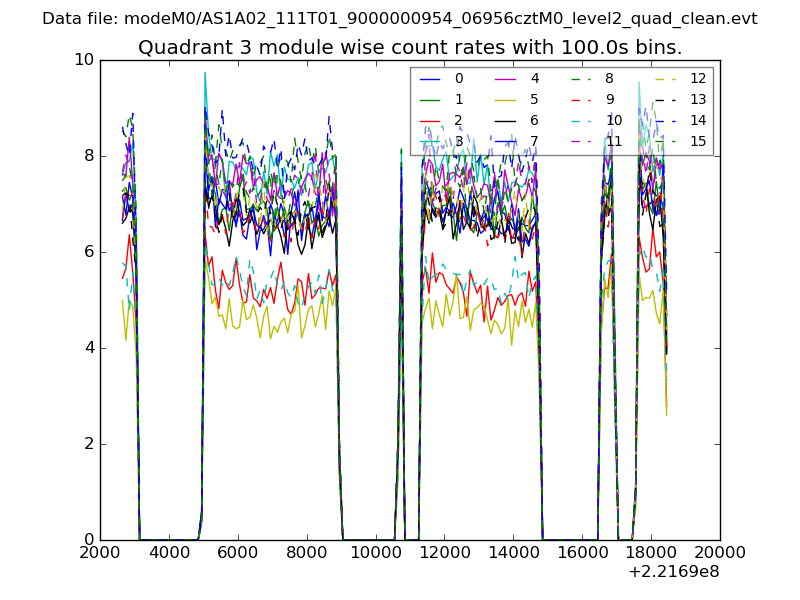
| Module-wise count rates for Quadrant A Data is divided into 100 sec bins |
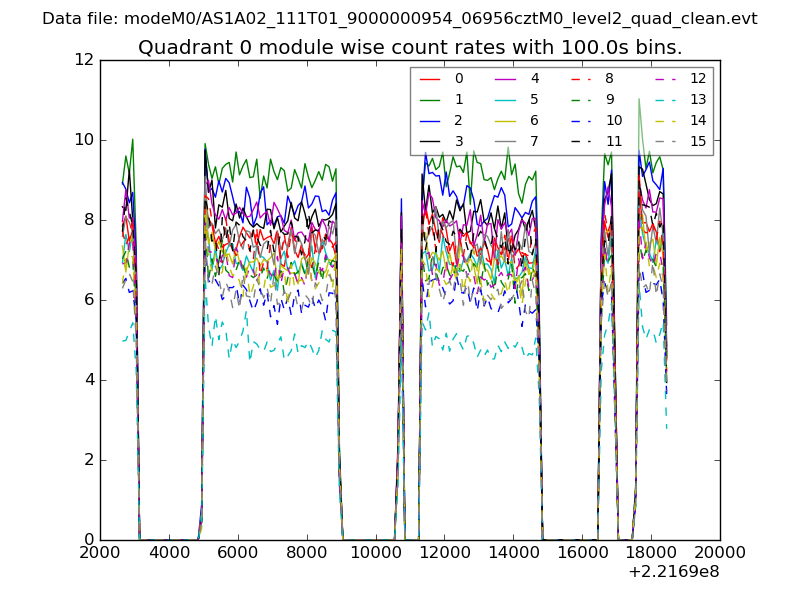 |
 |
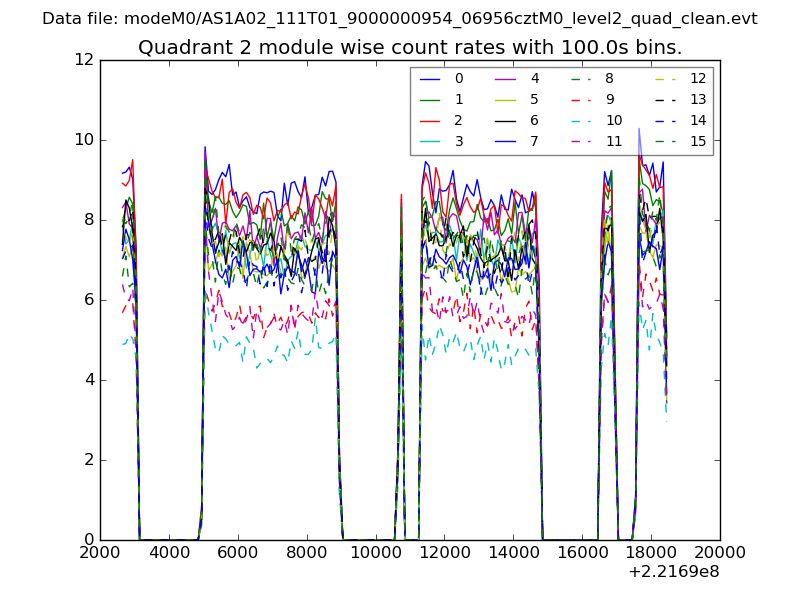
| Module-wise count rates for Quadrant B Data is divided into 100 sec bins |
 |
 |
| Module-wise count rates for Quadrant C Data is divided into 100 sec bins |
 |
 |
| Module-wise count rates for Quadrant D Data is divided into 100 sec bins |
 |
 |
| Parameter | Plot |
|---|---|
| CZT HV Monitor | 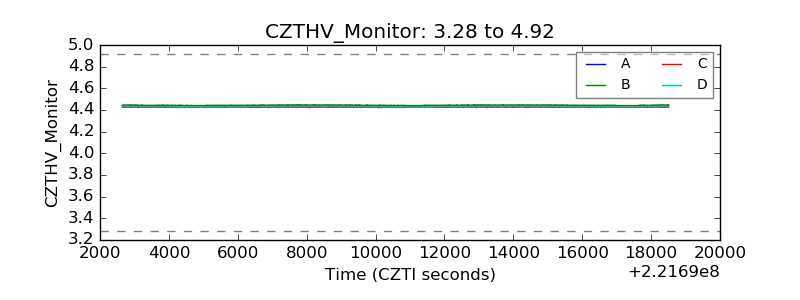 |
| D_VDD | 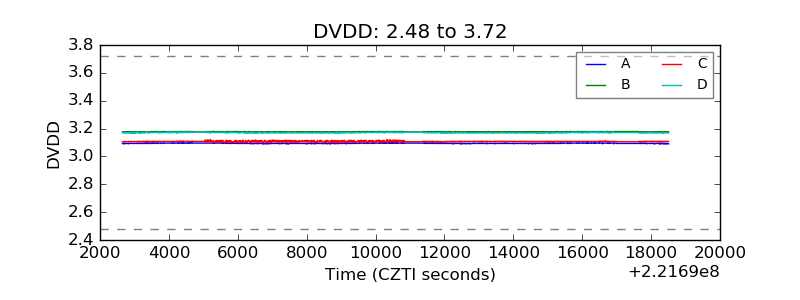 |
| Temperature 1 | 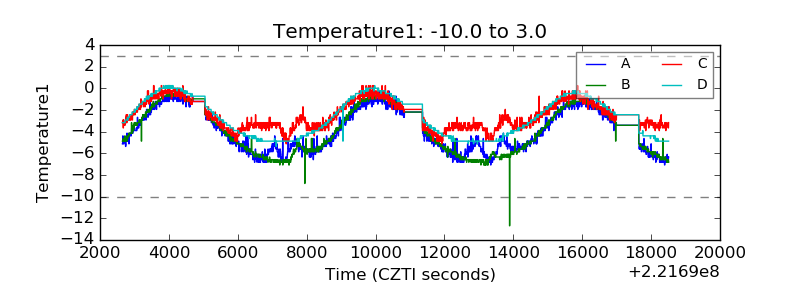 |
| Veto HV Monitor | 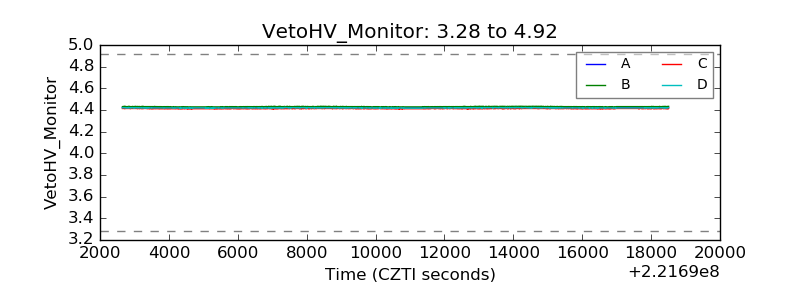 |
| Veto LLD | 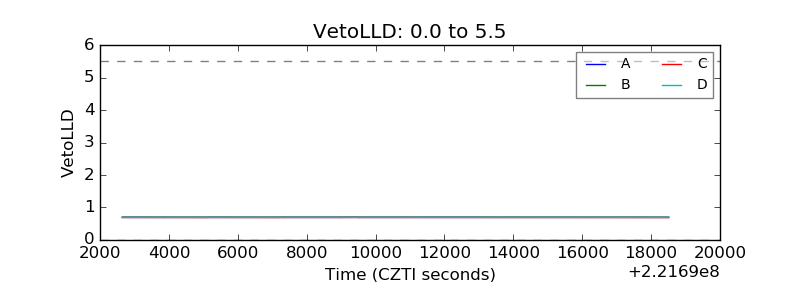 |
| Alpha Counter | 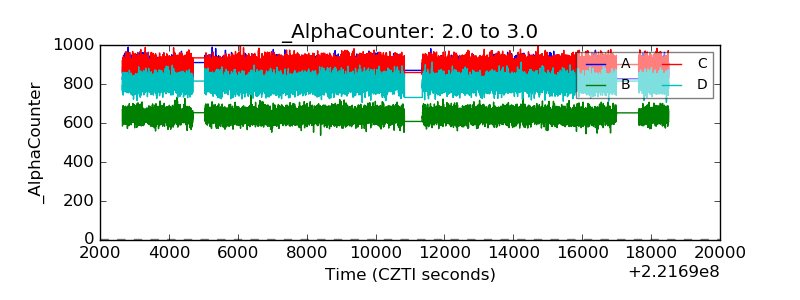 |
| _CPM_Rate | 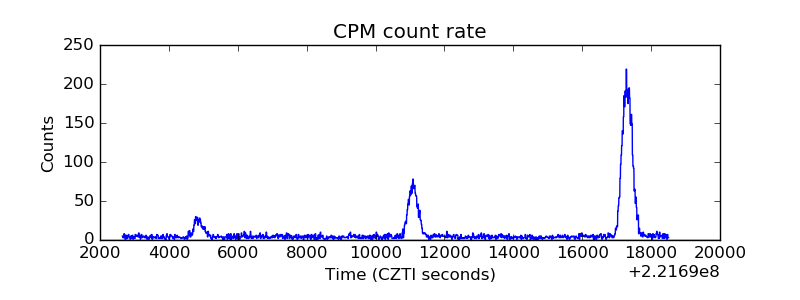 |
| CZT Counter | 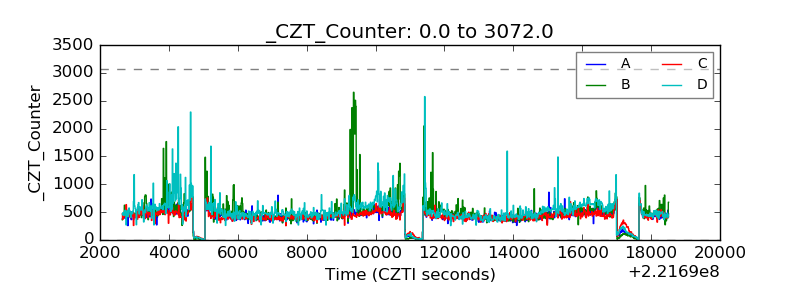 |
| +2.5 Volts monitor | 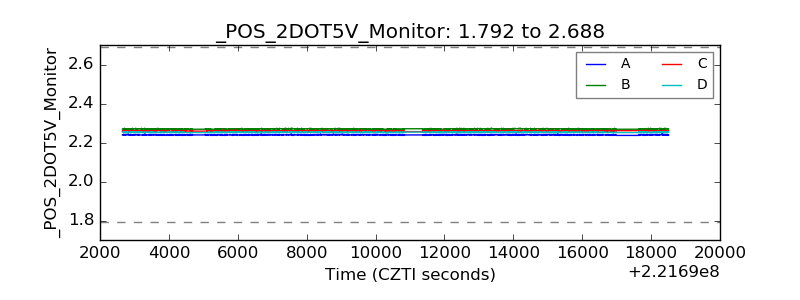 |
| +5 Volts monitor | 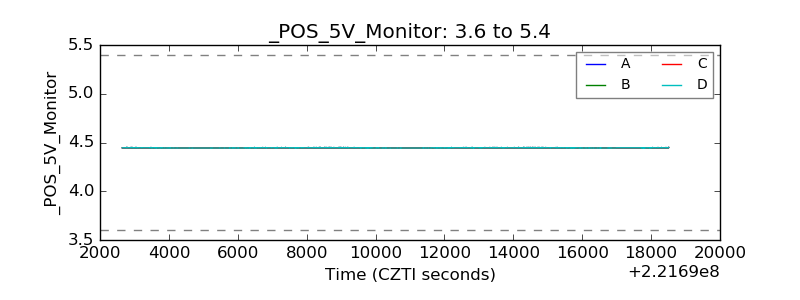 |
| _ROLL_ROT | 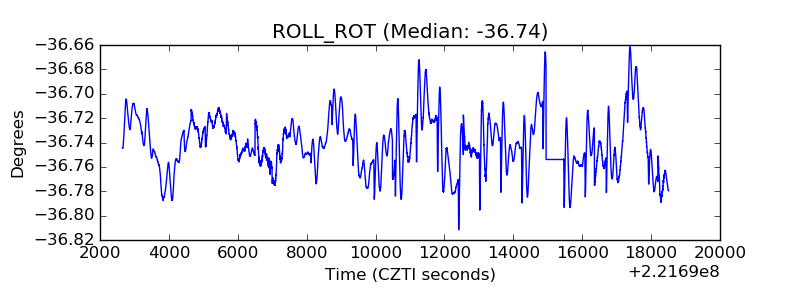 |
| _Roll_DEC | 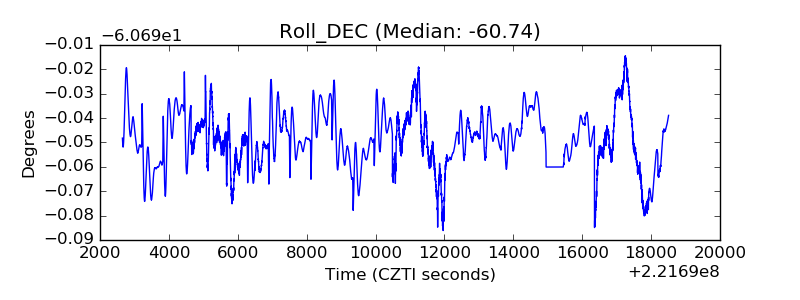 |
| _Roll_RA | 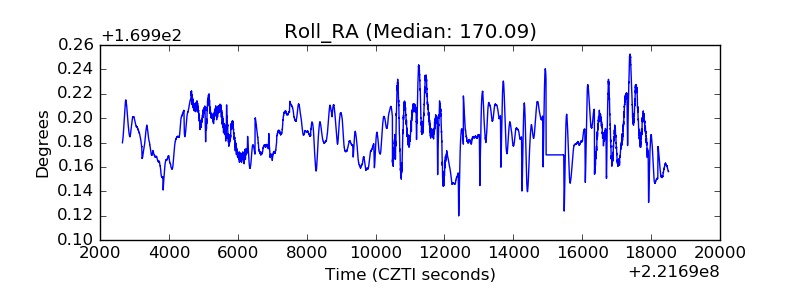 |
| Veto Counter | 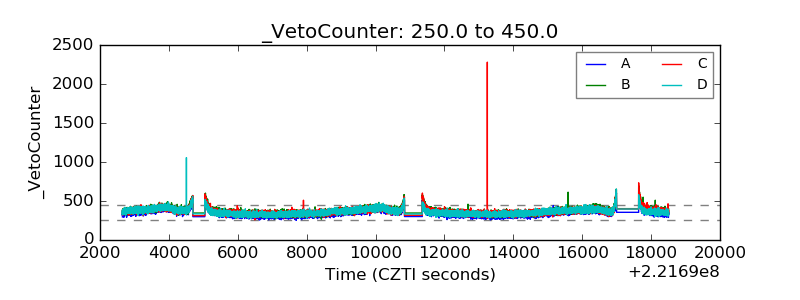 |