| Param | Original file | Final file |
|---|---|---|
| Filename | modeM0/AS1A02_165T06_9000000952cztM0_level2.fits | modeM0/AS1A02_165T06_9000000952cztM0_level2_quad_clean.evt |
| Size (bytes) | 72,351,360 | 63,236,160 |
| Size | 69.0 MB | 60.3 MB |
| Events in quadrant A | 436,752 | 361,850 |
| Events in quadrant B | 416,140 | 356,591 |
| Events in quadrant C | 434,624 | 346,025 |
| Events in quadrant D | 376,544 | 322,690 |
| Mode SS | |||
|---|---|---|---|
| Quadrant | BADHDUFLAG | Total packets | Discarded packets |
| A | 0 | 154 | 0 |
| B | 0 | 154 | 0 |
| C | 0 | 154 | 0 |
| D | 0 | 154 | 0 |
| Mode M9 | |||
|---|---|---|---|
| Quadrant | BADHDUFLAG | Total packets | Discarded packets |
| A | 0 | 11 | 0 |
| B | 0 | 11 | 0 |
| C | 0 | 11 | 0 |
| D | 0 | 11 | 0 |
| Mode M0 | |||
|---|---|---|---|
| Quadrant | BADHDUFLAG | Total packets | Discarded packets |
| A | 0 | 15787 | 0 |
| B | 0 | 17176 | 0 |
| C | 0 | 15761 | 0 |
| D | 0 | 16855 | 0 |
| Quadrant | Total seconds | Saturated seconds | Saturation percentage |
|---|---|---|---|
| A | 7575 | 118 | 1.557756% |
| B | 7575 | 251 | 3.313531% |
| C | 7575 | 110 | 1.452145% |
| D | 7575 | 159 | 2.099010% |
Noise dominated data is calculated using 1-second bins in cleaned event files. If a bin has >2000 counts, and if more than 50% of those come from <1% of pixels, then it is considered to be noise-dominated and hence unusable.
| Quadrant | # 1 sec bins | Bins with >0 counts | Bins with >2000 counts | High rate bins dominated by noise | Noise dominated (total time) | Noise dominated (detector-on time) | Marked lightcurve |
|---|---|---|---|---|---|---|---|
| A | 8670 | 7575 | 0 | 0 | 0.00% | 0.00% |  |
| B | 8670 | 7572 | 0 | 0 | 0.00% | 0.00% |  |
| C | 8670 | 7575 | 0 | 0 | 0.00% | 0.00% |  |
| D | 8670 | 7574 | 0 | 0 | 0.00% | 0.00% |  |
Top three noisy pixels from each quadrant. If the there are fewer than three noisy pixels in the level2.evt file, extra rows are filled as -1
| Pixel properties | Quadrant properties | ||||||
|---|---|---|---|---|---|---|---|
| Quadrant | DetID | PixID | Counts | Sigma | Mean | Median | Sigma |
| A | 14 | 188 | 452 | 11.41 | 113 | 106 | 30.3 |
| A | 0 | 29 | 388 | 9.3 | 113 | 106 | 30.3 |
| A | 14 | 204 | 370 | 8.7 | 113 | 106 | 30.3 |
| B | 2 | 9 | 361 | 10.35 | 109 | 104 | 24.8 |
| B | 3 | 17 | 312 | 8.38 | 109 | 104 | 24.8 |
| B | 5 | 128 | 288 | 7.41 | 109 | 104 | 24.8 |
| C | 1 | 81 | 329 | 6.93 | 114 | 107 | 32.0 |
| C | 1 | 80 | 317 | 6.56 | 114 | 107 | 32.0 |
| C | 2 | 191 | 299 | 6.0 | 114 | 107 | 32.0 |
| D | 6 | 231 | 306 | 6.88 | 107 | 98 | 30.2 |
| D | 7 | 5 | 283 | 6.12 | 107 | 98 | 30.2 |
| D | 15 | 63 | 274 | 5.82 | 107 | 98 | 30.2 |
Histogram calculated using DETX and DETY for each event in the final _common_clean file
| Quadrant A |  |
 |
Quadrant B |
|---|---|---|---|
| Quadrant D | 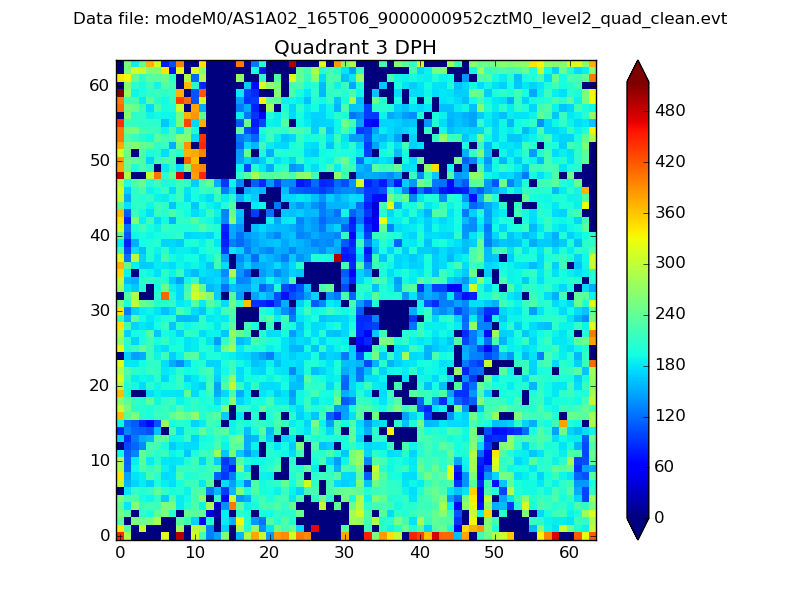 |
 |
Quadrant C |
| Plot type | Count rate plots | Images |
|---|---|---|
| Comparison with Poisson distribution Blue bars denote a histogram of data divided into 1 sec bins. Red curve is a Poisson curve with rate = median count rate of data. |
 |
 |
| Quadrant-wise count rates Data is divided into 100 sec bins |
 |
|
| Module-wise count rates for Quadrant A Data is divided into 100 sec bins |
 |
 |
| Module-wise count rates for Quadrant B Data is divided into 100 sec bins |
 |
 |
| Module-wise count rates for Quadrant C Data is divided into 100 sec bins |
 |
 |
| Module-wise count rates for Quadrant D Data is divided into 100 sec bins |
 |
 |
| Parameter | Plot |
|---|---|
| CZT HV Monitor |  |
| D_VDD |  |
| Temperature 1 |  |
| Veto HV Monitor |  |
| Veto LLD |  |
| Alpha Counter |  |
| _CPM_Rate |  |
| CZT Counter |  |
| +2.5 Volts monitor |  |
| +5 Volts monitor |  |
| _ROLL_ROT |  |
| _Roll_DEC |  |
| _Roll_RA |  |
| Veto Counter |  |