| Param | Original file | Final file |
|---|---|---|
| Filename | modeM0/AS1A02_165T06_9000000952_06949cztM0_level2.evt | modeM0/AS1A02_165T06_9000000952_06949cztM0_level2_quad_clean.evt |
| Size (bytes) | 263,407,680 | 47,134,080 |
| Size | 251.2 MB | 45.0 MB |
| Events in quadrant A | 1,801,749 | 293,807 |
| Events in quadrant B | 2,088,570 | 295,791 |
| Events in quadrant C | 1,795,055 | 295,705 |
| Events in quadrant D | 2,044,326 | 285,540 |
| Mode SS | |||
|---|---|---|---|
| Quadrant | BADHDUFLAG | Total packets | Discarded packets |
| A | 0 | 74 | 0 |
| B | 0 | 74 | 0 |
| C | 0 | 74 | 0 |
| D | 0 | 74 | 0 |
| Mode M9 | |||
|---|---|---|---|
| Quadrant | BADHDUFLAG | Total packets | Discarded packets |
| A | 0 | 11 | 0 |
| B | 0 | 11 | 0 |
| C | 0 | 11 | 0 |
| D | 0 | 11 | 0 |
| Mode M0 | |||
|---|---|---|---|
| Quadrant | BADHDUFLAG | Total packets | Discarded packets |
| A | 0 | 7757 | 2 |
| B | 0 | 8638 | 1 |
| C | 0 | 7758 | 1 |
| D | 0 | 8533 | 1 |
| Quadrant | Total seconds | Saturated seconds | Saturation percentage |
|---|---|---|---|
| A | 3619 | 115 | 3.177673% |
| B | 3619 | 209 | 5.775076% |
| C | 3619 | 110 | 3.039514% |
| D | 3619 | 157 | 4.338215% |
Noise dominated data is calculated using 1-second bins in cleaned event files. If a bin has >2000 counts, and if more than 50% of those come from <1% of pixels, then it is considered to be noise-dominated and hence unusable.
| Quadrant | # 1 sec bins | Bins with >0 counts | Bins with >2000 counts | High rate bins dominated by noise | Noise dominated (total time) | Noise dominated (detector-on time) | Marked lightcurve |
|---|---|---|---|---|---|---|---|
| A | 4714 | 3620 | 0 | 0 | 0.00% | 0.00% | 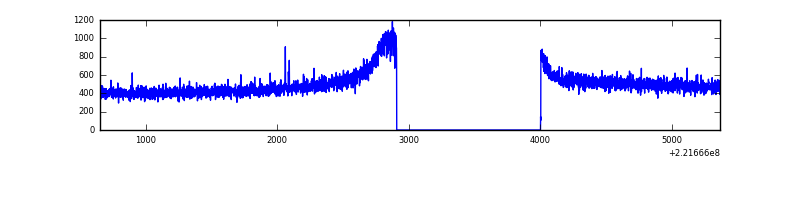 |
| B | 4714 | 3620 | 52 | 52 | 1.10% | 1.44% | 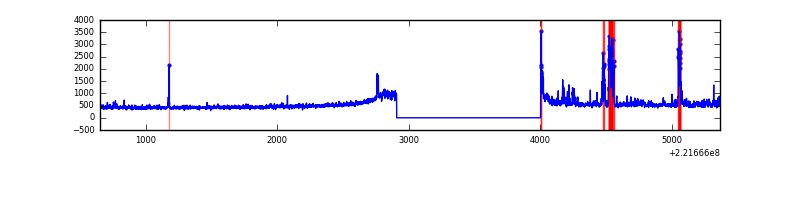 |
| C | 4714 | 3620 | 0 | 0 | 0.00% | 0.00% | 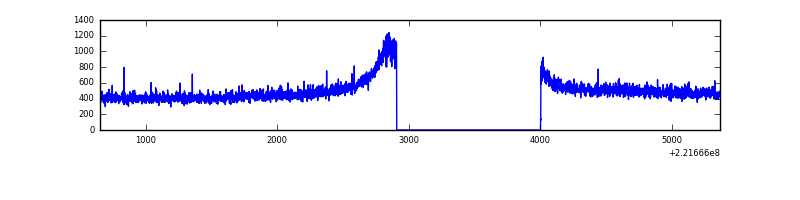 |
| D | 4714 | 3620 | 55 | 55 | 1.17% | 1.52% | 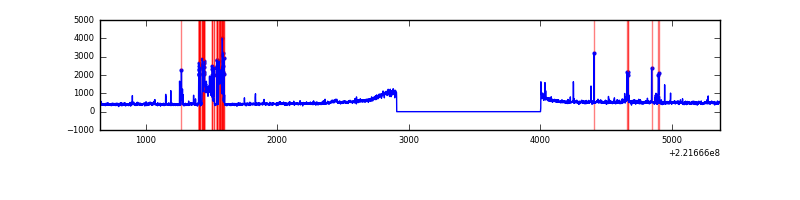 |
Top three noisy pixels from each quadrant. If the there are fewer than three noisy pixels in the level2.evt file, extra rows are filled as -1
| Pixel properties | Quadrant properties | ||||||
|---|---|---|---|---|---|---|---|
| Quadrant | DetID | PixID | Counts | Sigma | Mean | Median | Sigma |
| A | 0 | 226 | 4338 | 40.48 | 466 | 455 | 95.9 |
| A | 12 | 194 | 4120 | 38.21 | 466 | 455 | 95.9 |
| A | 4 | 2 | 2885 | 25.33 | 466 | 455 | 95.9 |
| B | 0 | 219 | 207763 | 2286.25 | 462 | 451 | 90.7 |
| B | 0 | 228 | 65913 | 721.92 | 462 | 451 | 90.7 |
| B | 12 | 111 | 9163 | 96.08 | 462 | 451 | 90.7 |
| C | 13 | 61 | 3595 | 28.93 | 459 | 462 | 108.3 |
| C | 7 | 220 | 2648 | 20.19 | 459 | 462 | 108.3 |
| C | 10 | 22 | 1357 | 8.27 | 459 | 462 | 108.3 |
| D | 2 | 14 | 232045 | 2024.61 | 457 | 442 | 114.4 |
| D | 2 | 152 | 22762 | 195.12 | 457 | 442 | 114.4 |
| D | 7 | 55 | 17268 | 147.09 | 457 | 442 | 114.4 |
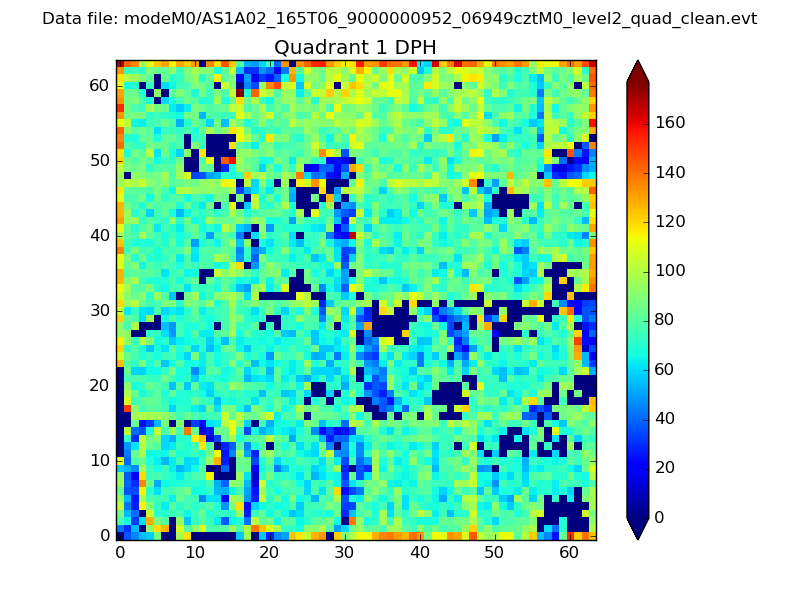
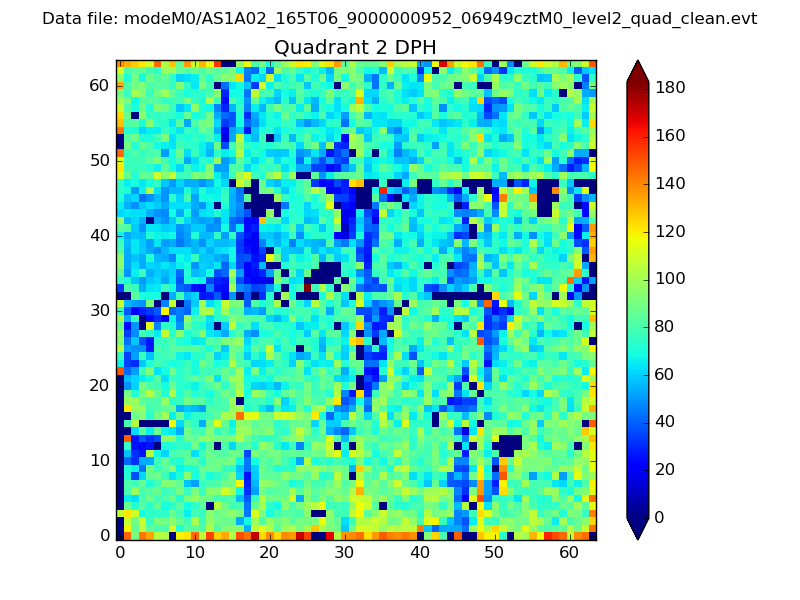
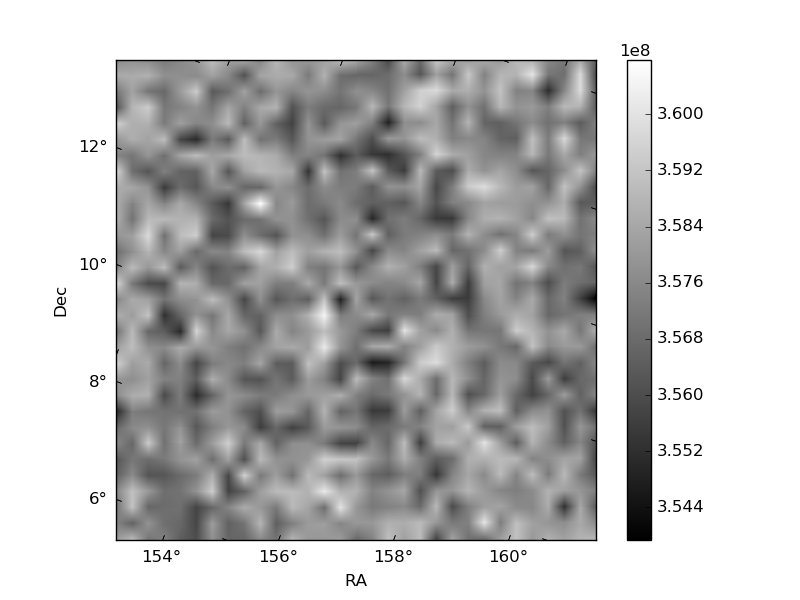
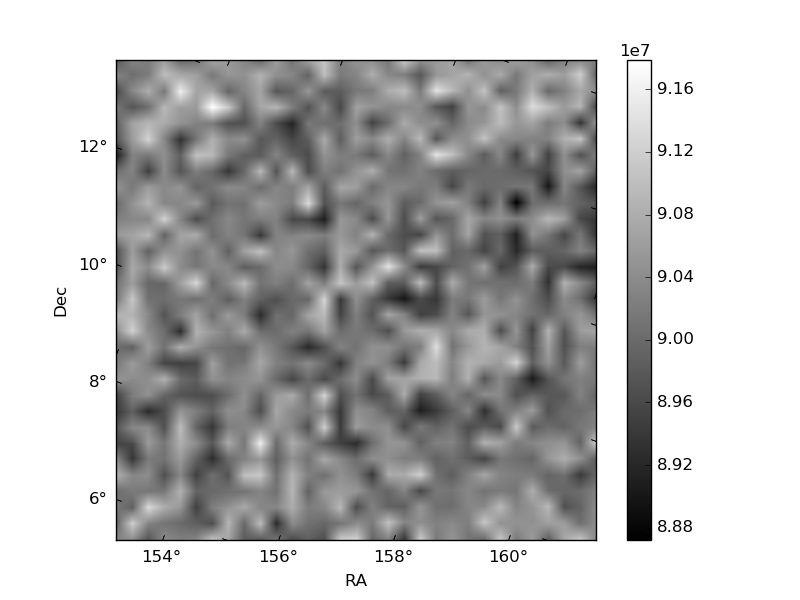
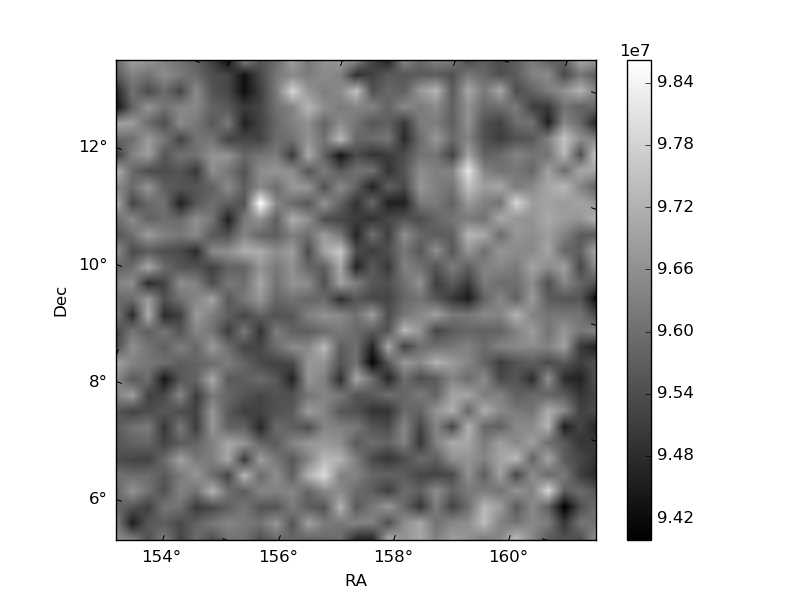
Histogram calculated using DETX and DETY for each event in the final _common_clean file
| Quadrant A |  |
 |
Quadrant B |
|---|---|---|---|
| Quadrant D | 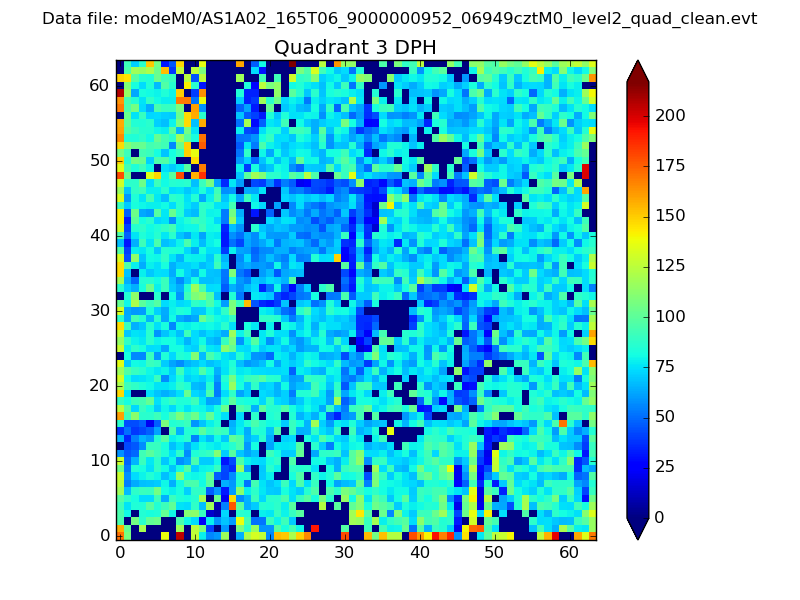 |
 |
Quadrant C |
| Plot type | Count rate plots | Images |
|---|---|---|
| Comparison with Poisson distribution Blue bars denote a histogram of data divided into 1 sec bins. Red curve is a Poisson curve with rate = median count rate of data. |
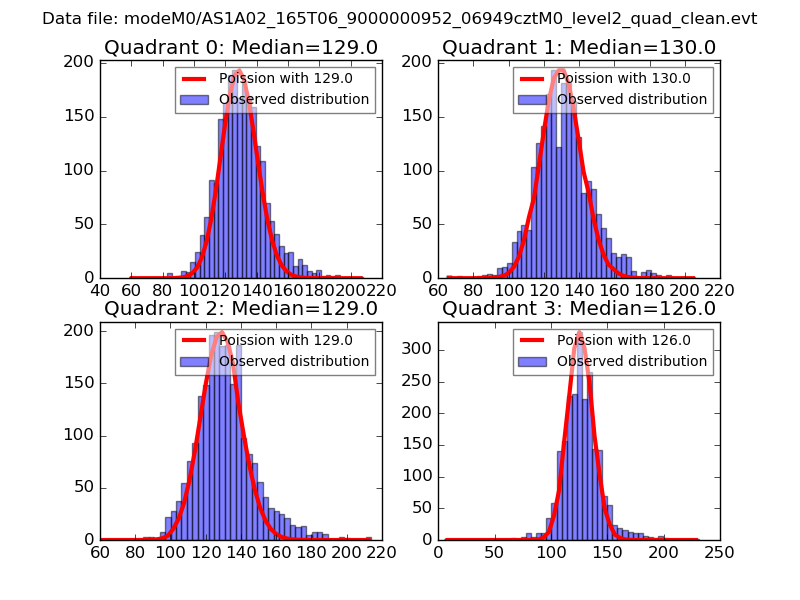 |
 |
| Quadrant-wise count rates Data is divided into 100 sec bins |
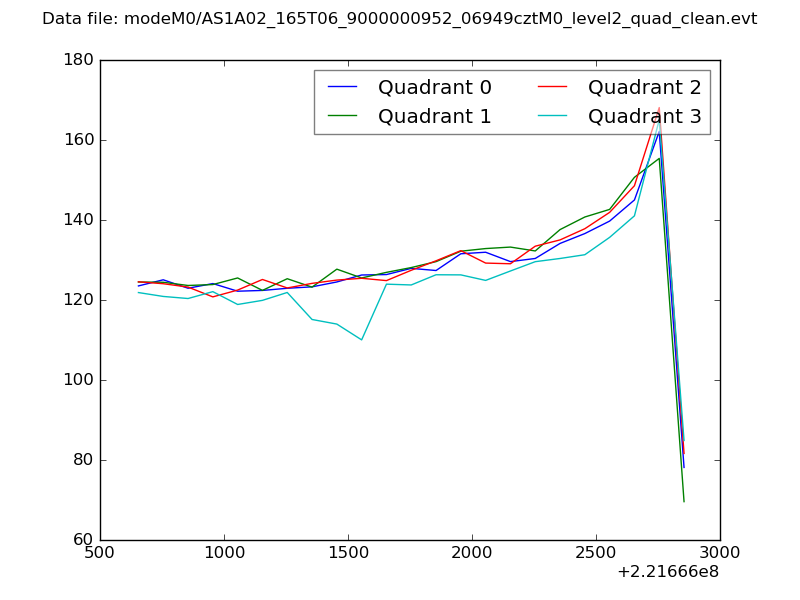 |
|
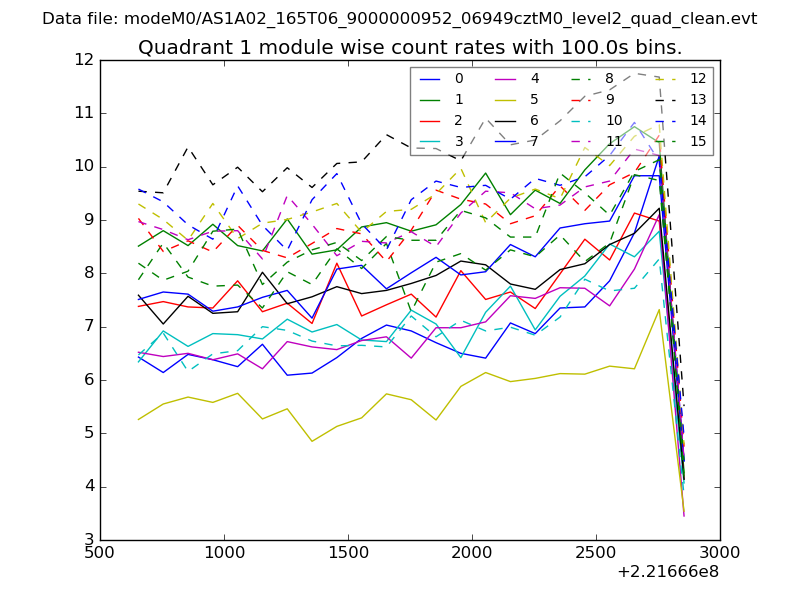
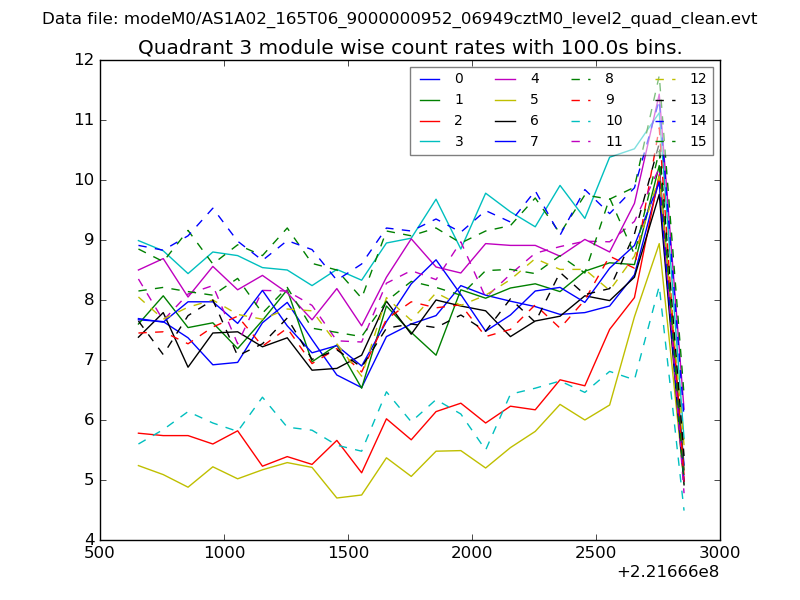
| Module-wise count rates for Quadrant A Data is divided into 100 sec bins |
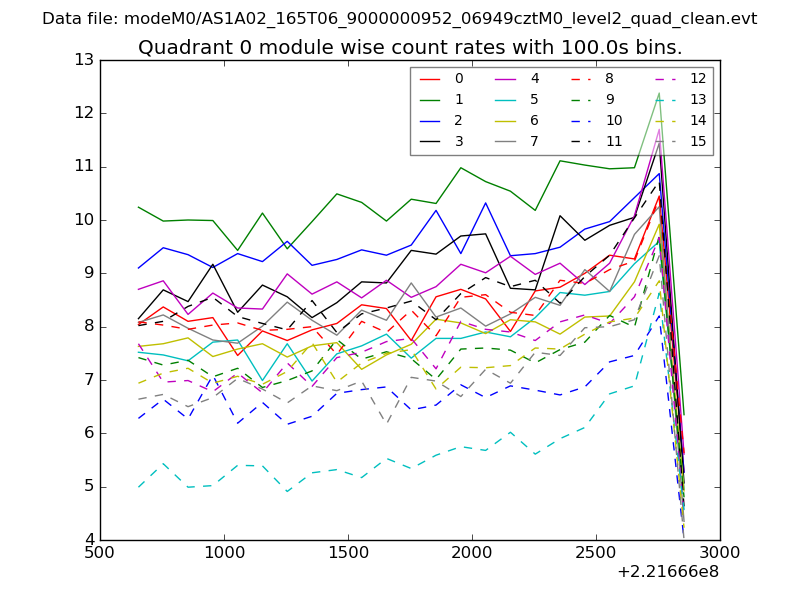 |
 |
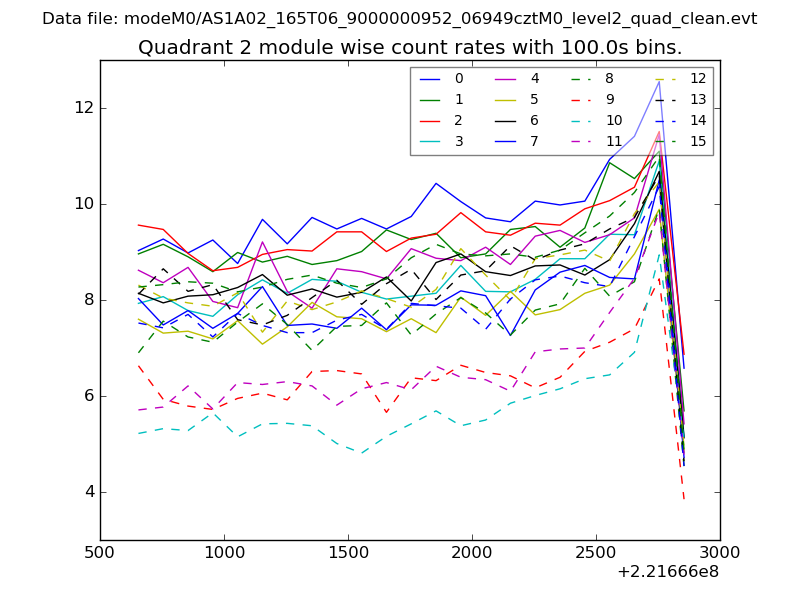
| Module-wise count rates for Quadrant B Data is divided into 100 sec bins |
 |
 |
| Module-wise count rates for Quadrant C Data is divided into 100 sec bins |
 |
 |
| Module-wise count rates for Quadrant D Data is divided into 100 sec bins |
 |
 |
| Parameter | Plot |
|---|---|
| CZT HV Monitor | 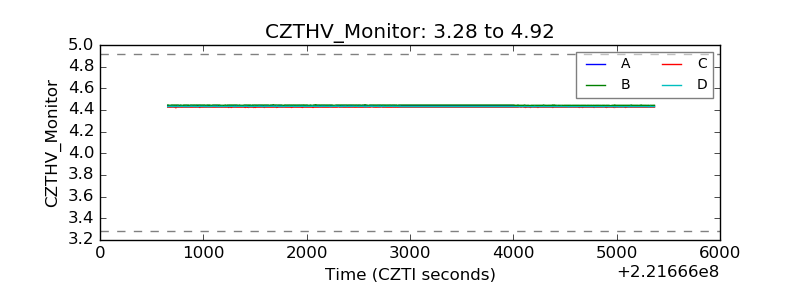 |
| D_VDD | 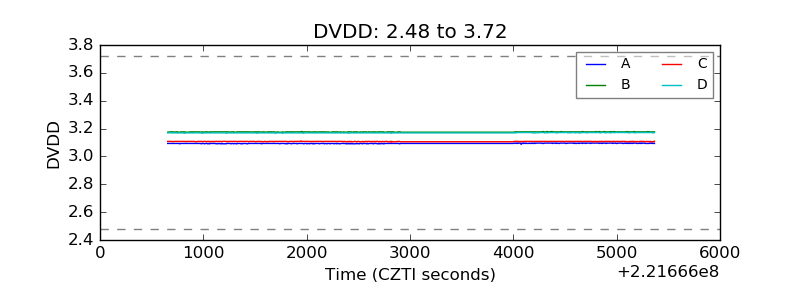 |
| Temperature 1 | 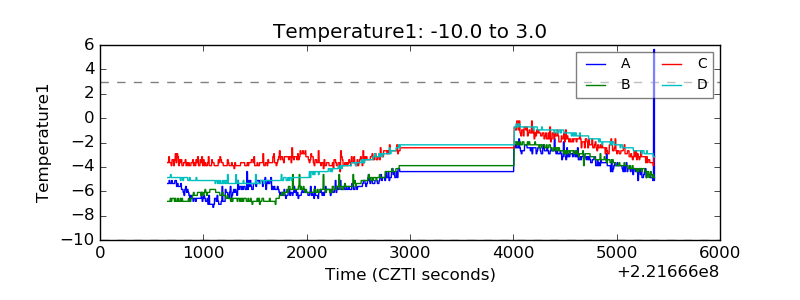 |
| Veto HV Monitor | 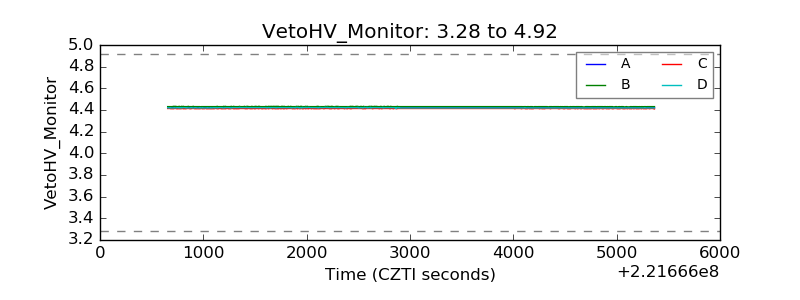 |
| Veto LLD | 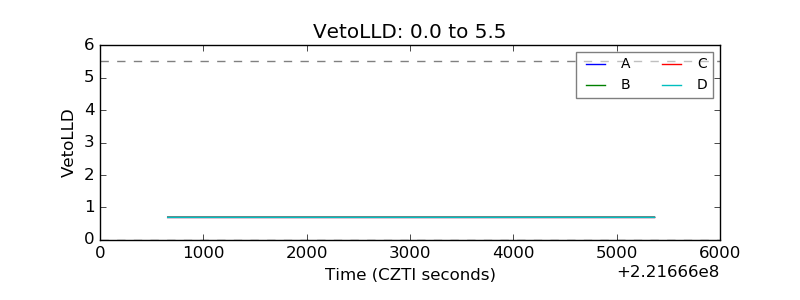 |
| Alpha Counter | 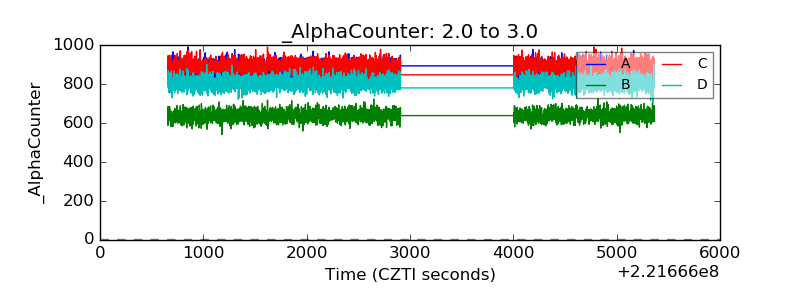 |
| _CPM_Rate | 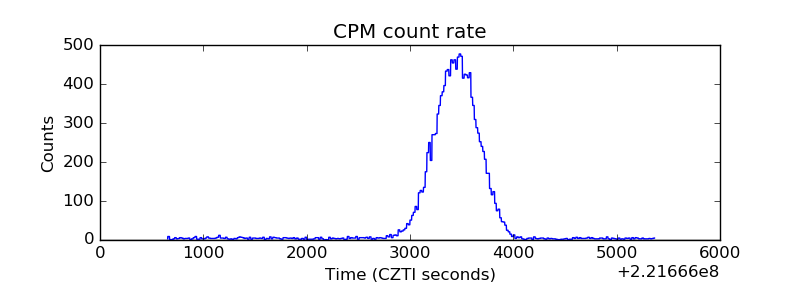 |
| CZT Counter | 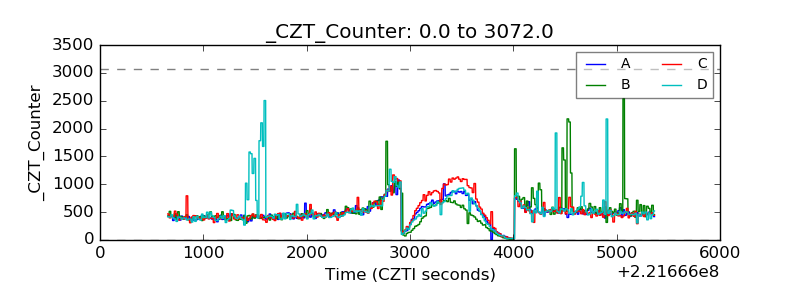 |
| +2.5 Volts monitor | 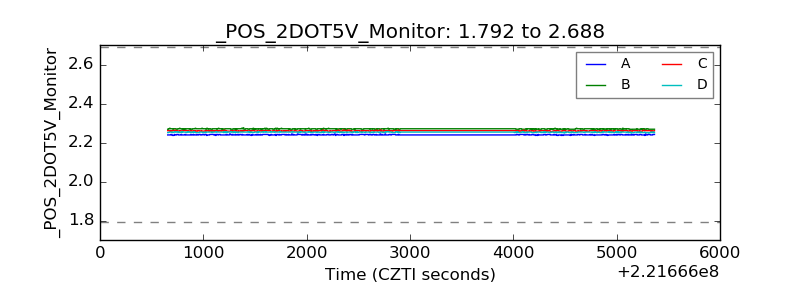 |
| +5 Volts monitor |  |
| _ROLL_ROT | 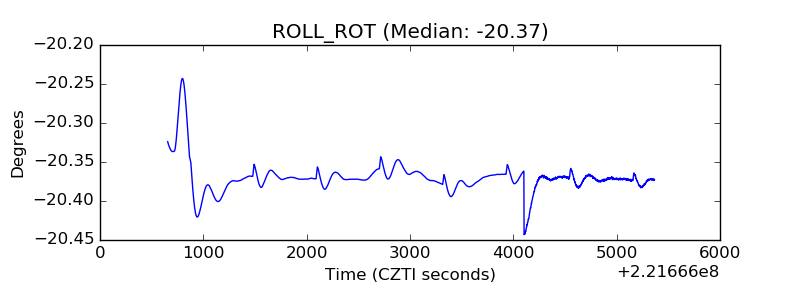 |
| _Roll_DEC | 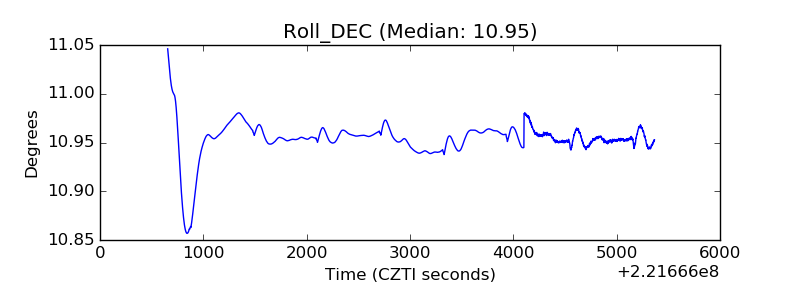 |
| _Roll_RA | 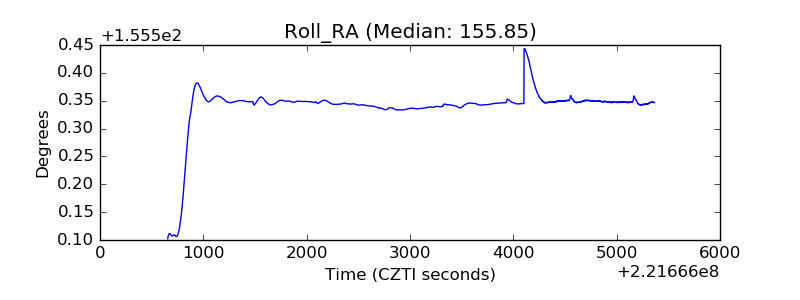 |
| Veto Counter | 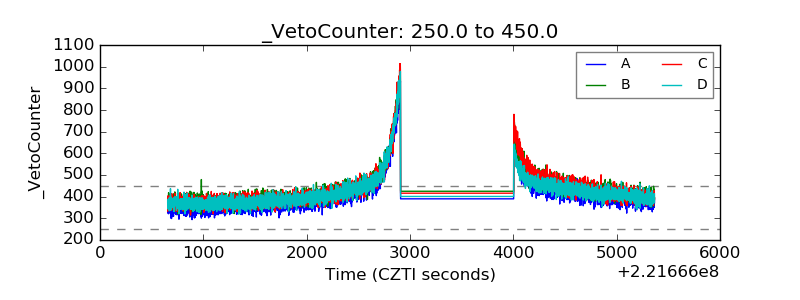 |