| Param | Original file | Final file |
|---|---|---|
| Filename | modeM0/AS1A02_165T06_9000000952_06950cztM0_level2.evt | modeM0/AS1A02_165T06_9000000952_06950cztM0_level2_quad_clean.evt |
| Size (bytes) | 331,352,640 | 68,958,720 |
| Size | 316.0 MB | 65.8 MB |
| Events in quadrant A | 2,285,604 | 437,483 |
| Events in quadrant B | 2,698,565 | 436,789 |
| Events in quadrant C | 2,256,095 | 435,877 |
| Events in quadrant D | 2,448,907 | 422,453 |
| Mode SS | |||
|---|---|---|---|
| Quadrant | BADHDUFLAG | Total packets | Discarded packets |
| A | 0 | 102 | 0 |
| B | 0 | 102 | 0 |
| C | 0 | 102 | 0 |
| D | 0 | 102 | 0 |
| Mode M0 | |||
|---|---|---|---|
| Quadrant | BADHDUFLAG | Total packets | Discarded packets |
| A | 0 | 10285 | 0 |
| B | 0 | 11461 | 0 |
| C | 0 | 10246 | 0 |
| D | 0 | 10701 | 0 |
| Quadrant | Total seconds | Saturated seconds | Saturation percentage |
|---|---|---|---|
| A | 5069 | 3 | 0.059183% |
| B | 5069 | 102 | 2.012231% |
| C | 5069 | 1 | 0.019728% |
| D | 5069 | 12 | 0.236733% |
Noise dominated data is calculated using 1-second bins in cleaned event files. If a bin has >2000 counts, and if more than 50% of those come from <1% of pixels, then it is considered to be noise-dominated and hence unusable.
| Quadrant | # 1 sec bins | Bins with >0 counts | Bins with >2000 counts | High rate bins dominated by noise | Noise dominated (total time) | Noise dominated (detector-on time) | Marked lightcurve |
|---|---|---|---|---|---|---|---|
| A | 5069 | 5069 | 0 | 0 | 0.00% | 0.00% | 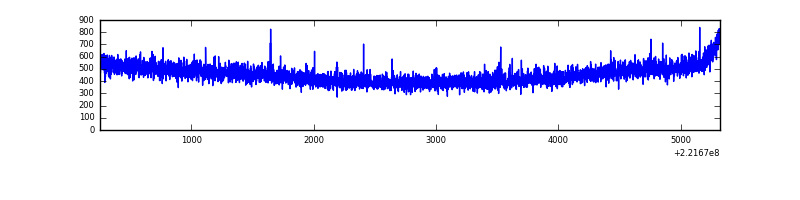 |
| B | 5069 | 5069 | 84 | 84 | 1.66% | 1.66% | 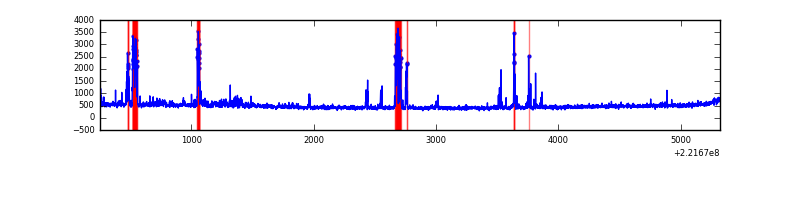 |
| C | 5069 | 5069 | 0 | 0 | 0.00% | 0.00% | 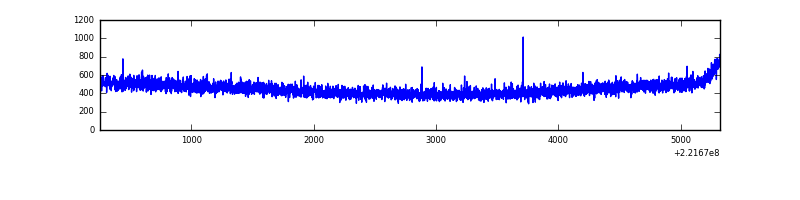 |
| D | 5069 | 5069 | 9 | 9 | 0.18% | 0.18% | 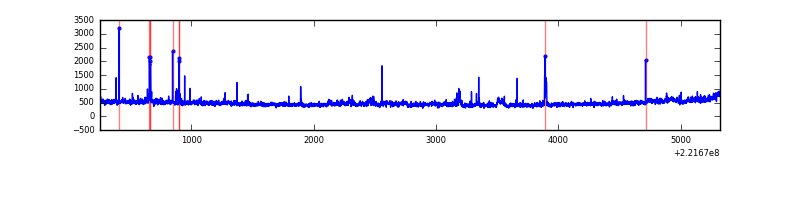 |
Top three noisy pixels from each quadrant. If the there are fewer than three noisy pixels in the level2.evt file, extra rows are filled as -1
| Pixel properties | Quadrant properties | ||||||
|---|---|---|---|---|---|---|---|
| Quadrant | DetID | PixID | Counts | Sigma | Mean | Median | Sigma |
| A | 0 | 226 | 5645 | 41.72 | 592 | 579 | 121.4 |
| A | 12 | 194 | 5321 | 39.05 | 592 | 579 | 121.4 |
| A | 13 | 14 | 2909 | 19.19 | 592 | 579 | 121.4 |
| B | 0 | 219 | 338904 | 3007.38 | 587 | 573 | 112.5 |
| B | 0 | 228 | 58434 | 514.32 | 587 | 573 | 112.5 |
| B | 12 | 111 | 11182 | 94.3 | 587 | 573 | 112.5 |
| C | 13 | 61 | 4660 | 30.54 | 577 | 580 | 133.6 |
| C | 10 | 22 | 1613 | 7.73 | 577 | 580 | 133.6 |
| C | 7 | 247 | 1437 | 6.41 | 577 | 580 | 133.6 |
| D | 8 | 195 | 143478 | 997.14 | 577 | 560 | 143.3 |
| D | 2 | 152 | 32725 | 224.42 | 577 | 560 | 143.3 |
| D | 2 | 14 | 29113 | 199.21 | 577 | 560 | 143.3 |
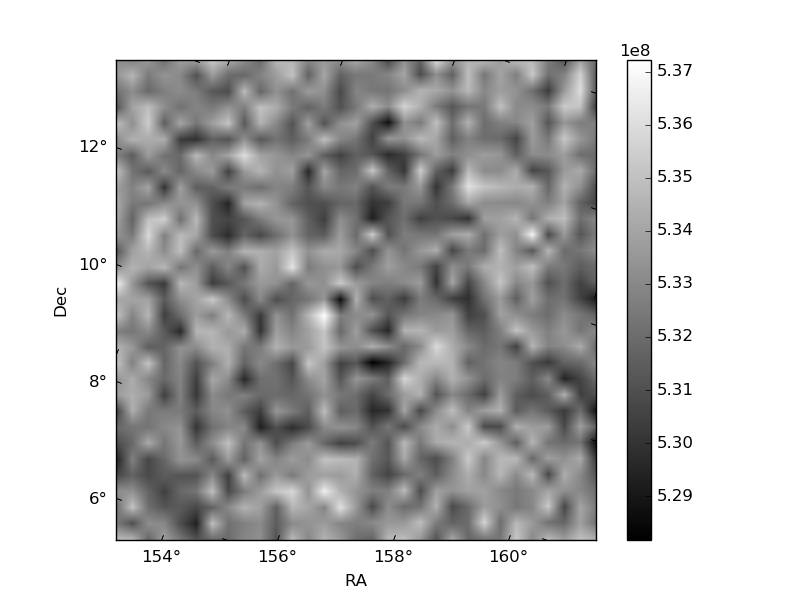
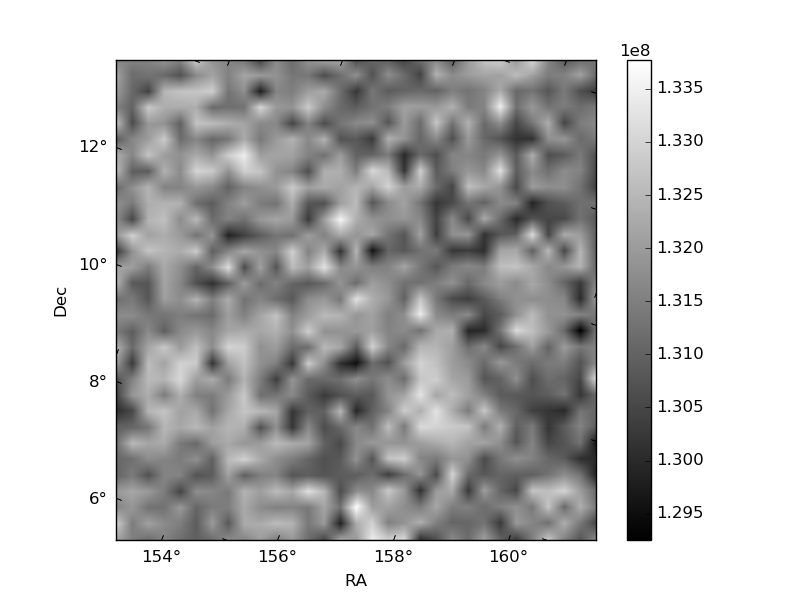
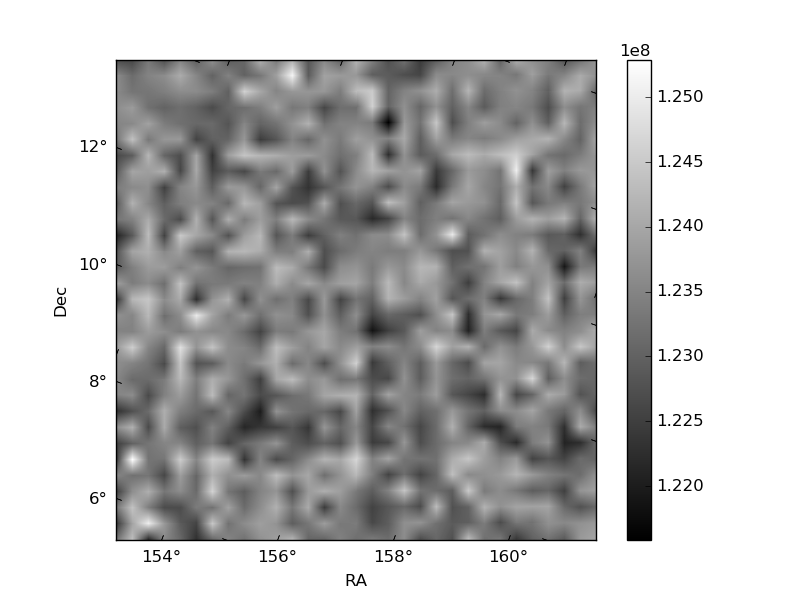
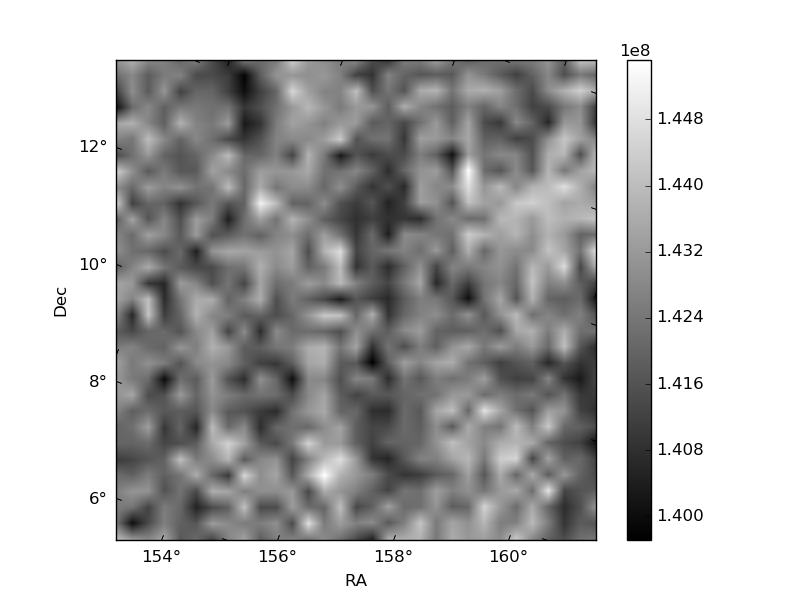
Histogram calculated using DETX and DETY for each event in the final _common_clean file
| Quadrant A | 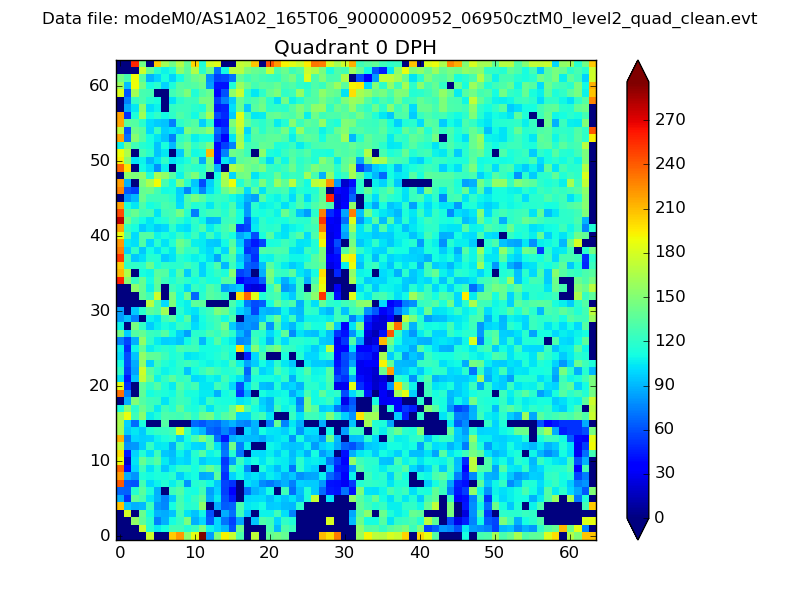 |
 |
Quadrant B |
|---|---|---|---|
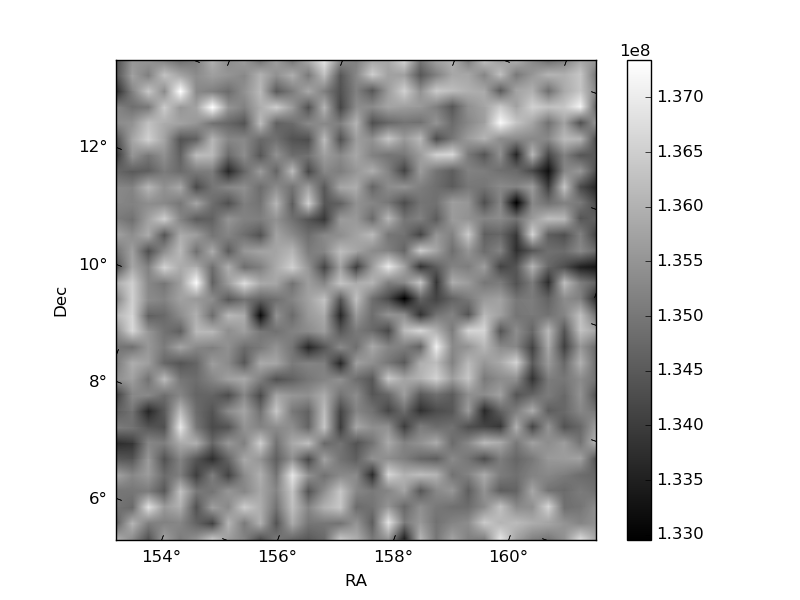
| Quadrant D | 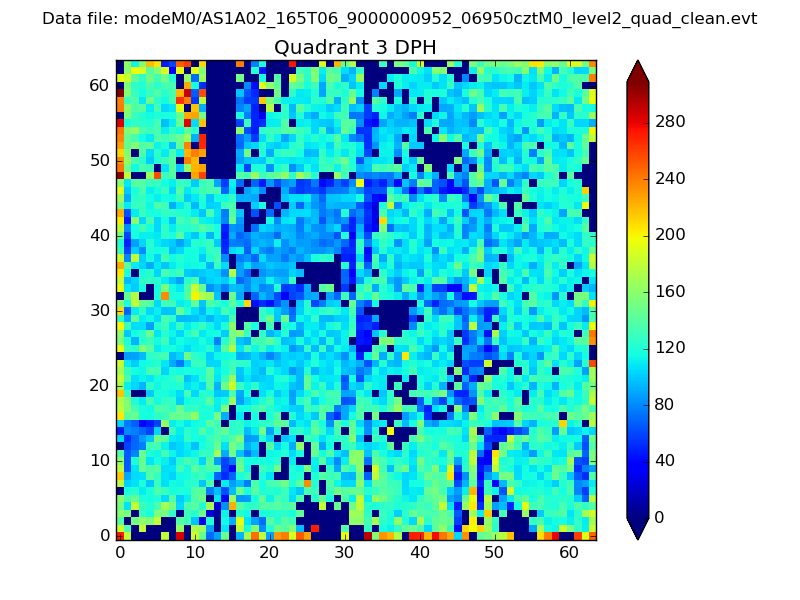 |
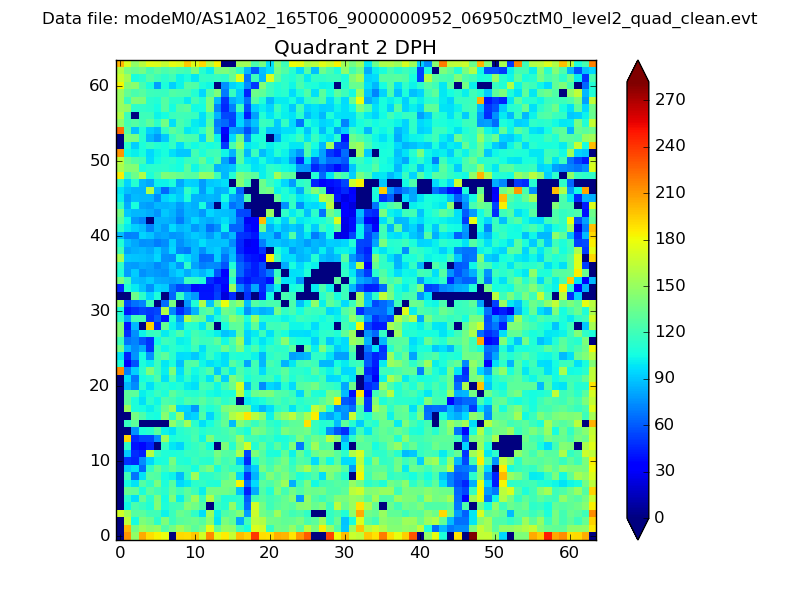 |
Quadrant C |
| Plot type | Count rate plots | Images |
|---|---|---|
| Comparison with Poisson distribution Blue bars denote a histogram of data divided into 1 sec bins. Red curve is a Poisson curve with rate = median count rate of data. |
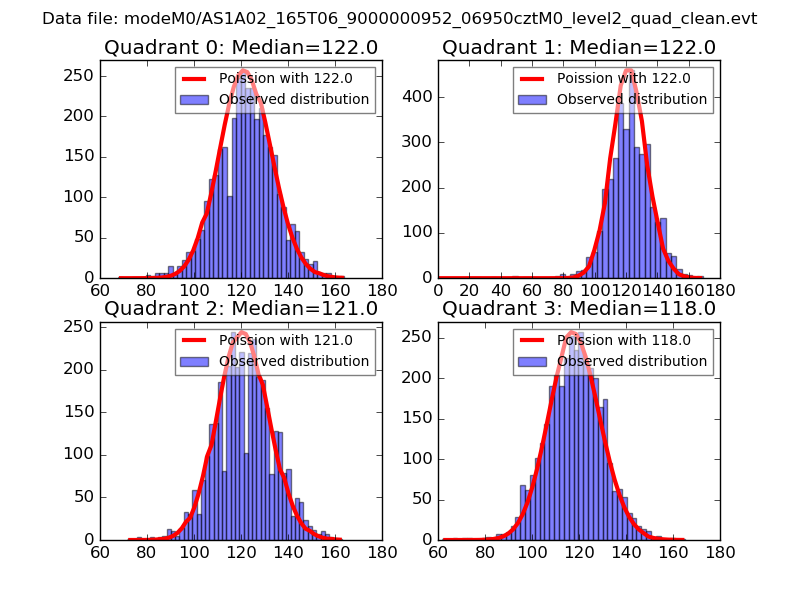 |
 |
| Quadrant-wise count rates Data is divided into 100 sec bins |
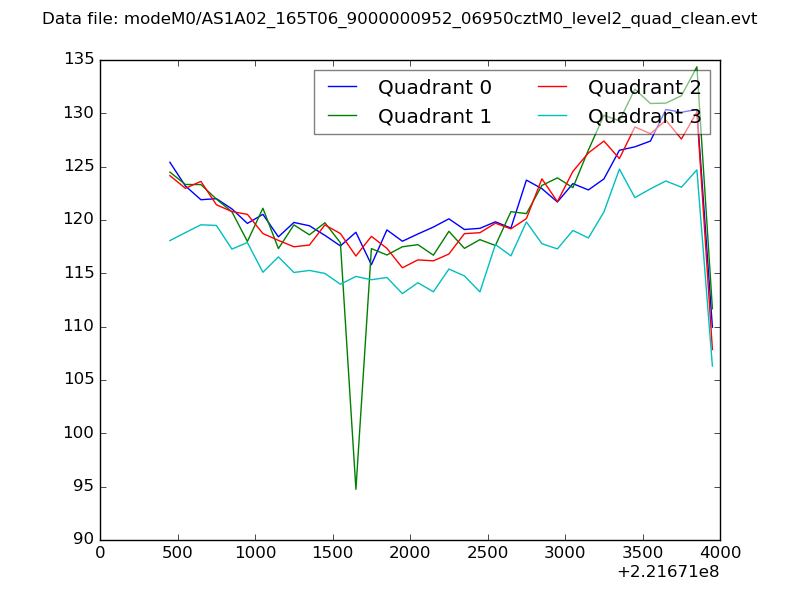 |
|
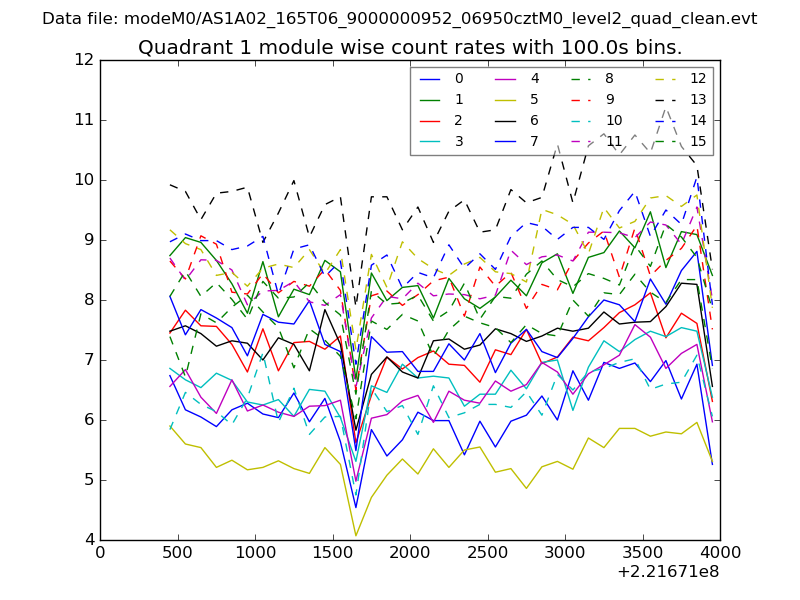
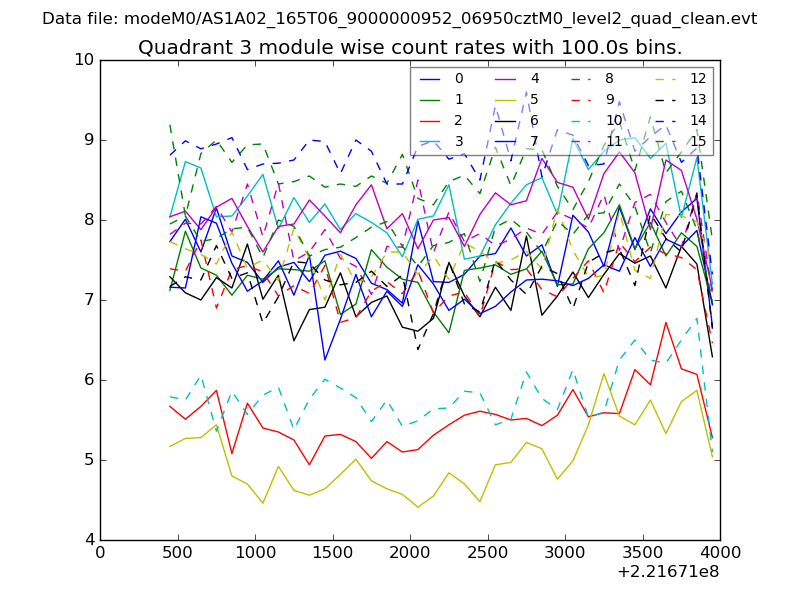
| Module-wise count rates for Quadrant A Data is divided into 100 sec bins |
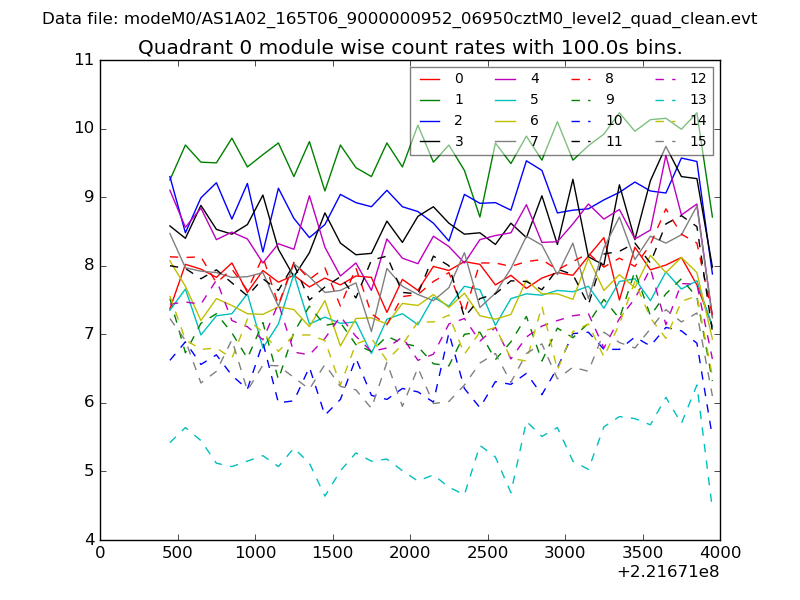 |
 |
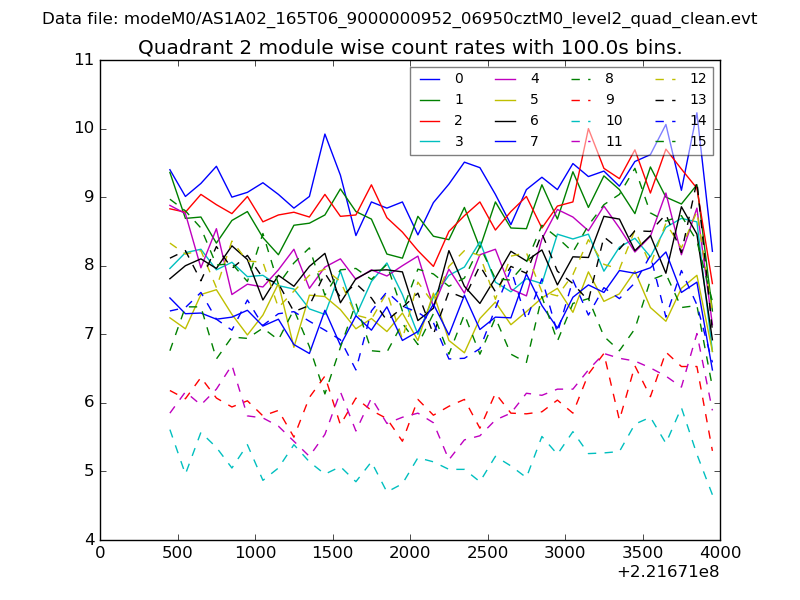
| Module-wise count rates for Quadrant B Data is divided into 100 sec bins |
 |
 |
| Module-wise count rates for Quadrant C Data is divided into 100 sec bins |
 |
 |
| Module-wise count rates for Quadrant D Data is divided into 100 sec bins |
 |
 |
| Parameter | Plot |
|---|---|
| CZT HV Monitor | 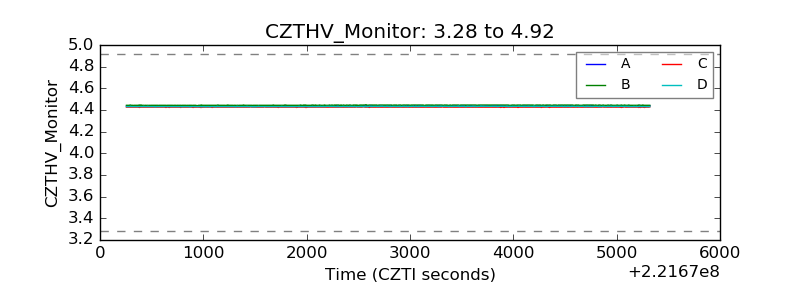 |
| D_VDD | 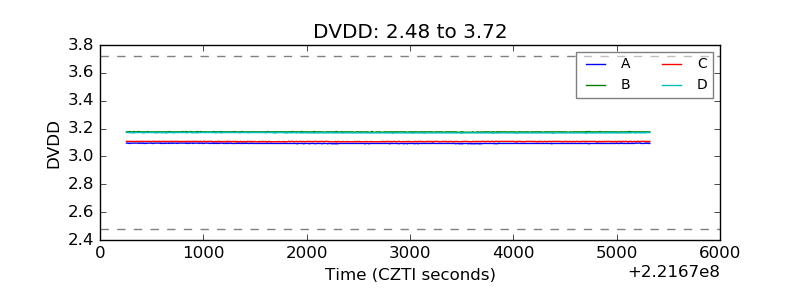 |
| Temperature 1 | 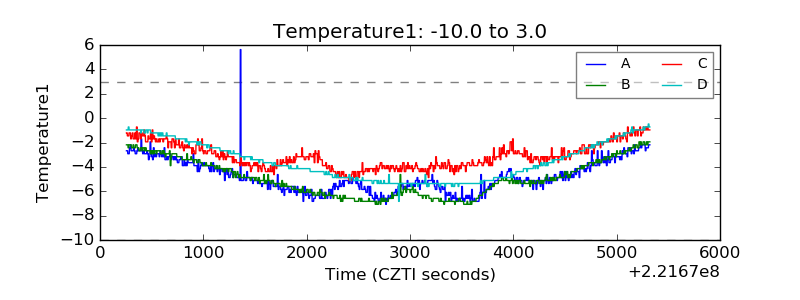 |
| Veto HV Monitor | 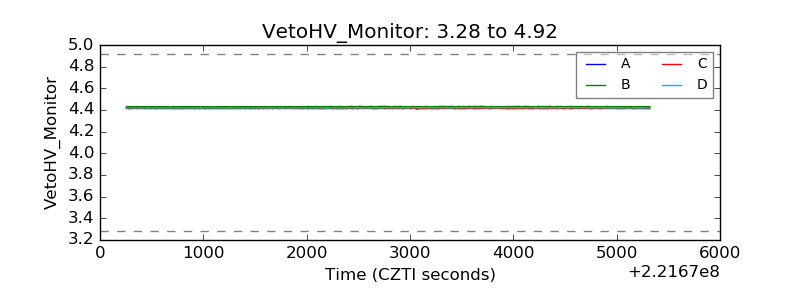 |
| Veto LLD | 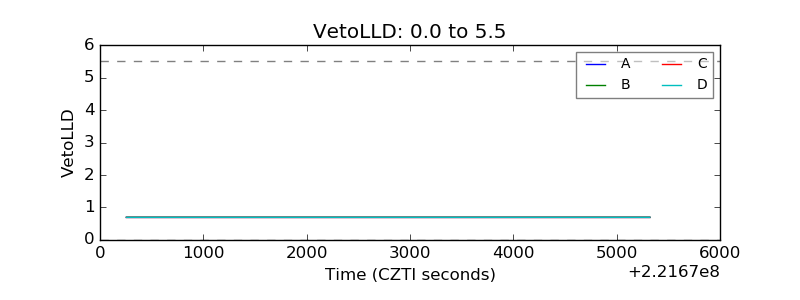 |
| Alpha Counter | 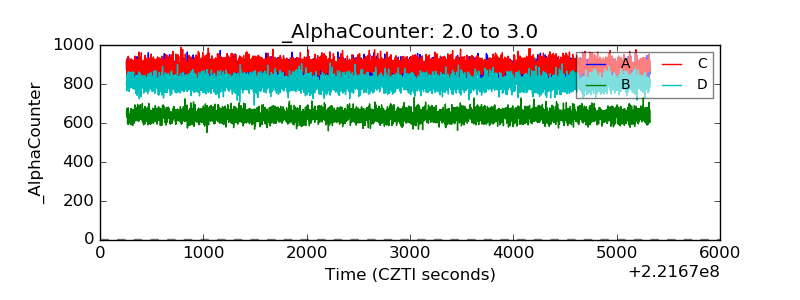 |
| _CPM_Rate | 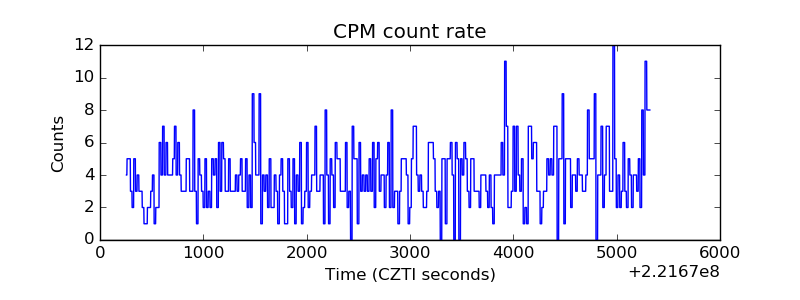 |
| CZT Counter | 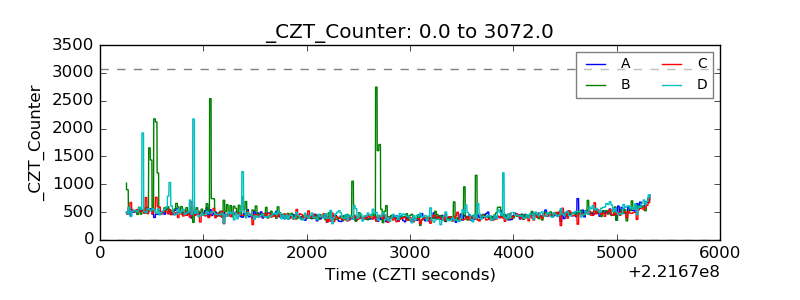 |
| +2.5 Volts monitor | 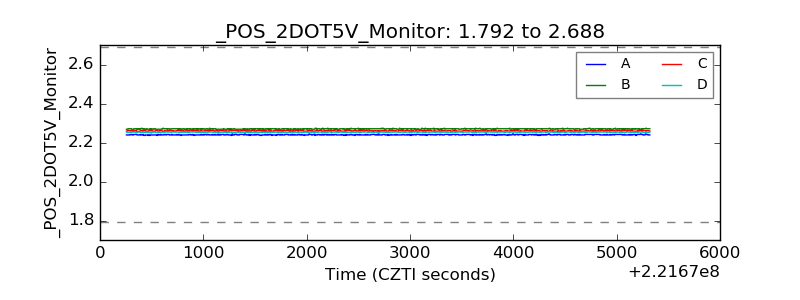 |
| +5 Volts monitor |  |
| _ROLL_ROT | 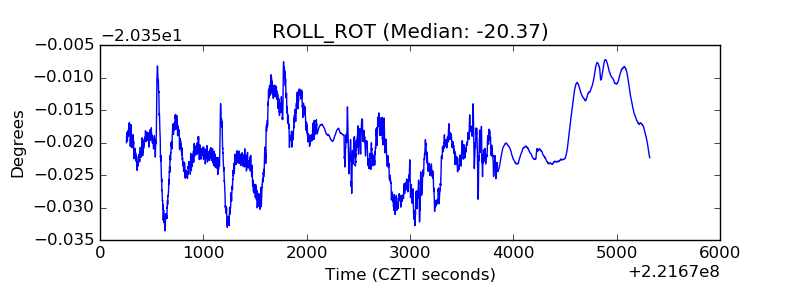 |
| _Roll_DEC | 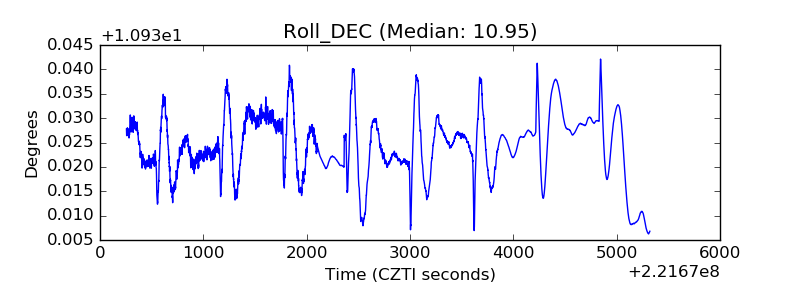 |
| _Roll_RA | 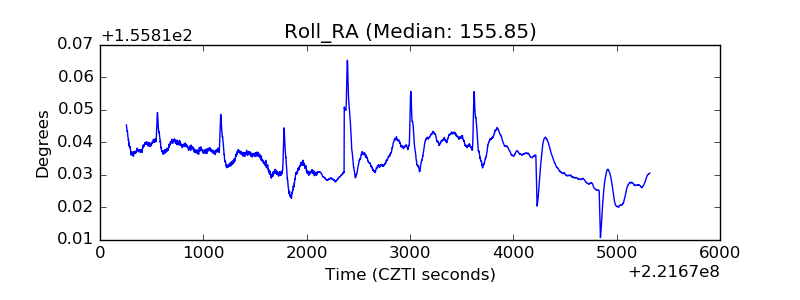 |
| Veto Counter | 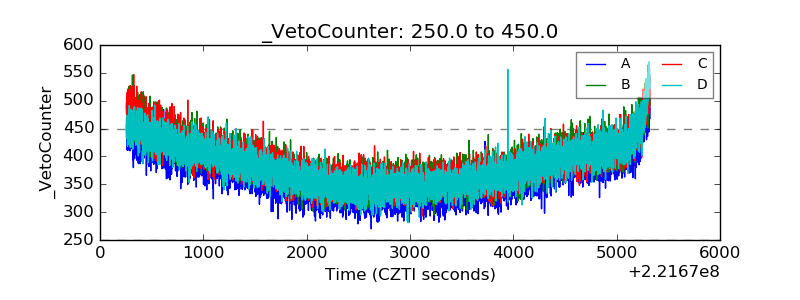 |